


Top Altcoins Price Forecast: Ripple, Cardano, Solana – Strong recovery signals breakout rally
- XRP is up 2% on Friday, trading around $1.52 amid firm institutional demand.
- Solana extends over 3% gains despite mixed momentum and ETF outflows.
- Cardano is up over 3%, inching closer to testing a bullish breakout of the key resistance level near $0.2632.
Top altcoins, including Ripple (XRP), Cardano (ADA), and Solana (SOL), are trading in the green, with gains of over 2% so far on Friday. The recovery aligns with Bitcoin (BTC) rising above $86,000 at press time, likely driven by strong inflows into Exchange Traded Funds (ETFs). Ripple sees similar institutional support, while Solana ETFs' daily inflows turn negative and Cardano’s retail support remains stable. The technical outlook for XRP, ADA, and SOL is bullish as the broader cryptocurrency market recovers.
XRP and SOL institutional flows
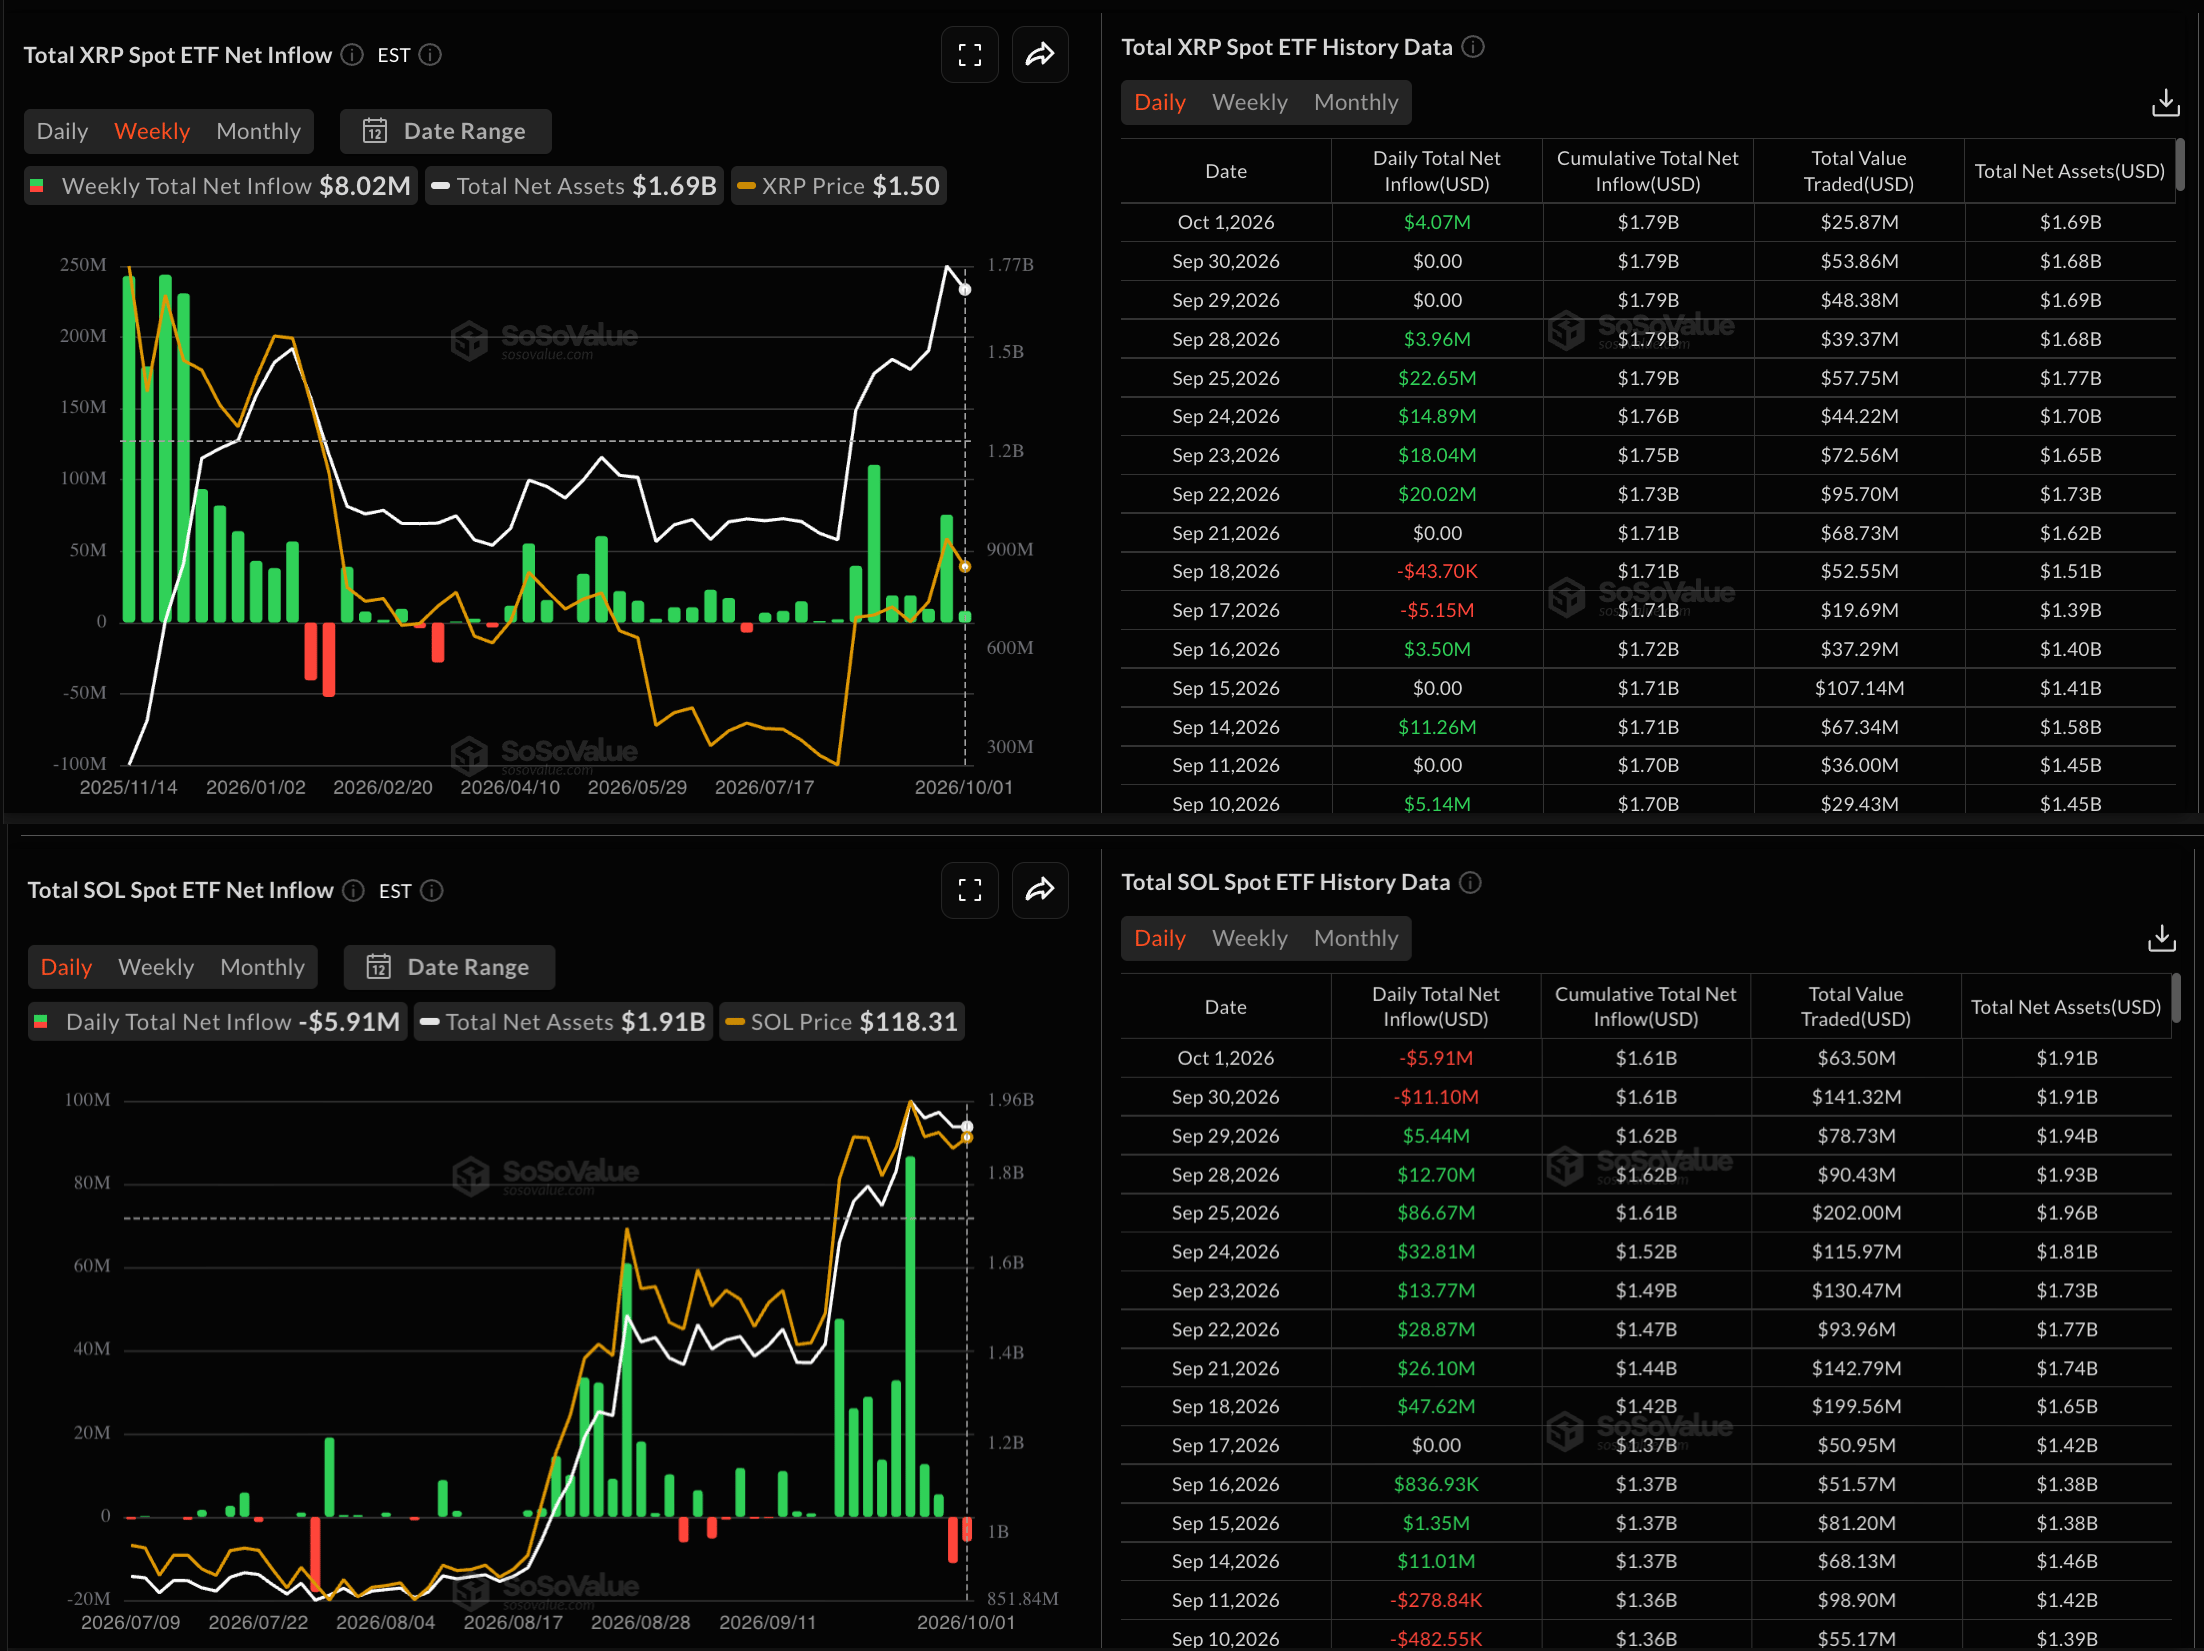
XRP-focused ETFs recorded $4.07 million in inflows on Thursday after two consecutive days of zero inflows. Taken together, with the $3.96 million early on Monday, the total weekly inflow stands at $8.02 million so far. Despite the positive inflow, the weekly inflow remains well below last week's $75.59 million, suggesting easing institutional support.
On the other hand, Solana ETFs recorded $5.91 million in outflows on Thursday, after an $11.19 million outflow the previous day. The two consecutive days of outflows have reduced the weekly total inflow to $1.13 million so far, significantly lower than last week's $188.22 million, suggesting a sharp decline in institutional support.
Ripple reclaims $1.50 as bullish momentum resurfaces
XRP is up 2% on Friday, extending a steady recovery above the $1.500 psychological level. The cross-border remittance token sits well above the 50-, 100-, and 200-day Exponential Moving Averages (EMAs) at $1.3822, $1.3193, and $1.3765, respectively. The 50- and 200-day EMAs form a golden cross pattern on the daily chart, which typically suggests a bullish trend reversal.
A confirmed breakout above the February 6 high at $1.5442 could extend the rally toward the $1.8209 level set by the November 21 low.
Momentum on the daily chart remains neutral to bullish, with the Relative Strength Index (RSI) at 59, suggesting constructive but not overbought momentum, while the Moving Average Convergence Divergence line hovers around its signal line with a flat histogram.
On the downside, the 50-day EMA serves as the immediate support at $1.3822, reinforced by the 200-day EMA at $1.3765. Any deeper pullback could attract dip buying near the 100-day EMA at $1.3193.
Cardano extends gains on firm retail demand
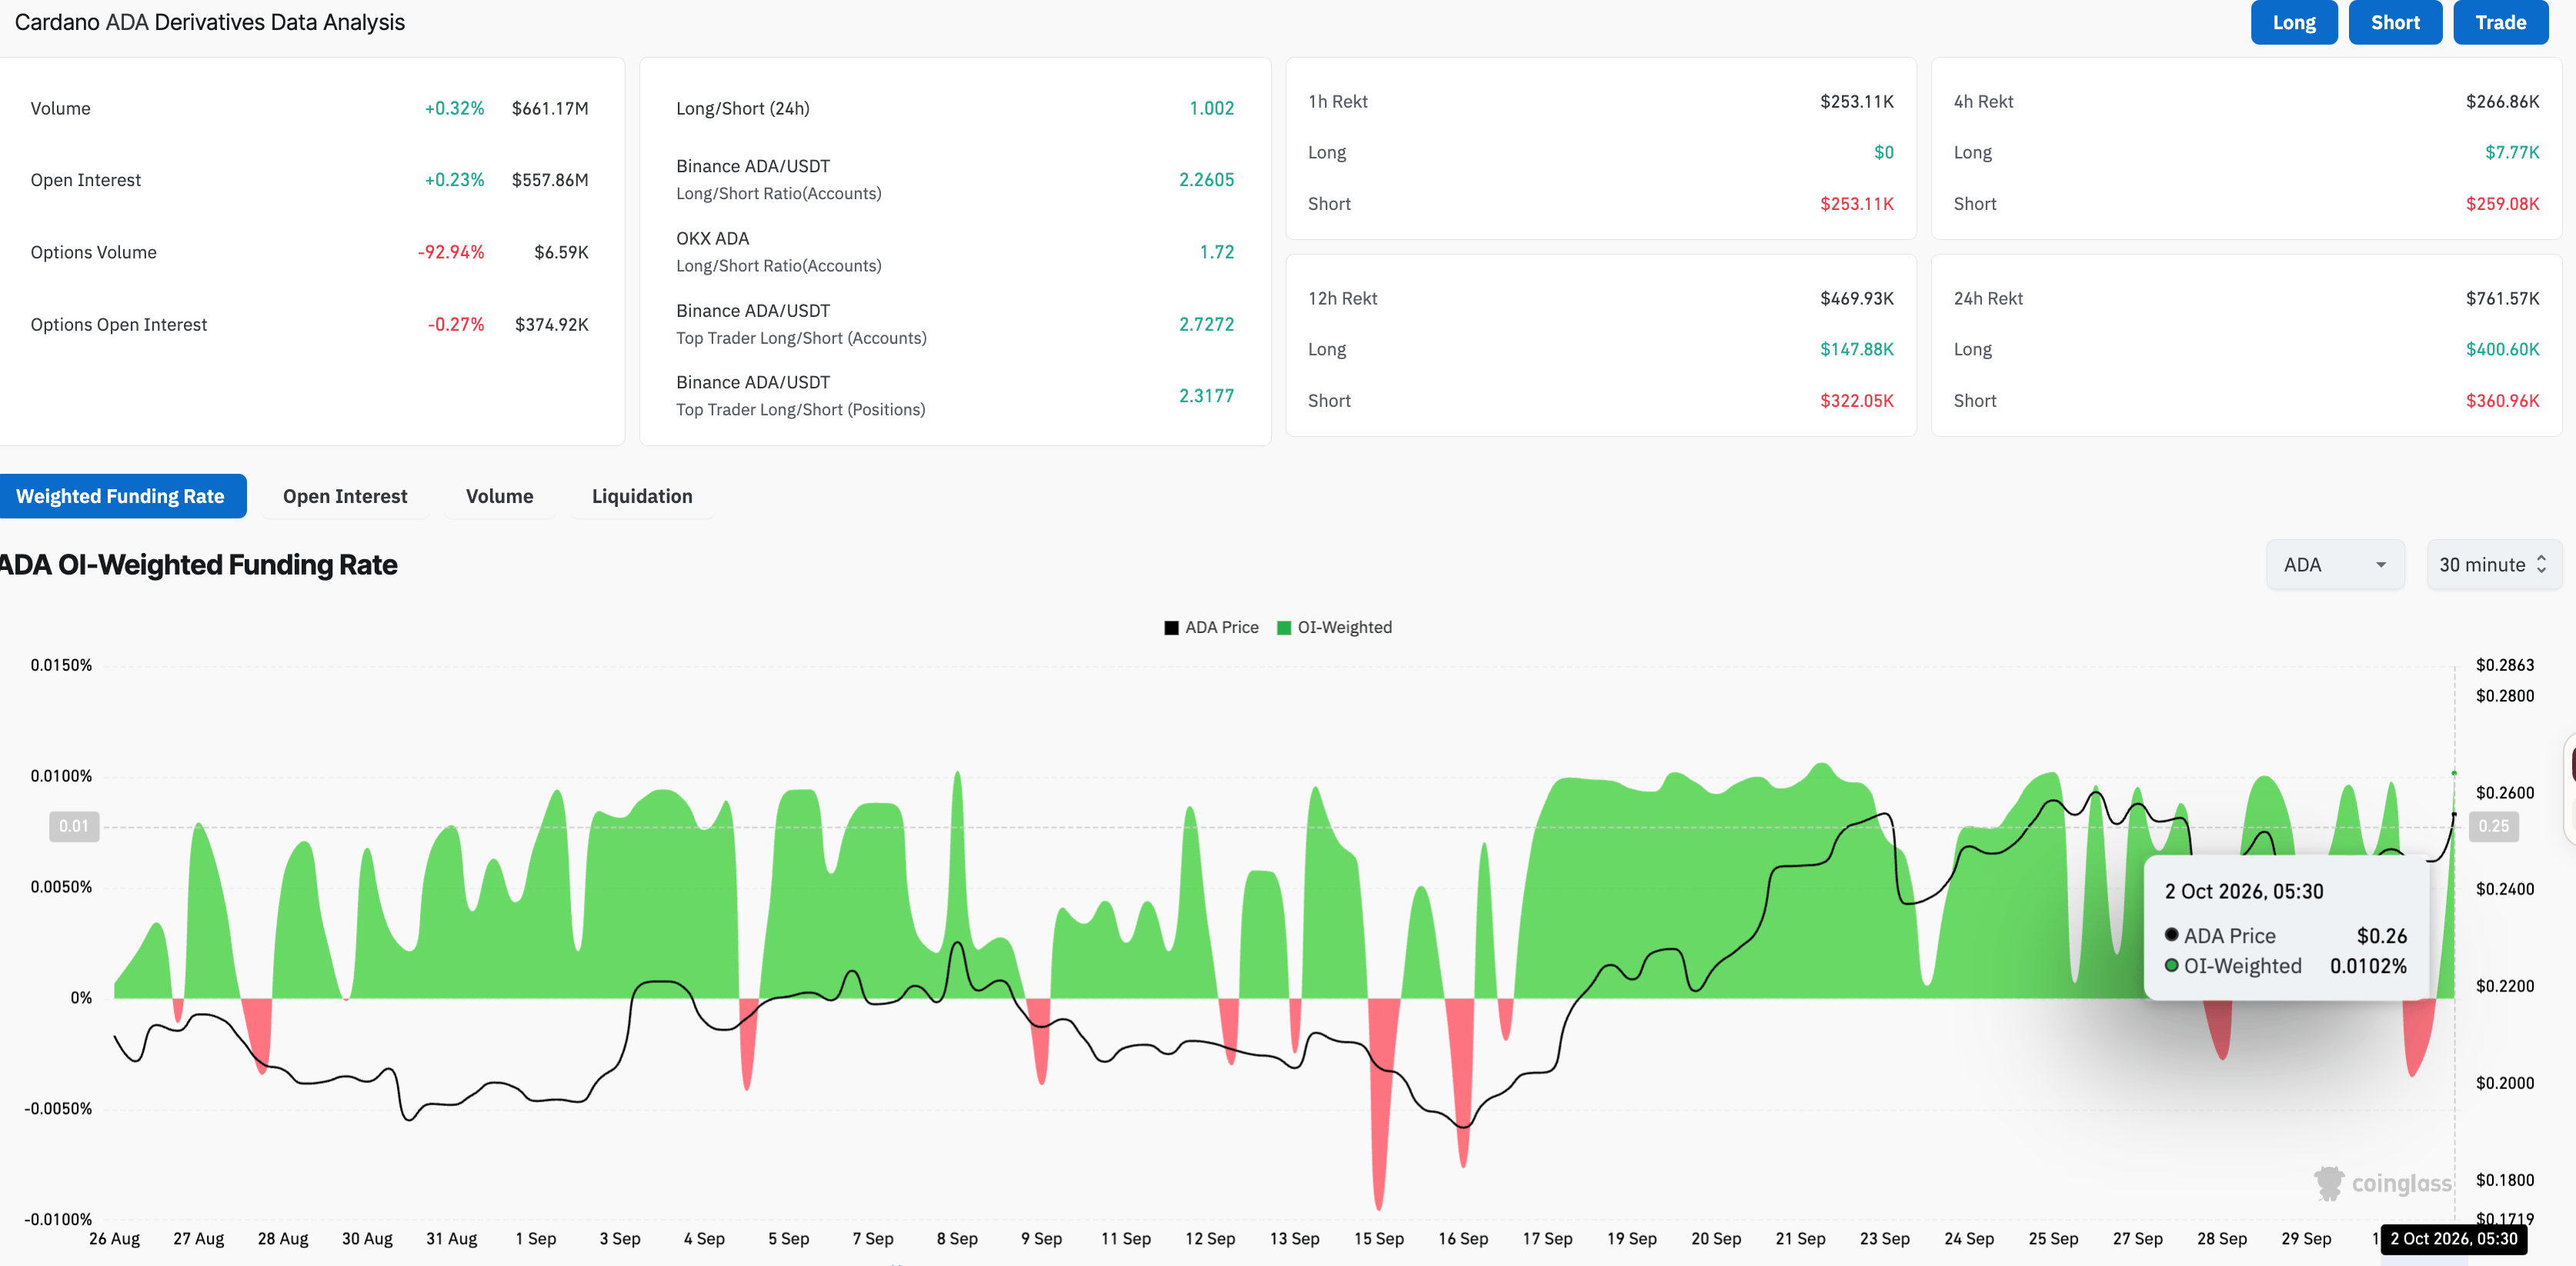
Cardano is holding firm to its retail support. CoinGlass data shows ADA futures Open Interest (OI) holding marginal gains over the past 24 hours at $557.86 million, suggesting firm positive positional buildup. The OI-weighted funding rate has surged to 0.0102%, up from -0.0011% the previous day, indicating strong interest among traders in buying ADA long contracts, anticipating further upside.
Cardano hovers above $0.2500, with over 3% gains so far on Friday. ADA maintains a firm bullish bias as it holds above the 50-, 100-, and 200-day EMAs at $0.22104, $0.2123, and $0.2406, respectively.
The immediate resistance for Cardano aligns with the 78.6% Fibonacci retracement at $0.2632, measured from $0.3136 to $0.1385. A confirmed breakout above this level could target the $0.3136 swing high, setting up for a potential extended rally to the 127.2% Fibonacci extension level at $0.3916.
Momentum on the daily chart remains constructive, with the RSI at 63 pointing upward and further room to the upside before reaching overbought conditions, while the MACD remains marginally above its signal line.
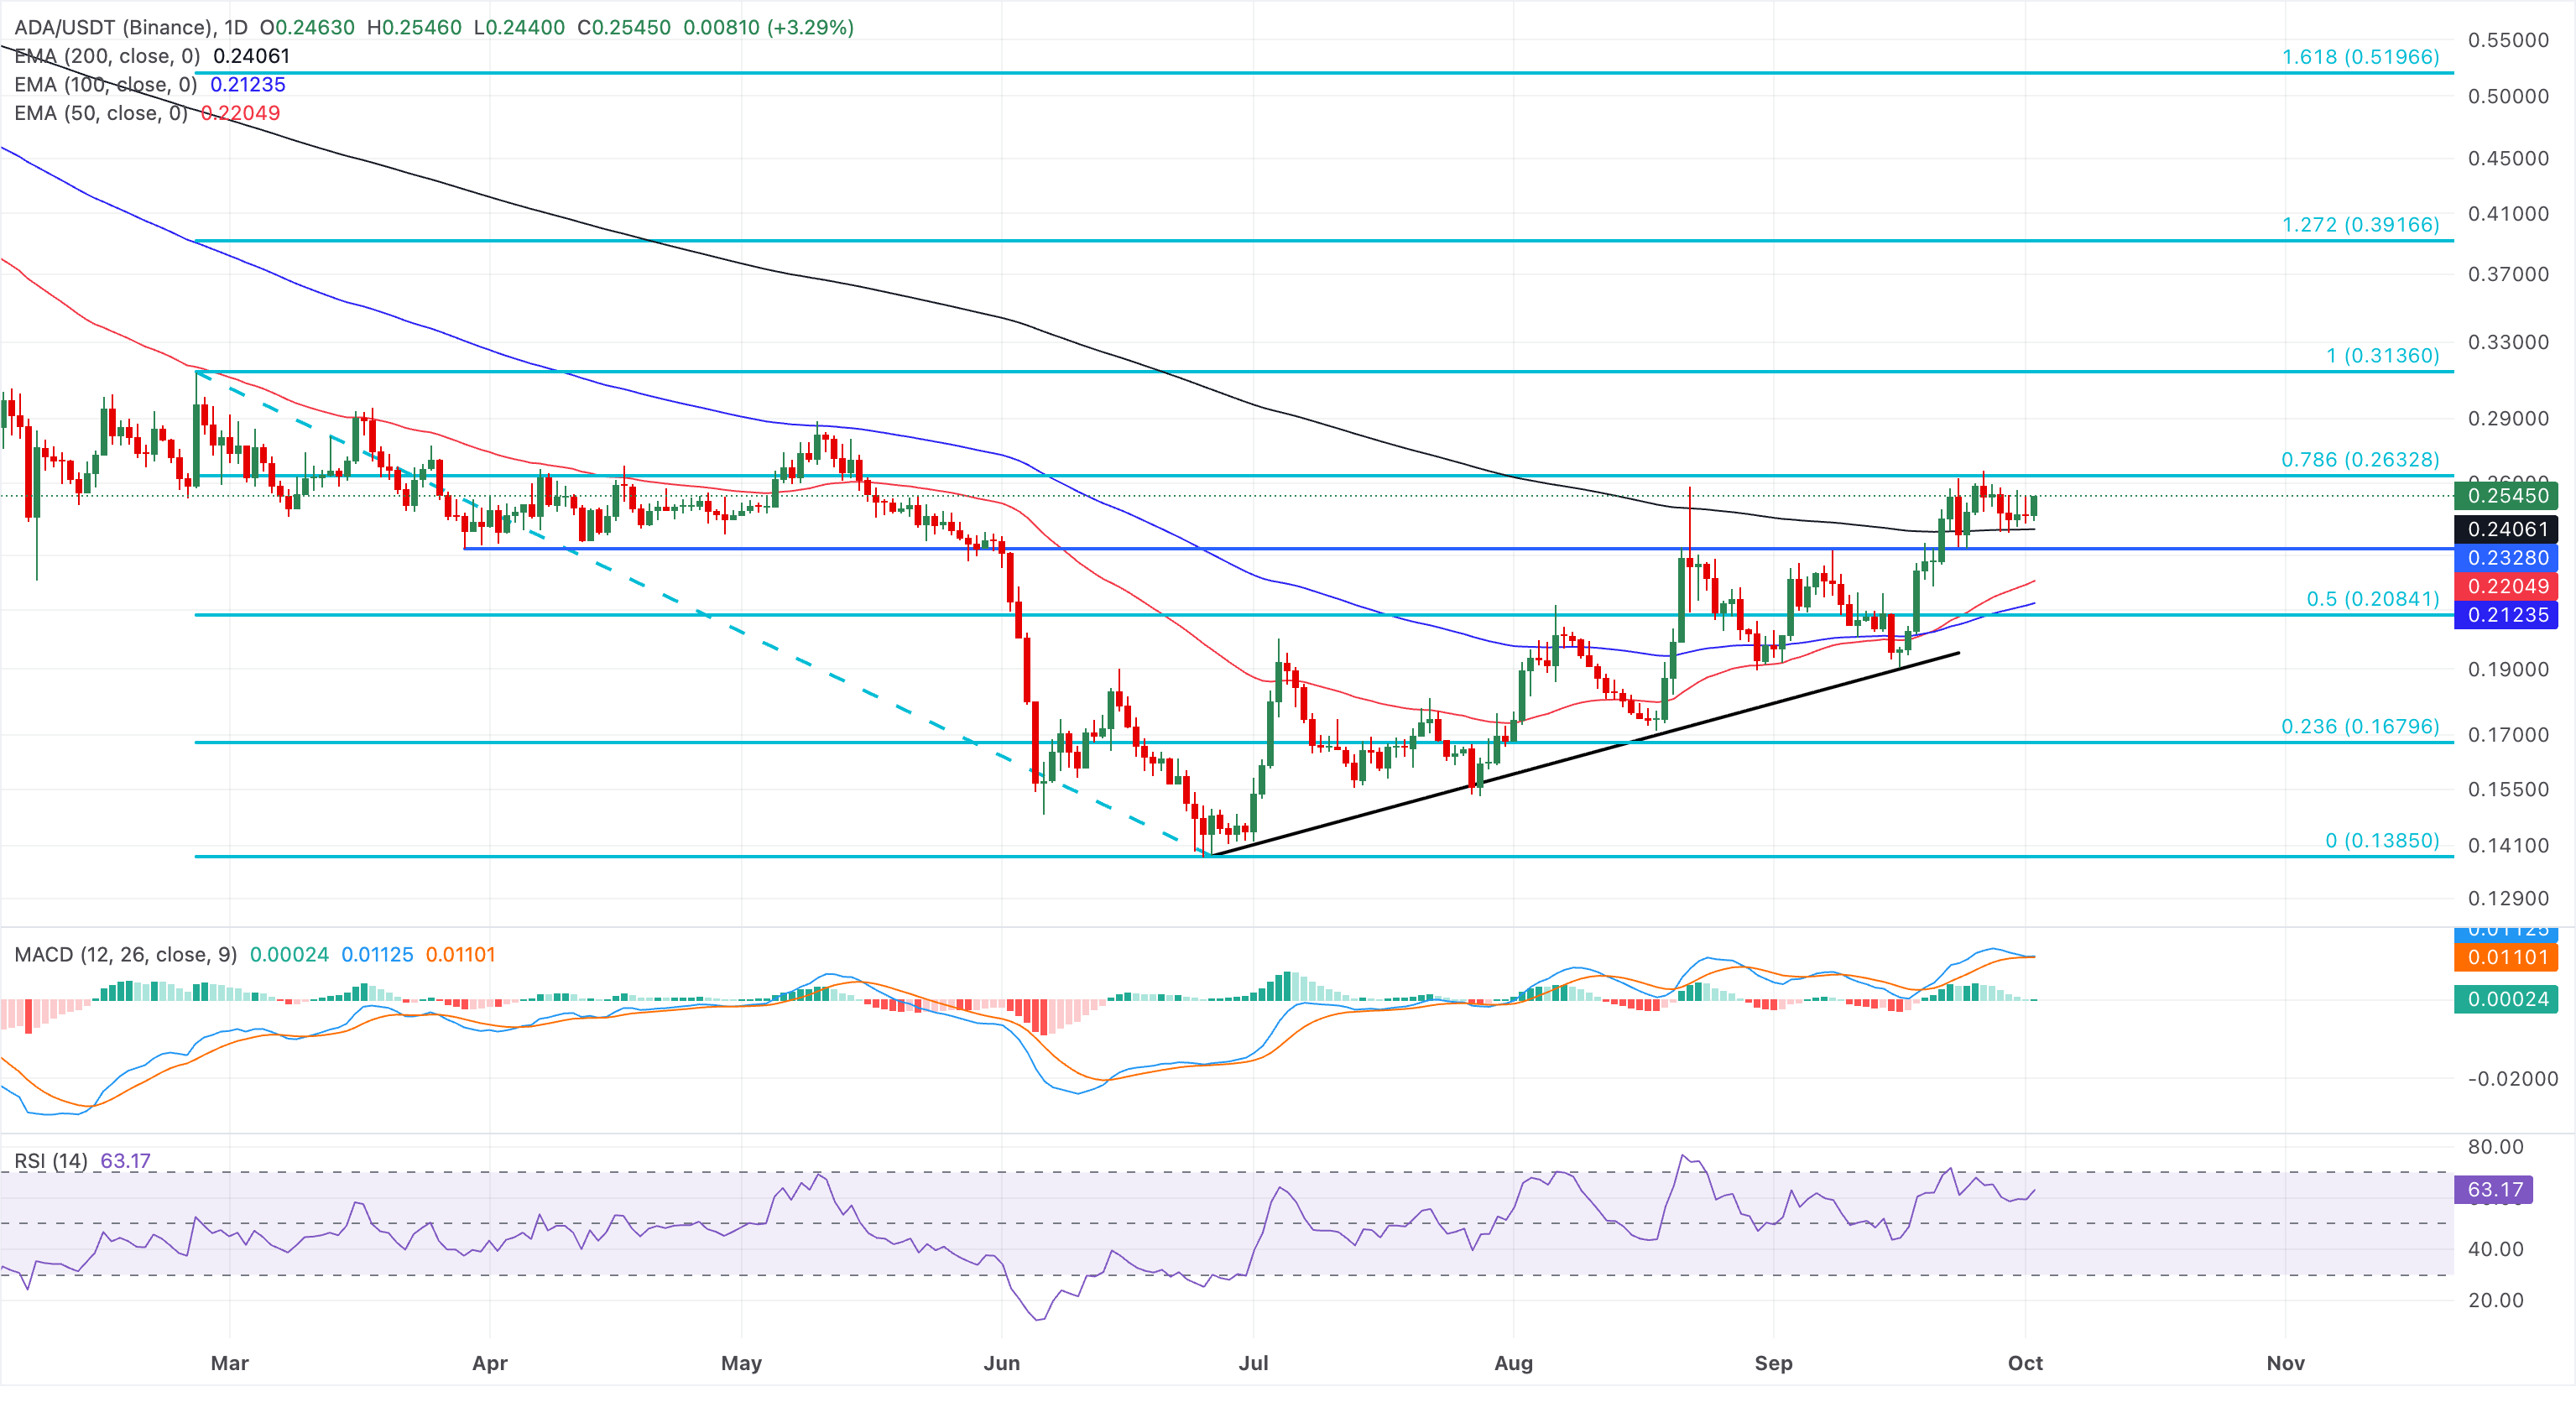
Looking down, the 200-day EMA at $0.2406 has served as a critical support over the past week, whereas a decisive breakdown could target the 50-day EMA at $0.2204 and the 100-day EMA at $0.2123.
Solana rally above $120 signals further upside
Solana is up over 3% at press time on Friday, trading around $122, with bulls aiming for a breakout above a range that has formed over the past week. A confirmed breakout above the September 25 high of $122.94 could signal further upside, opening the path toward the January 13 high at $148.74.
Momentum remains constructive on the daily chart, with the RSI near 66, suggesting strong bullish pressure, despite the MACD and signal line flattening in positive territory, hinting at potential consolidation.
In addition, a bullish crossover between the 100- and 200-day EMAs at $95.96 and $95.76 reaffirms the strong bullish trend.
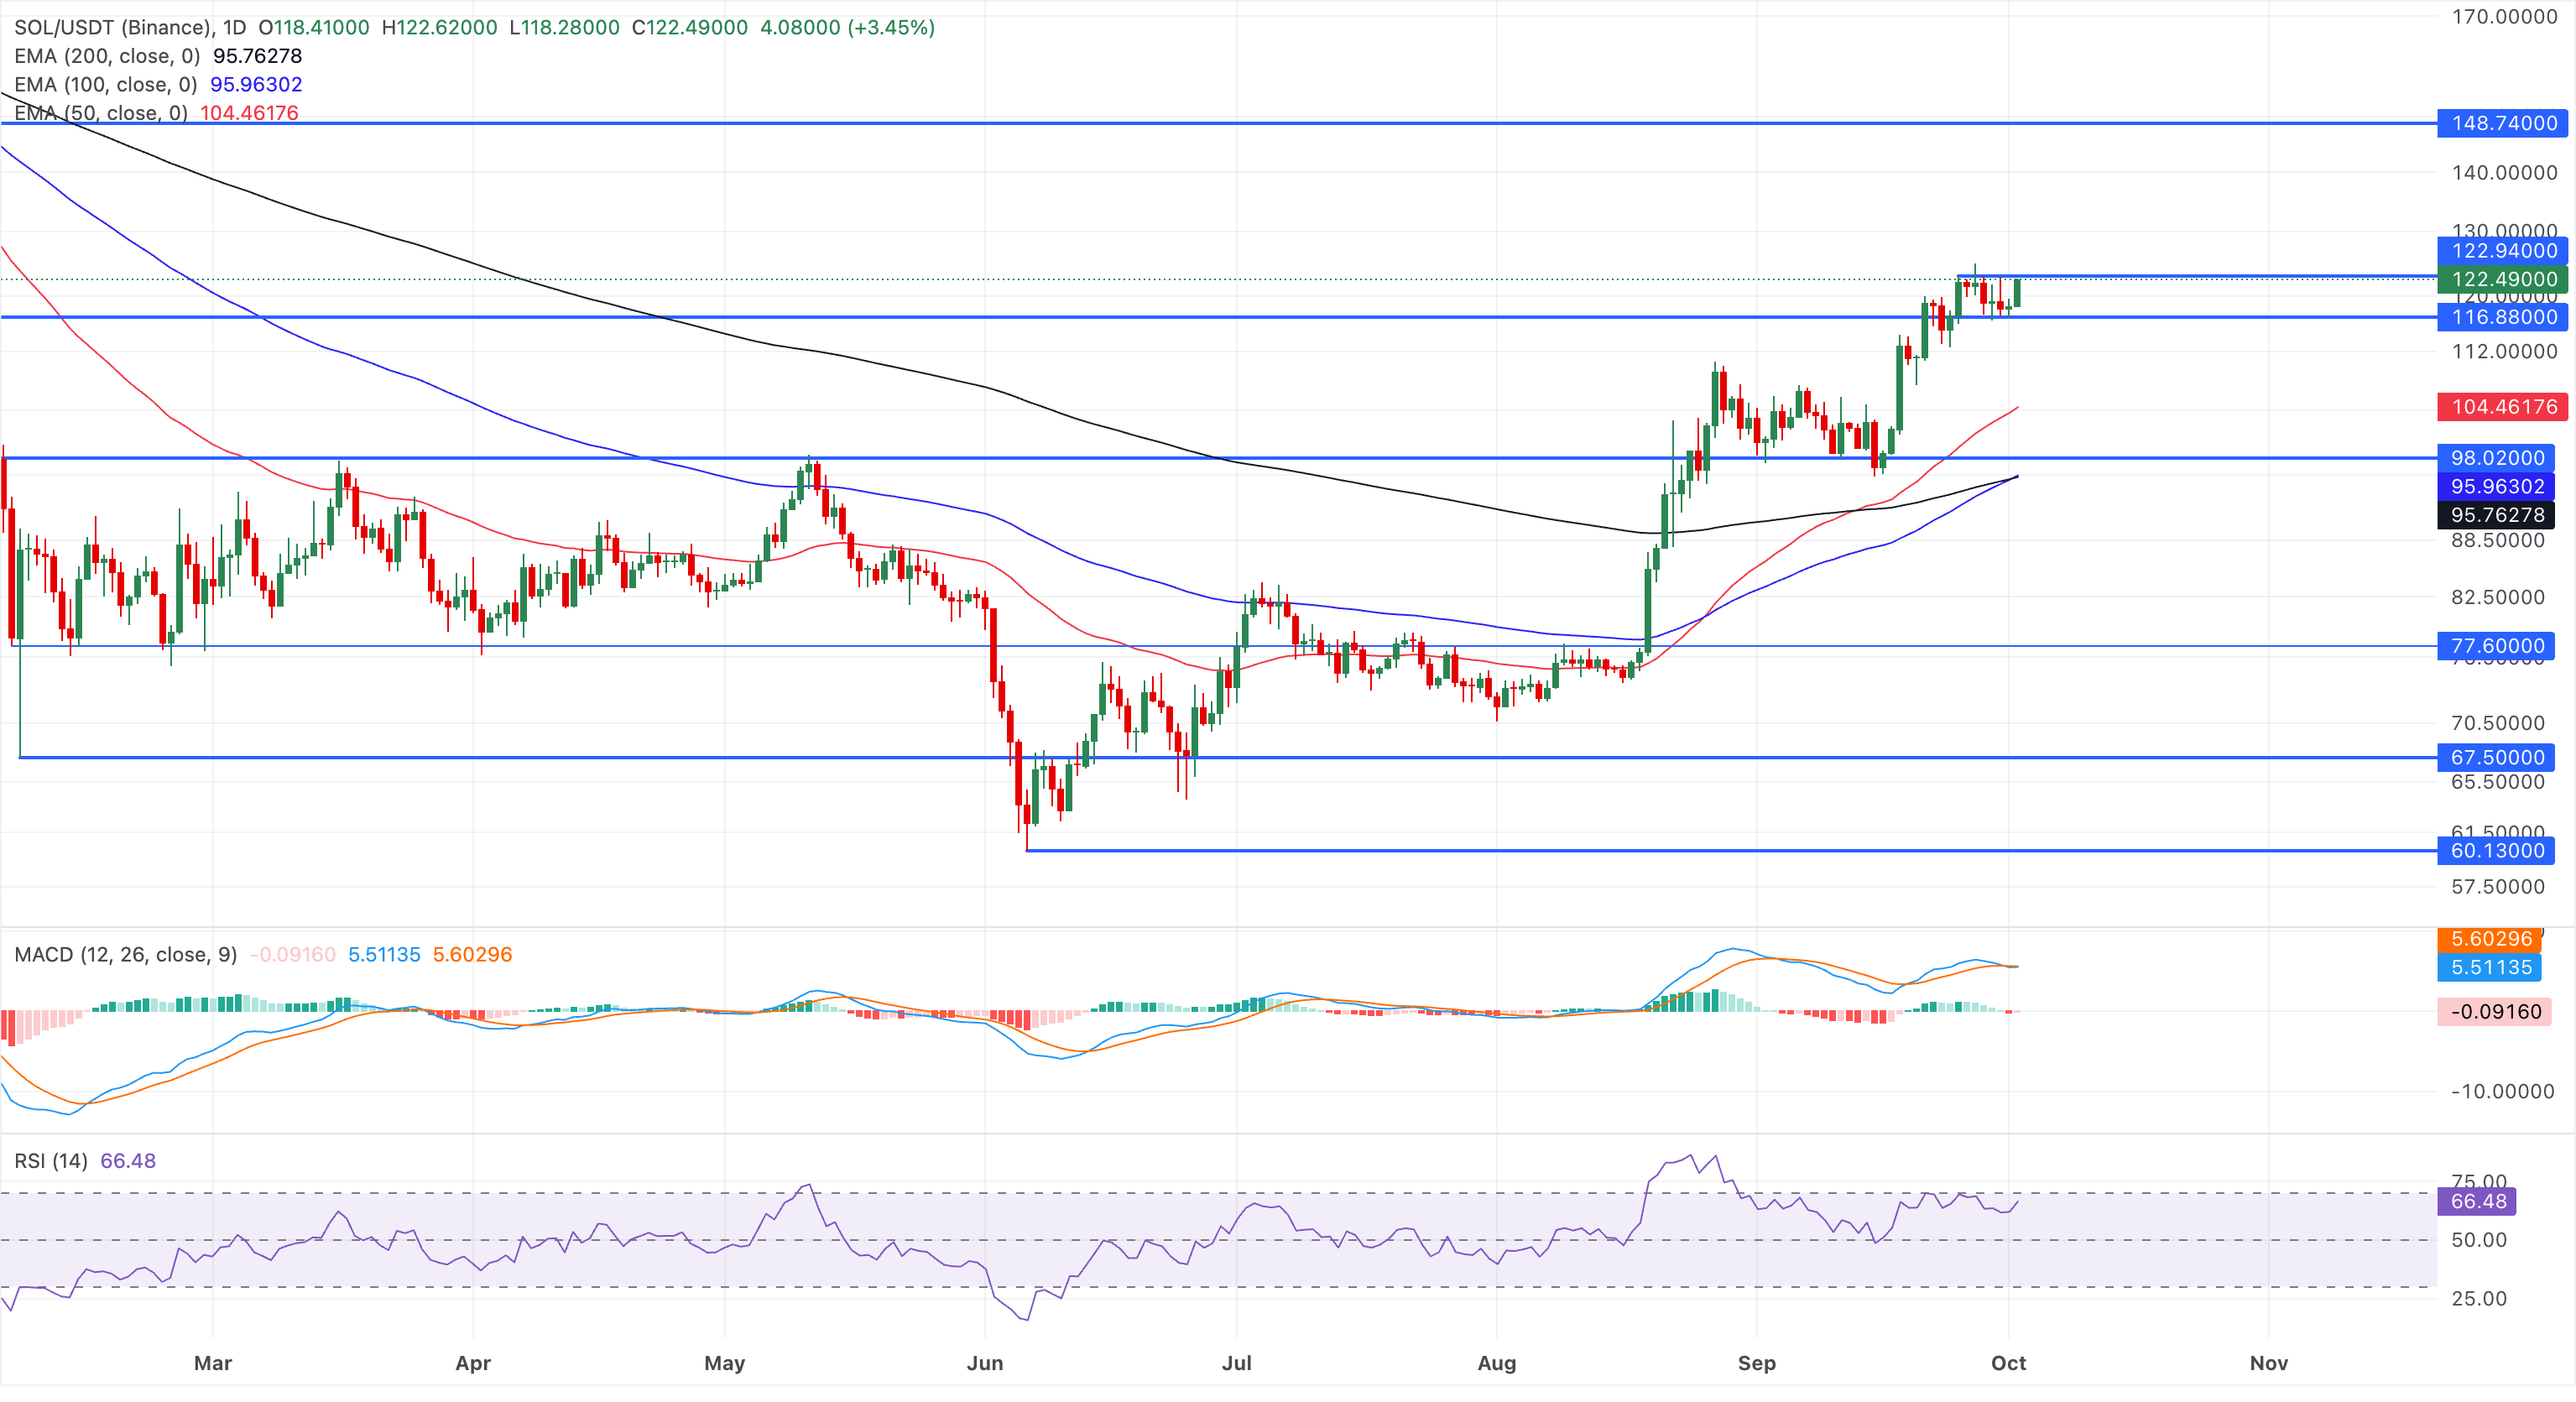
On the flip side, the $116.88 serves as the immediate support level, followed by the 50-day EMA at $104.43.
(The technical analysis of this story was written with the help of an AI tool. Know more.)
Bài viết đề xuất


