


Bitcoin Price Forecast: BTC struggles below $85,000 as ETF outflows, rising US Treasury yields weigh
- Bitcoin remains under pressure, trading below $84,000 on Thursday after failing to close above the $85,000 resistance zone the previous day.
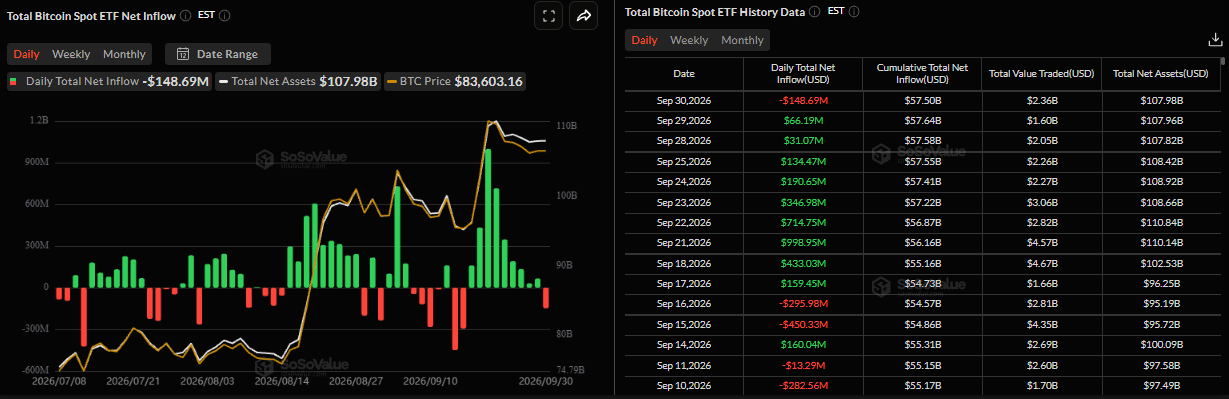
- US-listed spot ETFs recorded an outflow of $148.69 million on Wednesday, snapping the nine-day inflow streak since mid-September.
- Rising US Treasury yields and a stronger USD outweigh softer PCE inflation, keeping risk sentiment cautious.
Bitcoin (BTC) struggles and consolidates below $84,000 at the time of writing on Thursday after failing to close above the $85,000 resistance zone the previous day. Institutional demand shows early signs of weakening, with spot Exchange Traded Funds (ETFs) recording an outflow of $148.69 million on Wednesday, snapping a nine-day inflow streak. In addition, the Crypto King’s upside momentum remains capped amid rising US Treasury yields and a stronger US Dollar (USD) outweighing softer US Personal Consumption Expenditures (PCE) inflation, keeping risk sentiment cautious.
Early signs of weakening institutional demand
Bitcoin’s institutional demand shows early signs of weakness. SoSoValue data show that BTC spot ETFs recorded an outflow of $148.69 million on Wednesday, snapping a nine-day inflow streak. Since September 21, ETF inflows have gradually declined, resulting in an outflow on Wednesday and suggesting institutional buying momentum may be losing strength. If these outflows continue and intensify through the week, BTC could face a deeper correction.
Soaring US yields and stronger USD weigh on BTC
Bitcoin bulls are losing momentum, with BTC failing to recover above the $85,000 resistance level twice so far this week (Monday and Wednesday) and consolidating below this zone.
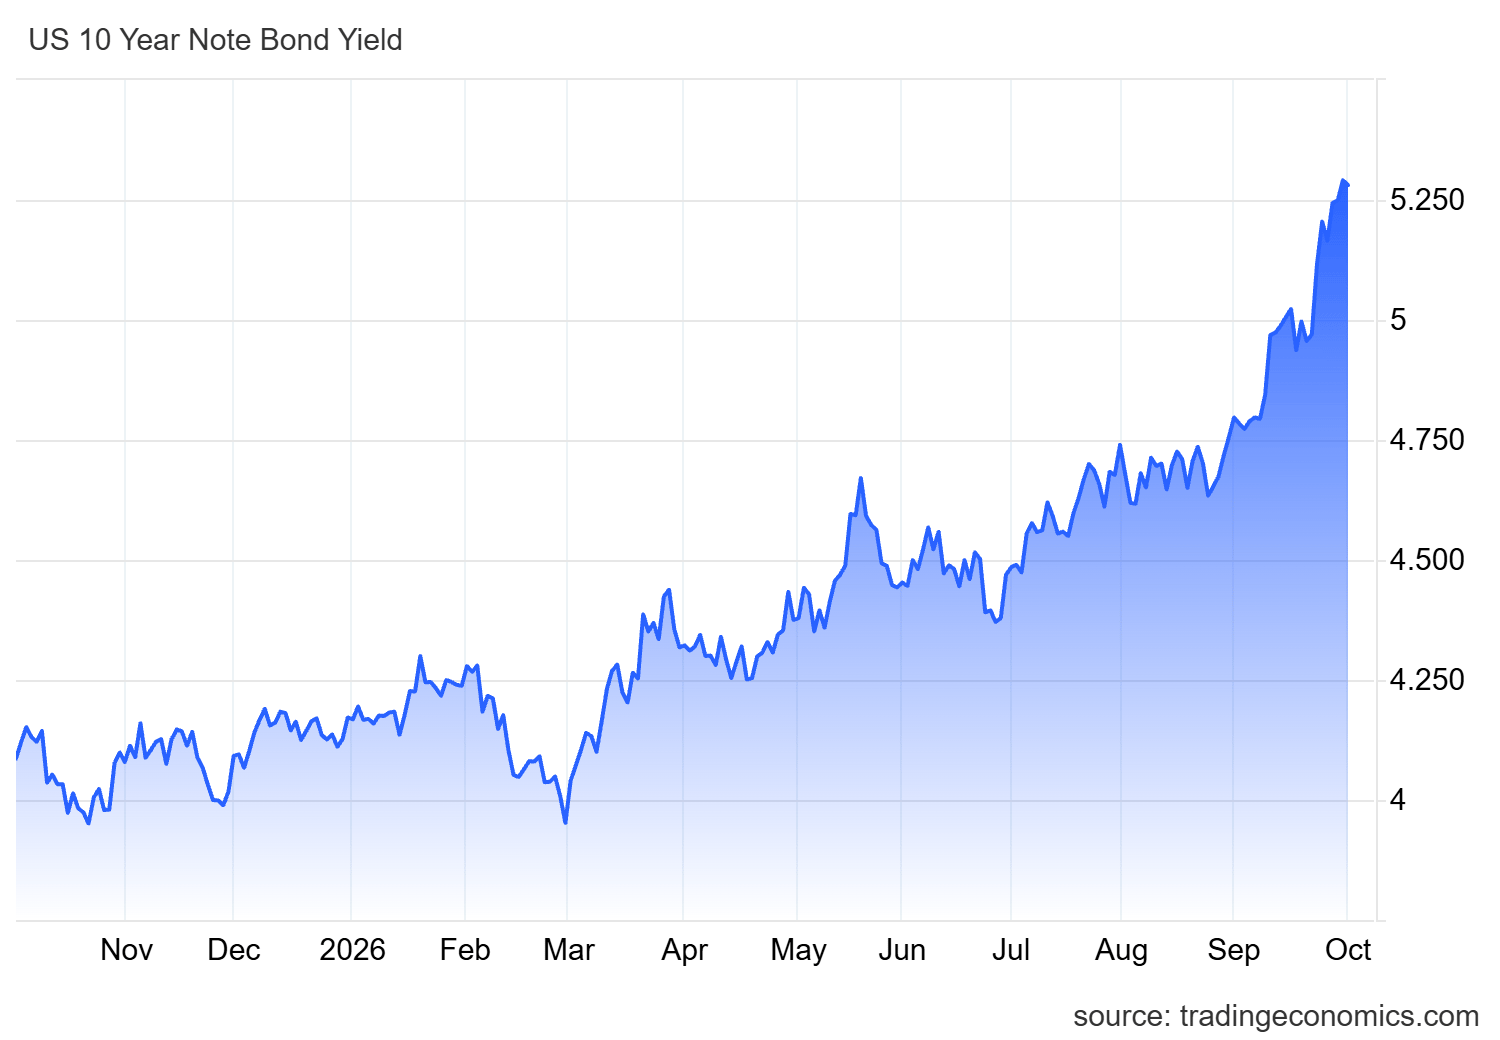
The 5-year US Treasury yield has risen above 5%, while the 10-year yield is above 5.2%, with both at 19-year highs and holding strong. These higher yields make traditional fixed-income assets more attractive than risky assets such as BTC.
In addition, a stronger US Dollar further weighs on BTC, with the US Dollar Index (DXY) surging above $101.80 on Thursday, reaching levels not seen since June.
Meanwhile, the softer-than-expected Personal Consumption Expenditures report for August, released on Wednesday, tempered market bets for a Federal Reserve (Fed) rate hike in October.
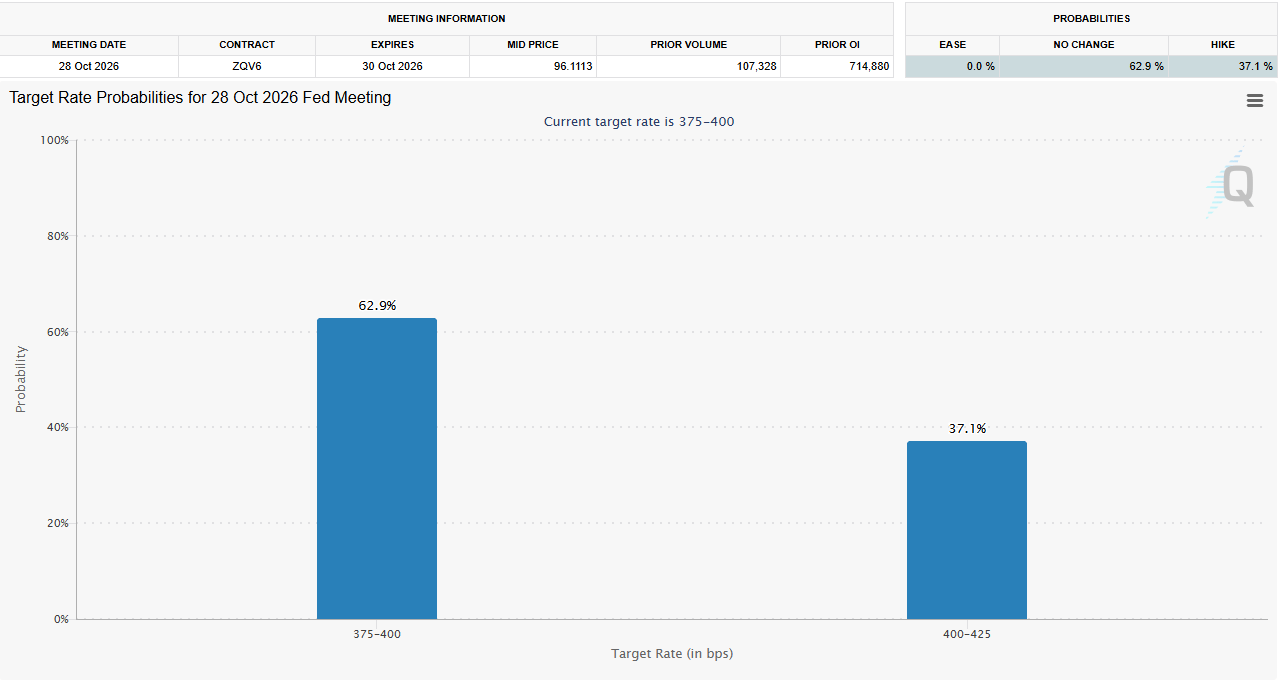
According to CME Group’s FedWatch Tool, on Thursday markets are still pricing in around a 37.1% chance that the US central bank will raise borrowing costs by 25 basis points (bps) at its next meeting, down from 70.86% on Monday.
BTC initially reacted positively, with the Crypto King surging to an intraday high of $85,649. However, the move was short-lived, as BTC closed the day with a modest loss at $83,623.
Traders now turn their attention to the US ISM Manufacturing Purchasing Managers' Index (PMI) due on Thursday and the important Nonfarm Payrolls (NFP) report on Friday. Apart from this, speeches from influential Federal Open Market Committee (FOMC) members will be watched for more cues about the US central bank’s future policy path. These developments could influence the US Dollar and, in turn, provide fresh impetus to risky assets such as BTC.
Bitcoin technical outlook: The $85,000 resistance holds strong
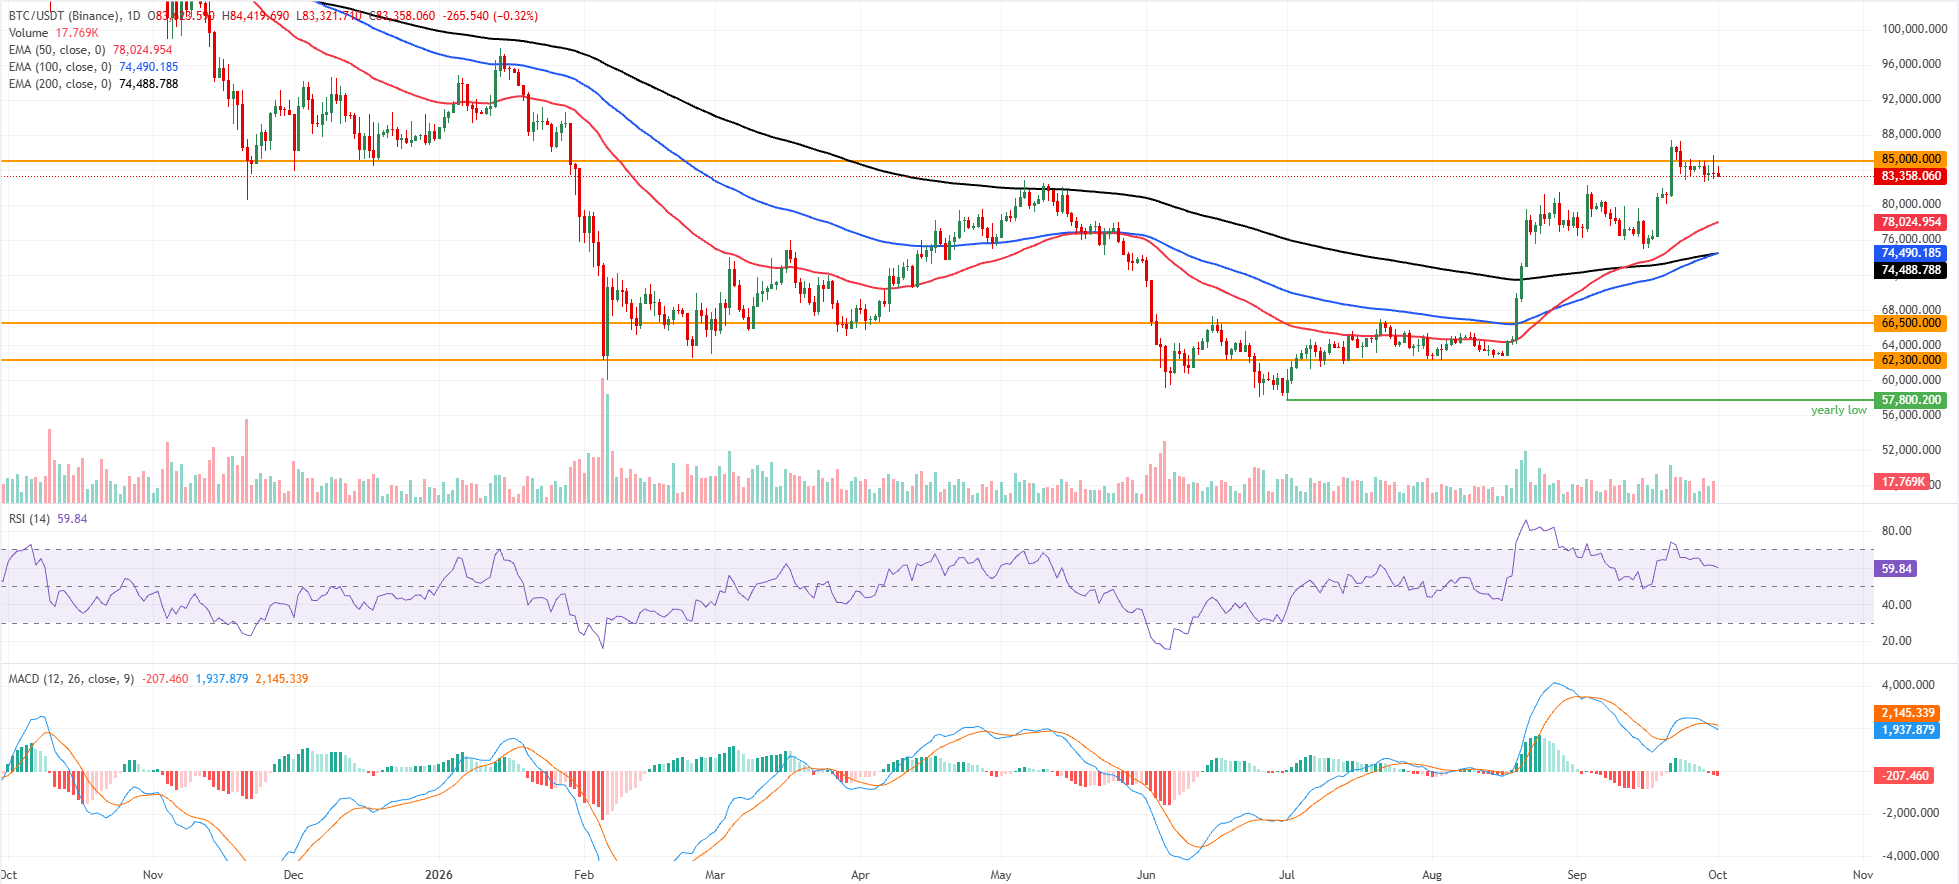
Bitcoin trades at $83,358 at the time of writing on Thursday after being rejected at $85,000 twice so far this week. Despite this rejection, BTC maintains a constructive bias, holding well above key Exponential Moving Averages (EMAs). The 50-day EMA at $78,024 underpins the near-term trend, while the 100-day EMA at $74,490 and the 200-day EMA at $74,488 reinforce broader support.
Momentum is moderately positive on the daily chart, with the Relative Strength Index (RSI) near 59, suggesting steady buying interest. However, the Moving Average Convergence Divergence (MACD) histogram remains in negative territory and hints at a still-fragile upside after the recent pullback from the highs.
On the topside, initial resistance appears at the horizontal barrier around $85,000, where fresh supply could cap further advances if buyers hesitate.
On the downside, immediate support is seen at the 50-day EMA near $78,024, followed by a dense medium-term support band defined by the 100-day and 200-day EMAs clustered around $74,490.
Below these dynamic floors, previously established horizontal levels at $66,500 and $62,300 mark deeper downside cushions, which would come into play only if the current bullish structure suffers a more pronounced correction.
(The technical analysis of this story was written with the help of an AI tool. Know more.)
Bài viết đề xuất


