

Zcash Price Forecast: ZEC stalls around $1,400 as easing upside momentum risks capitulation

Nguồn Fxstreet
  • Zcash hovers around $1,400 on Wednesday after three consecutive days of losses totaling about 15%.
  • Grayscale’s ZEC-focused ETFs recorded over $8 million in outflows on Monday, ahead of its 3-for-1 stock split on Wednesday.
  • The technical outlook for ZEC indicates a near-term corrective bias, targeting the $1,300 support floor.

Zcash (ZEC) price stalls around $1,400 at press time on Wednesday, holding steady after a 15% decline over the last three consecutive days of losses. Early signs of easing institutional demand, with $8 million in outflows on Monday, back the near-term downside risk in the privacy coin. The technical outlook for ZEC indicates a potential dip toward the $1,300 support floor. 

Grayscale’s ZCSH inflows flip negative ahead of stock split

Grayscale’s Zcash Trust Fund Exchange Traded Fund (ETF), ticker ZCSH, announced a 3-for-1 stock split within its first month of trading. This decision is based on the strong bullish undercurrent, with over $250 million in inflows in the first 30 days of trading, totaling $21.83 million in August and $276.17 million so far in September. 

However, the ZCSH fund recorded zero inflow on Tuesday after $8.12 million in outflows on Monday, suggesting an early sign of easing institutional demand ahead of the stock split.
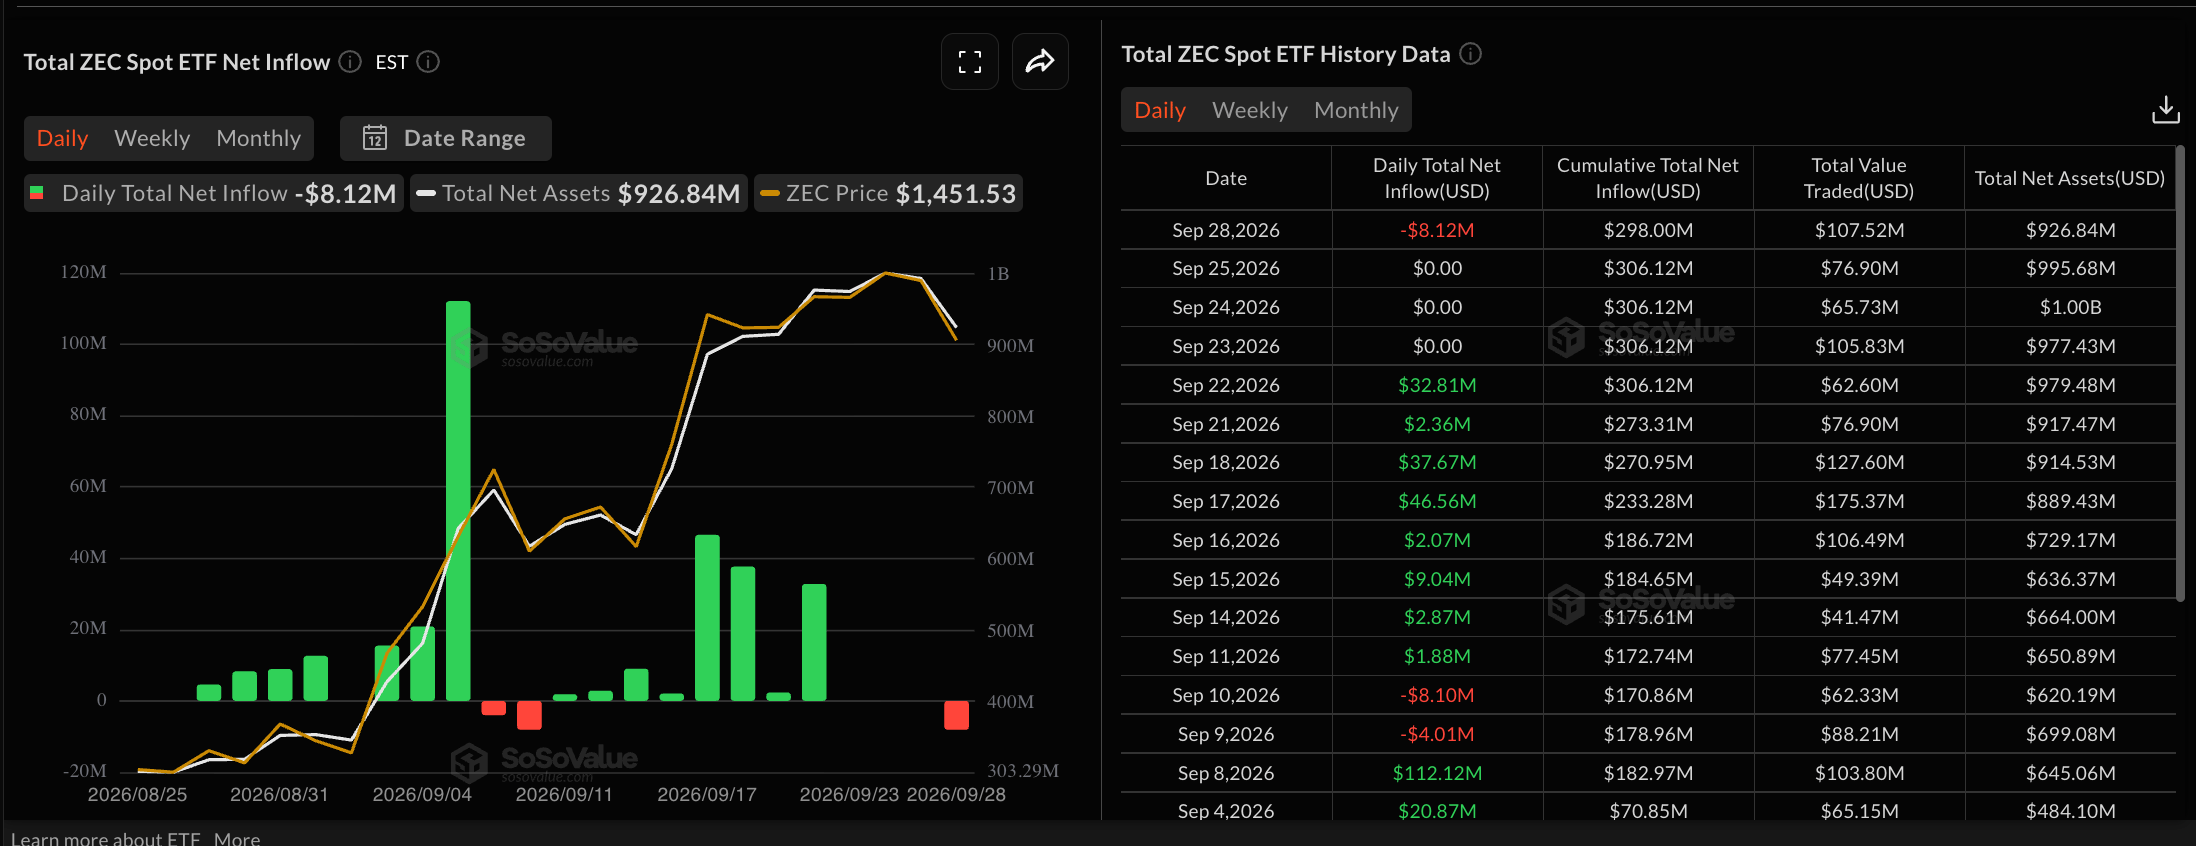
Zcash ETFs data. Source: Sosovalue

Technical outlook: Will Zcash hold above $1,300?

Zcash trades around $1,412 at press time on Wednesday, extending the pullback from Sunday's high of $1,698. The privacy coin maintains a near-term bearish bias after three consecutive days of losses totaling around 15%.

The price hovers below the 50- and 100-period Exponential Moving Averages (EMAs) on the four-hour chart at $1,494 and $1,425, respectively, while only the 200-period EMA at $1,254 underpins the broader structure. The path of least resistance targets a downside to the September 9 high at $1,296, reinforced by the 200-period EMA at $1,254, projecting a potential 10% downside risk.

The Moving Average Convergence Divergence (MACD) remains in negative territory with a bearish profile, and the Relative Strength Index (RSI) around 41 suggests subdued demand, reinforcing the risk of further downside.

Chart Analysis ZEC/USDT (Binance)
ZEC/USDT four-hour price chart.

On the topside, initial resistance aligns with the 100-period EMA at $1,425 ahead of a stronger barrier at the 50-period EMA near $1,494, where sellers could reassert control if the pair attempts a corrective bounce. A confirmed breakout above the overhead average lines could target the September 23 high at $1,679, which capped gains on Sunday.

(The technical analysis of this story was written with the help of an AI tool. Know more.)

Tuyên bố miễn trừ trách nhiệm: Chỉ dành cho mục đích thông tin. Hiệu suất trong quá khứ không đảm bảo cho kết quả trong tương lai.
placeholder
Đồng sáng lập Ethereum dự đoán ETH sẽ vượt BTC về vốn hóa thị trường trong vòng một nămĐồng sáng lập Ethereum, Joseph Lubin, tin rằng ETH có thể vượt qua vốn hóa thị trường của Bitcoin trong vòng một năm tới, nhờ vào sự gia tăng chấp nhận từ các nhà đầu tư doanh nghiệp và hệ sinh thái đ
Tác giả  BeInCrypto
ngày12 tháng 8 năm 2025
Đồng sáng lập Ethereum, Joseph Lubin, tin rằng ETH có thể vượt qua vốn hóa thị trường của Bitcoin trong vòng một năm tới, nhờ vào sự gia tăng chấp nhận từ các nhà đầu tư doanh nghiệp và hệ sinh thái đ
placeholder
Dự báo giá bạc: XAG/USD giữ ổn định gần mức 64,00$ khi giá dầu hạ nhiệtGiá bạc (XAG/USD) nhích lên sau hai ngày giảm, giao dịch quanh mức 63,90$ mỗi ounce troy trong phiên giao dịch châu Á vào thứ Sáu. Bạc không sinh lợi đang tìm thấy hỗ trợ cơ bản khi lo ngại về lạm phát dịu bớt sau đợt thoái lui của giá dầu thô.
Tác giả  FXStreet
9 tháng 25 ngày Thứ Sáu
Giá bạc (XAG/USD) nhích lên sau hai ngày giảm, giao dịch quanh mức 63,90$ mỗi ounce troy trong phiên giao dịch châu Á vào thứ Sáu. Bạc không sinh lợi đang tìm thấy hỗ trợ cơ bản khi lo ngại về lạm phát dịu bớt sau đợt thoái lui của giá dầu thô.
placeholder
Đô la Úc tích luỹ trên mức 0,7000 so với USD khi phe đầu cơ giá xuống chờ quyết định lãi suất của RBACặp AUD/USD kéo dài các biến động giá tích lũy trong phiên châu Á vào thứ Ba, giao dịch ngay trên mốc tâm lý 0,7000, gần mức thấp nhất kể từ ngày 4 tháng 8 trước quyết định của Ngân hàng Dự trữ Úc (RBA)
Tác giả  FXStreet
Hôm qua 02: 36
Cặp AUD/USD kéo dài các biến động giá tích lũy trong phiên châu Á vào thứ Ba, giao dịch ngay trên mốc tâm lý 0,7000, gần mức thấp nhất kể từ ngày 4 tháng 8 trước quyết định của Ngân hàng Dự trữ Úc (RBA)
placeholder
Dự báo giá vàng: Giá vàng lao dốc xuống mức thấp nhất 7 tuần, liệu ngưỡng 4.100 USD có trụ vững?Giá vàng giao ngay (XAUUSD) đã giảm mạnh 4% trong phiên ngày thứ Hai và đóng cửa ở mức 4.114,93 USD/ounce, chạm mức thấp nhất trong ngày là 4.110,80 USD - mức thấp nhất kể từ ngày 5/8. Bư
Tác giả  TradingKey
23 giờ trước
Giá vàng giao ngay (XAUUSD) đã giảm mạnh 4% trong phiên ngày thứ Hai và đóng cửa ở mức 4.114,93 USD/ounce, chạm mức thấp nhất trong ngày là 4.110,80 USD - mức thấp nhất kể từ ngày 5/8. Bư
placeholder
WTI vẫn dưới mức 90,00$ do hoạt động xuất khẩu ở Trung Đông phục hồiGiá dầu West Texas Intermediate (WTI) nhích lên sau khi ghi nhận mức giảm gần 4,5% trong ngày trước đó, giao dịch quanh mức 88,50$/thùng trong giờ châu Á vào thứ Tư. Giá dầu thô hạ nhiệt khi dòng chảy năng lượng từ Trung Đông cho thấy những dấu hiệu cải thiện rõ rệt.
Tác giả  FXStreet
4 giờ trước
Giá dầu West Texas Intermediate (WTI) nhích lên sau khi ghi nhận mức giảm gần 4,5% trong ngày trước đó, giao dịch quanh mức 88,50$/thùng trong giờ châu Á vào thứ Tư. Giá dầu thô hạ nhiệt khi dòng chảy năng lượng từ Trung Đông cho thấy những dấu hiệu cải thiện rõ rệt.
goTop
quote