


Zcash Price Forecast: ZEC risks a decline below $1,500 as bullish momentum eases
- Zcash edges down on Monday, extending the 4% loss from the previous day.
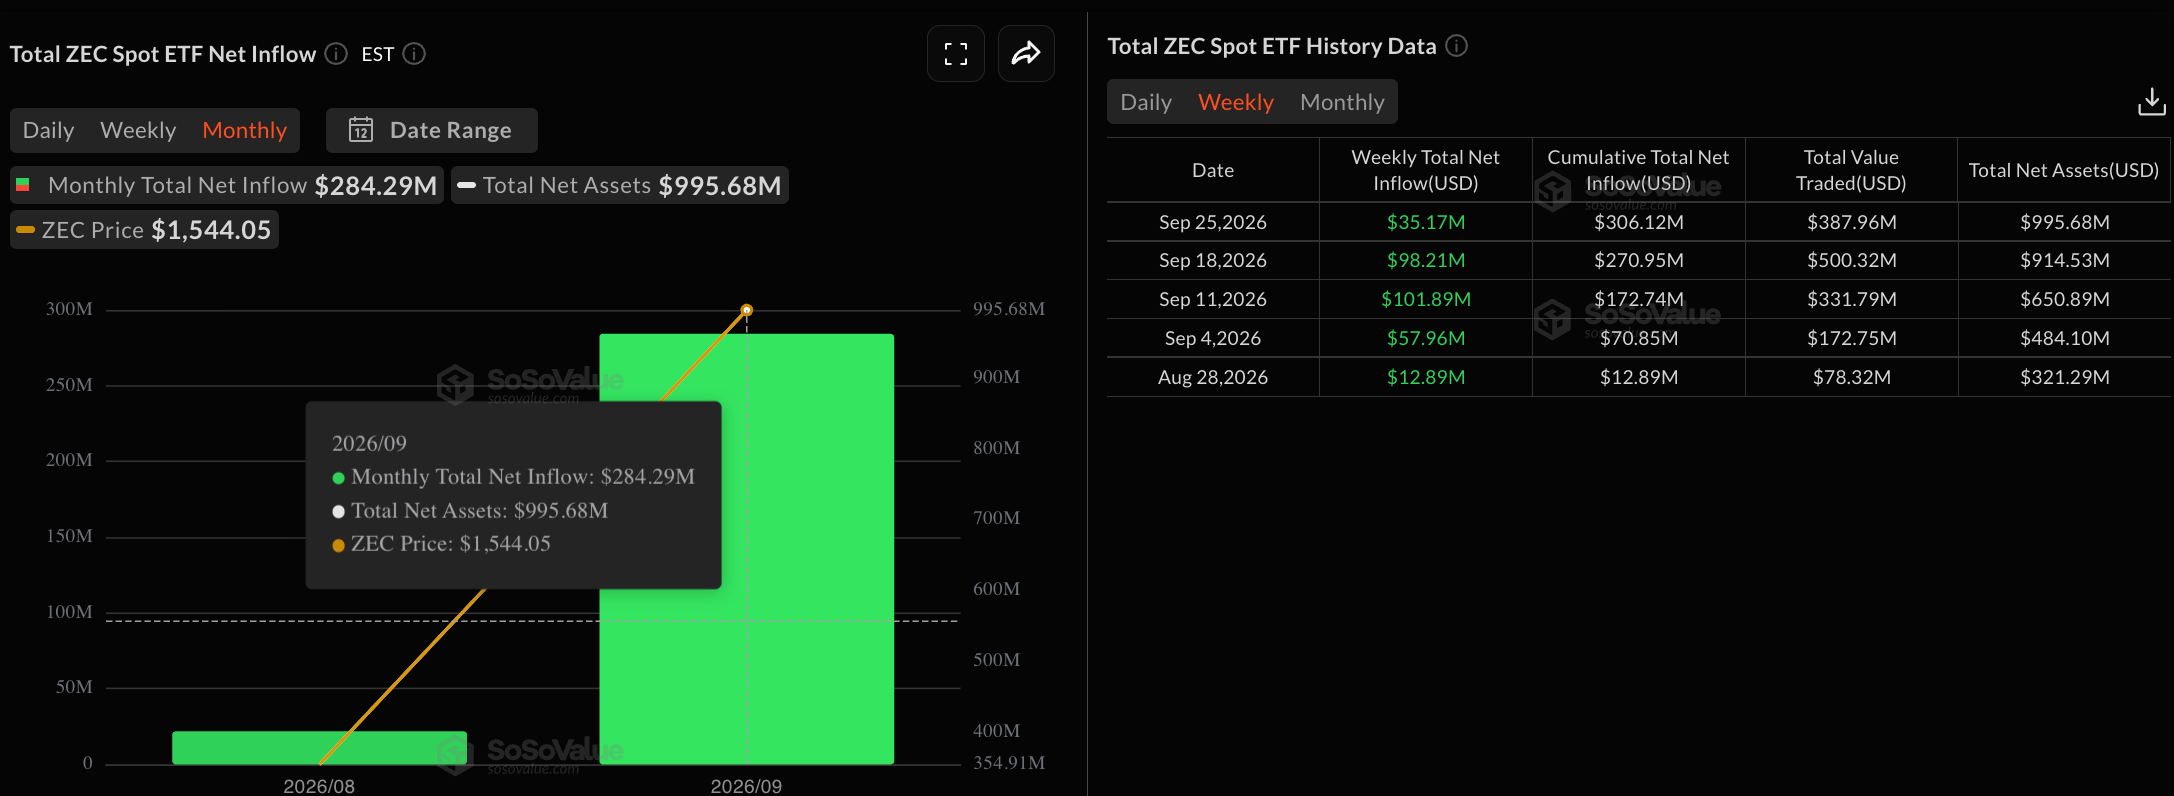
- Institutional demand holds firm with over $35 million in ETF inflows last week.
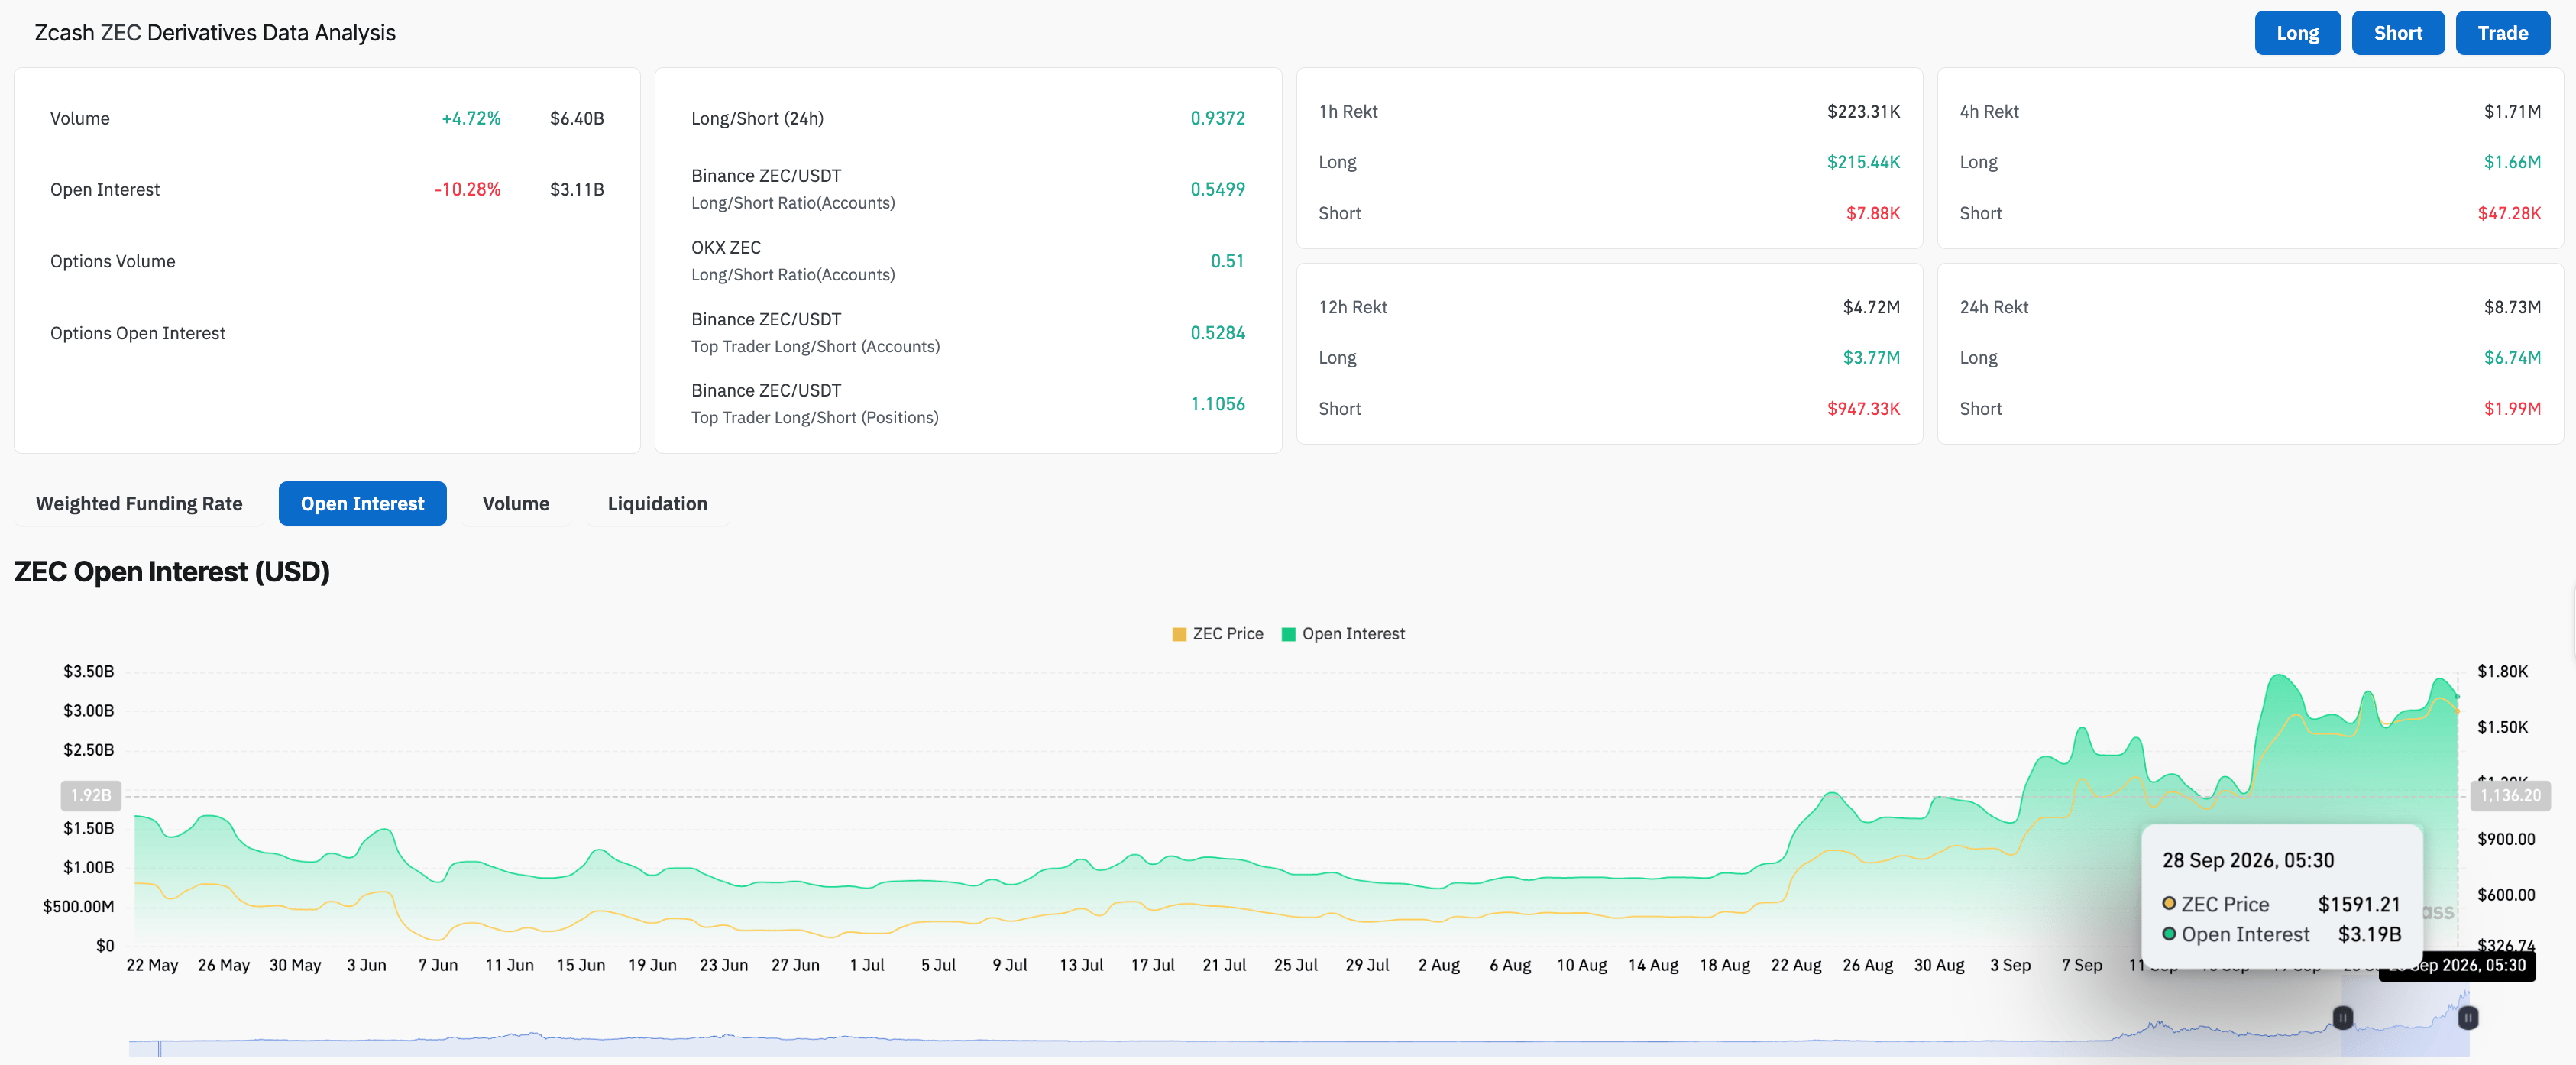
- Zcash loses retail demand as ZEC futures Open Interest shrinks by 10% in 24 hours.
Zcash (ZEC) price hovers below $1,550 on Monday, extending losses after a 4% decline the previous day. Institutional interest in the privacy coin holds firm, recording over $35 million in inflows last week, while retail speculation takes a hit, with ZEC futures Open Interest down around 10% in 24 hours. The technical outlook for Zcash indicates a near-term correction, with a support cluster around $1,420.
ETF inflows show long-term confidence as retail remains short-sighted
Grayscale’s Zcash-focused Exchange-Traded Fund (ETF), ticker ZCSH, recorded $35.17 million in inflows last week, bringing the monthly total to $284.29 million so far. This marks the fifth consecutive weekly inflow, projecting firm confidence in the privacy coin’s long-term growth story. In addition, Grayscale’s ZCSH fund will execute a 3-for-1 forward share split on Monday, as the demand remains high.
On the other hand, retail demand weakens for Zcash in the short term. CoinGlass data shows the ZEC futures Open Interest (OI) is down 10% over the last 24 hours to $3.11 billion, suggesting a mild correction in positional buildup. The liquidation data shows $6.74 million in long liquidations outpaced $1.99 million in short liquidations, suggesting a wipeout of bullish positions and sell-side dominance.
Still, the ZEC OI holds above the $3 billion mark, following its steady increase from $770.27 million on August 1.
Technical outlook: Zcash faces a temporary downside risk below $1,500
Zcash hovers around $1,540 at press time on Monday, with a nearly 3% intraday drop, following a 4% decline on Sunday from the $1,680 high. The privacy coin shows near-term weakness as price tests the 50-period Exponential Moving Average (EMA) at $1,529 on the four-hour chart, while the 100-period EMA near $1,421 and the 200-period EMA around $1,229 underpin the long-term uptrend.
Momentum has cooled, as the Relative Strength Index (RSI) is at 45 on the four-hour chart, slipping below the midline, while the Moving Average Convergence Divergence (MACD) crosses below its signal line, hinting at easing bullish pressure rather than an outright trend reversal.
A confirmed breakout below the 50-period EMA at $1,529 could target the 100-period EMA near $1,421 and the September 9 high at $1,296.
Looking up, a potential rebound from the 50- or 100-period EMAs around $1,529 and $1,421 must surpass the $1,680 swing high for a sustained upward trend, potentially targeting the $1,700 round figure.
(The technical analysis of this story was written with the help of an AI tool. Know more.)
Bài viết đề xuất


