


Bitcoin Price Forecast: BTC outperforms US equities and Gold since mid-August
- Bitcoin extends its gains, trading above $86,000 on Wednesday after surging over 6% so far this week.
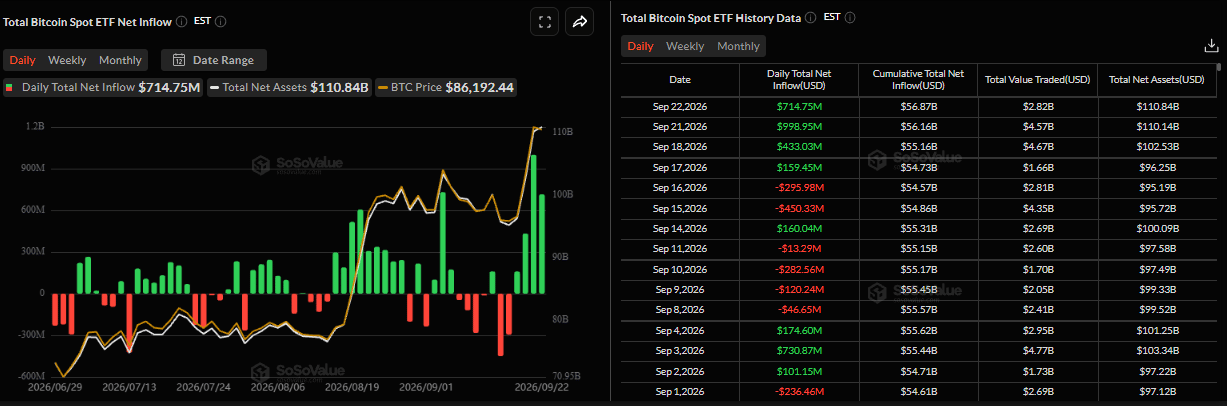
- US-listed spot ETFs recorded an inflow of $714 million on Tuesday, following a nearly $1 billion inflow the previous day.
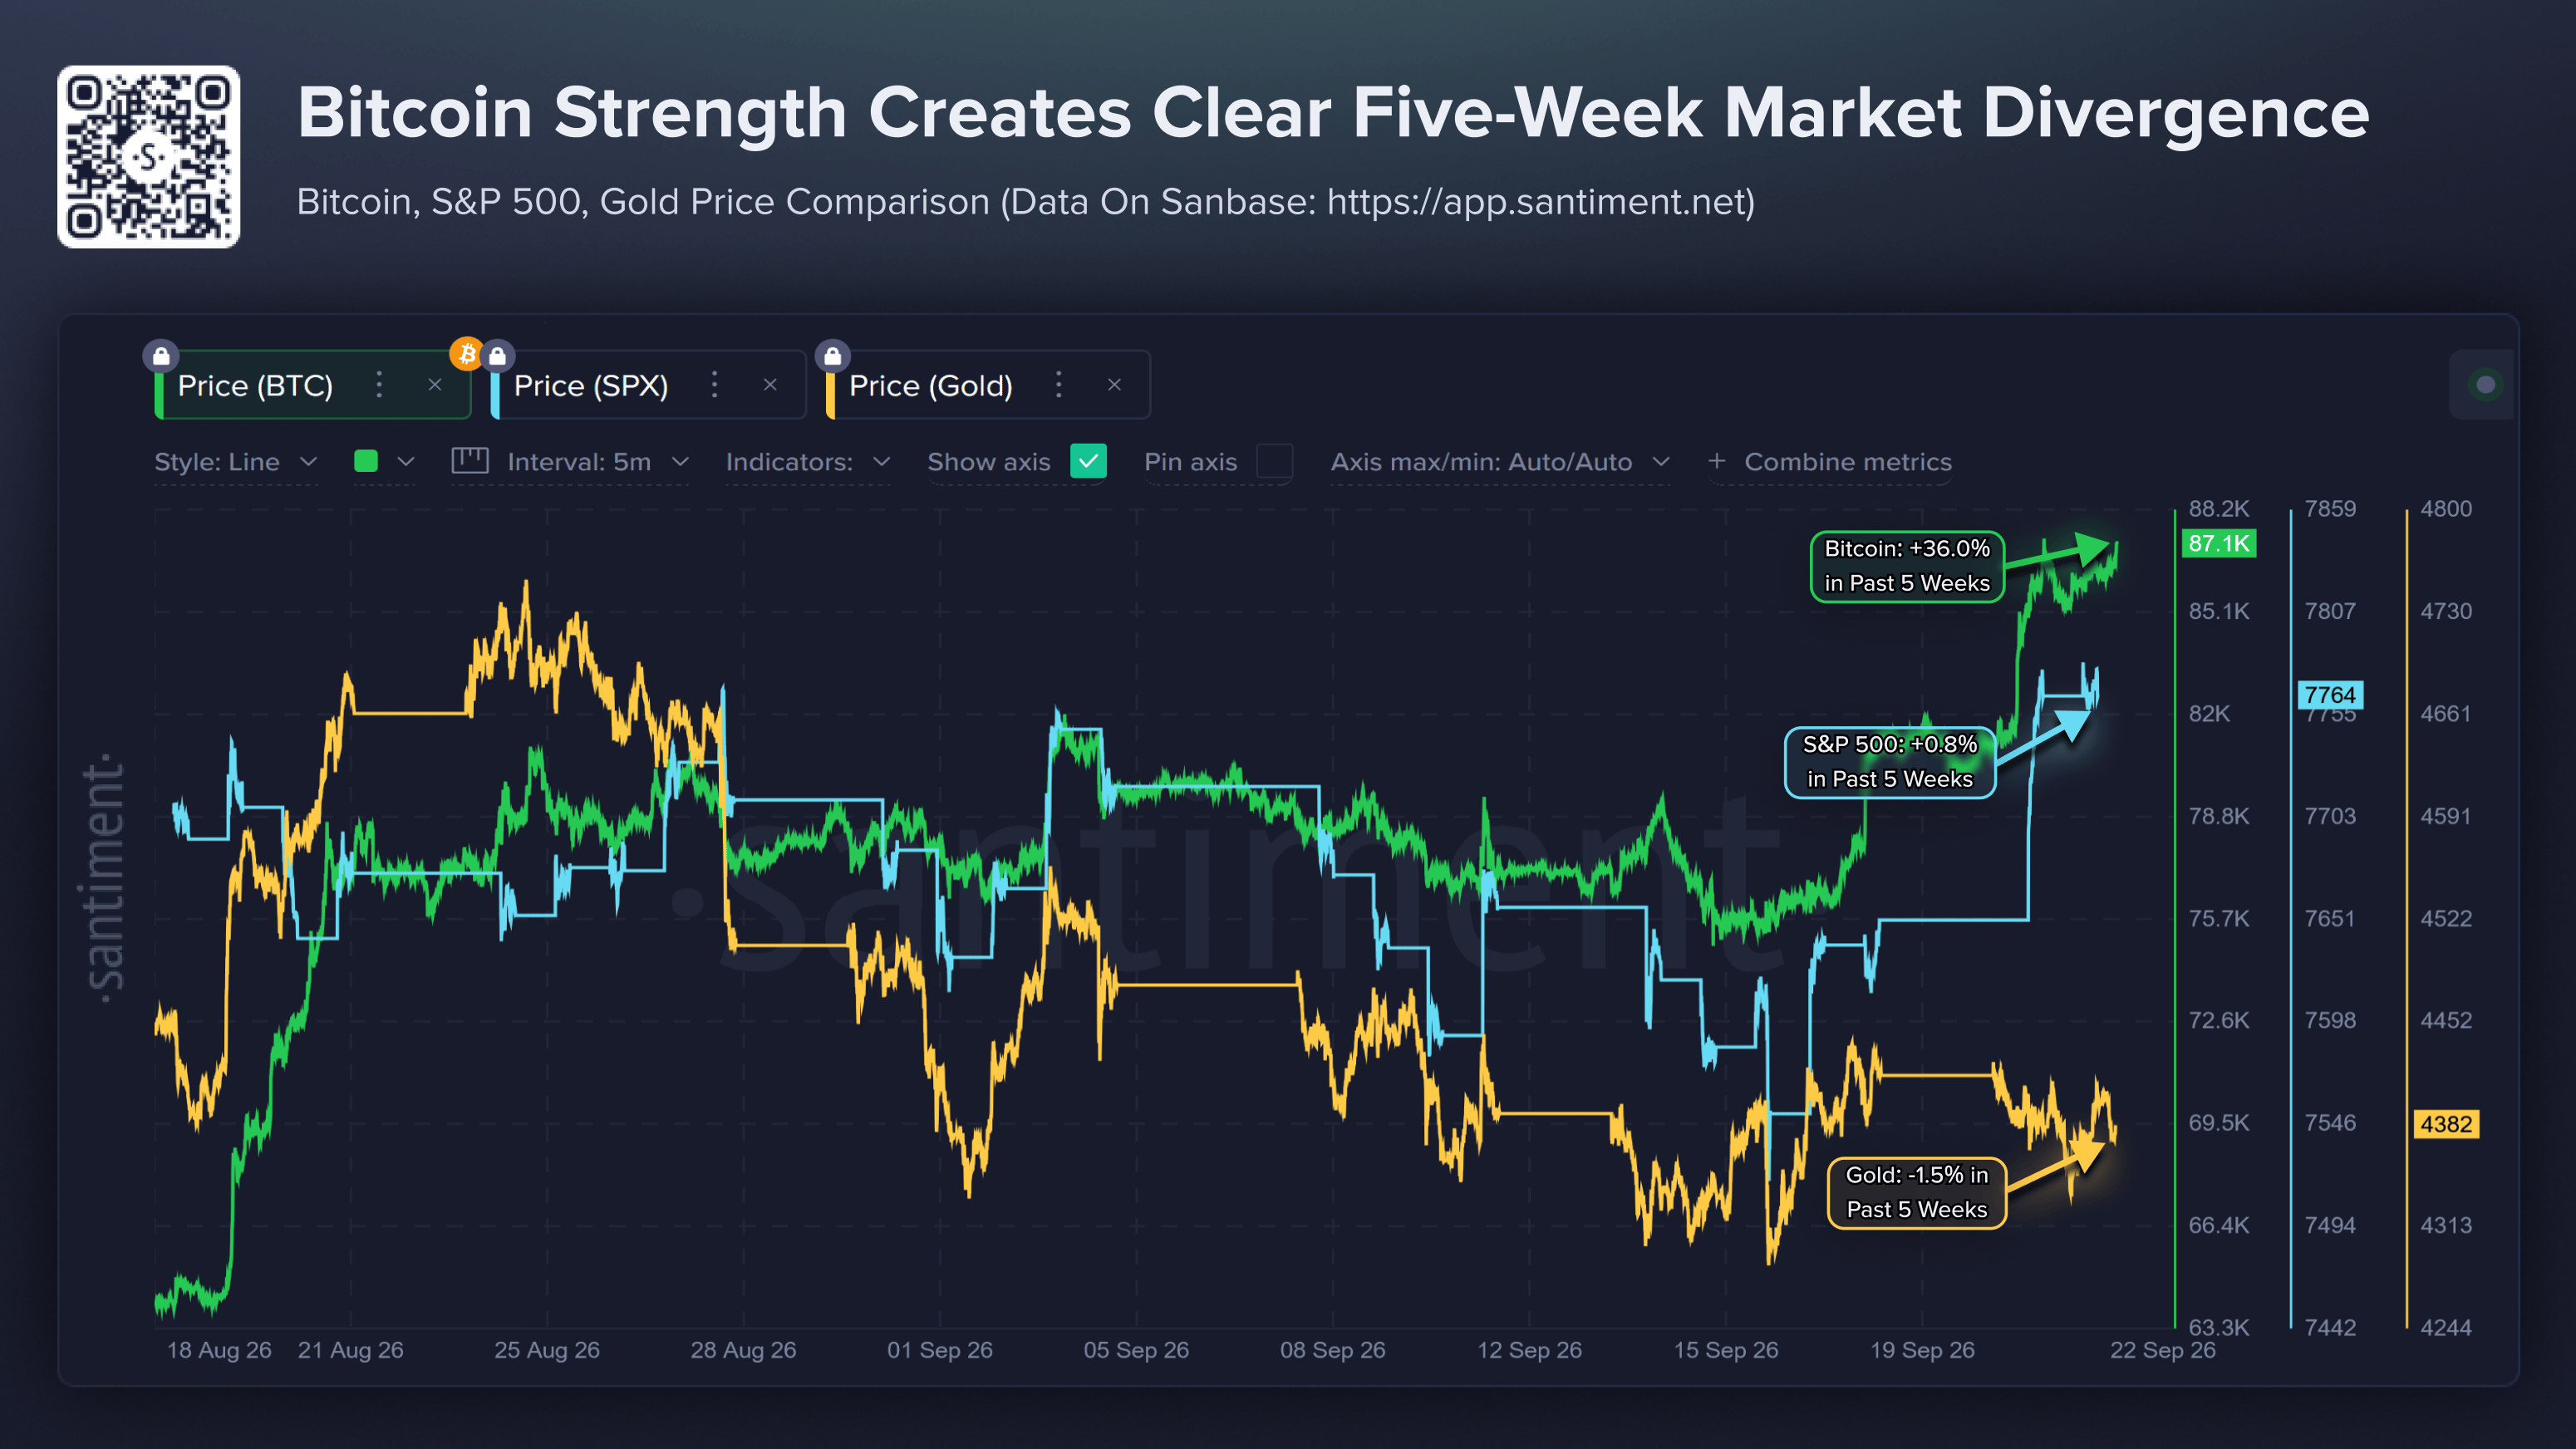
- Bitcoin’s market capitalization has risen 36% since August 18, significantly outperforming the S&P 500 and Gold over the same period.
Bitcoin (BTC) extends its rally, trading above $86,000 at the time of writing on Wednesday after gaining more than 6% so far this week. Strong institutional demand is supporting BTC’s bullish price action, with spot Exchange Traded Funds (ETFs) recording over $714 million in inflows on Tuesday after nearly $1 billion in positive flows the previous day.
Moreover, reports highlight that BTC has outperformed the S&P 500 and Gold (XAU) since mid-August, indicating growing investor interest in Crypto King over traditional assets.
Institutional demand pushes BTC to higher levels
SoSoValue data showed that the spot Bitcoin ETFs recorded an inflow of $714.75 million on Tuesday after a $998.95 million inflow the previous day. Tuesday’s positive flows mark the fourth consecutive day of inflows since last week, highlighting robust investor demand. If these inflows continue and intensify through the week, BTC could extend the ongoing rally.
As explained in the previous report, “Why Bitcoin’s over 30% rebound doesn’t mean the bear market cycle is done,” BTC has now closed above the key technical hurdle, its 365-day moving average, currently around $80,500. The sustained move above this level strengthens the bullish technical outlook, while renewed spot demand and stronger institutional flows further confirm that the Crypto King’s rally is gaining momentum.
-1790149315737.png)
Bitcoin outperforms Equities and Gold
Santiment reported on Wednesday that “Crypto no longer living in Equities’ shadow,” highlighting a growing divergence between Bitcoin and traditional assets.
According to the report, BTC’s market capitalization has increased by 36% since August 18, significantly outperforming the S&P 500 0.8% gain and Gold’s 1.5% decline over the same period.
“The breakout began as smaller 0.1–10 BTC holders capitulated in mid-August,” the analyst noted.
Several factors have since supported Bitcoin’s relative strength. Liquidity conditions improved as the Treasury doubled the size of its long-duration bond buybacks beginning in September, while renewed spot ETF demand and repeated short squeezes added further buying pressure as BTC broke through key resistance levels.
The five-week divergence suggests Bitcoin has increasingly responded to crypto-specific catalysts rather than simply following equity performance. Meanwhile, Stocks remain near record levels but face elevated yields and uneven market participation, while Gold has weakened as markets price in tighter monetary policy for longer.
“From here, Bitcoin can keep outperforming if ETF demand, liquidity, and institutional participation persist, though rising leverage and crowd euphoria raise short-term shakeout risk. Stocks need earnings strength to overcome high yields, while Gold likely needs falling real rates or renewed defensive demand to regain leadership,” concluded the analyst.
Bitcoin technical outlook: BTC bulls in control
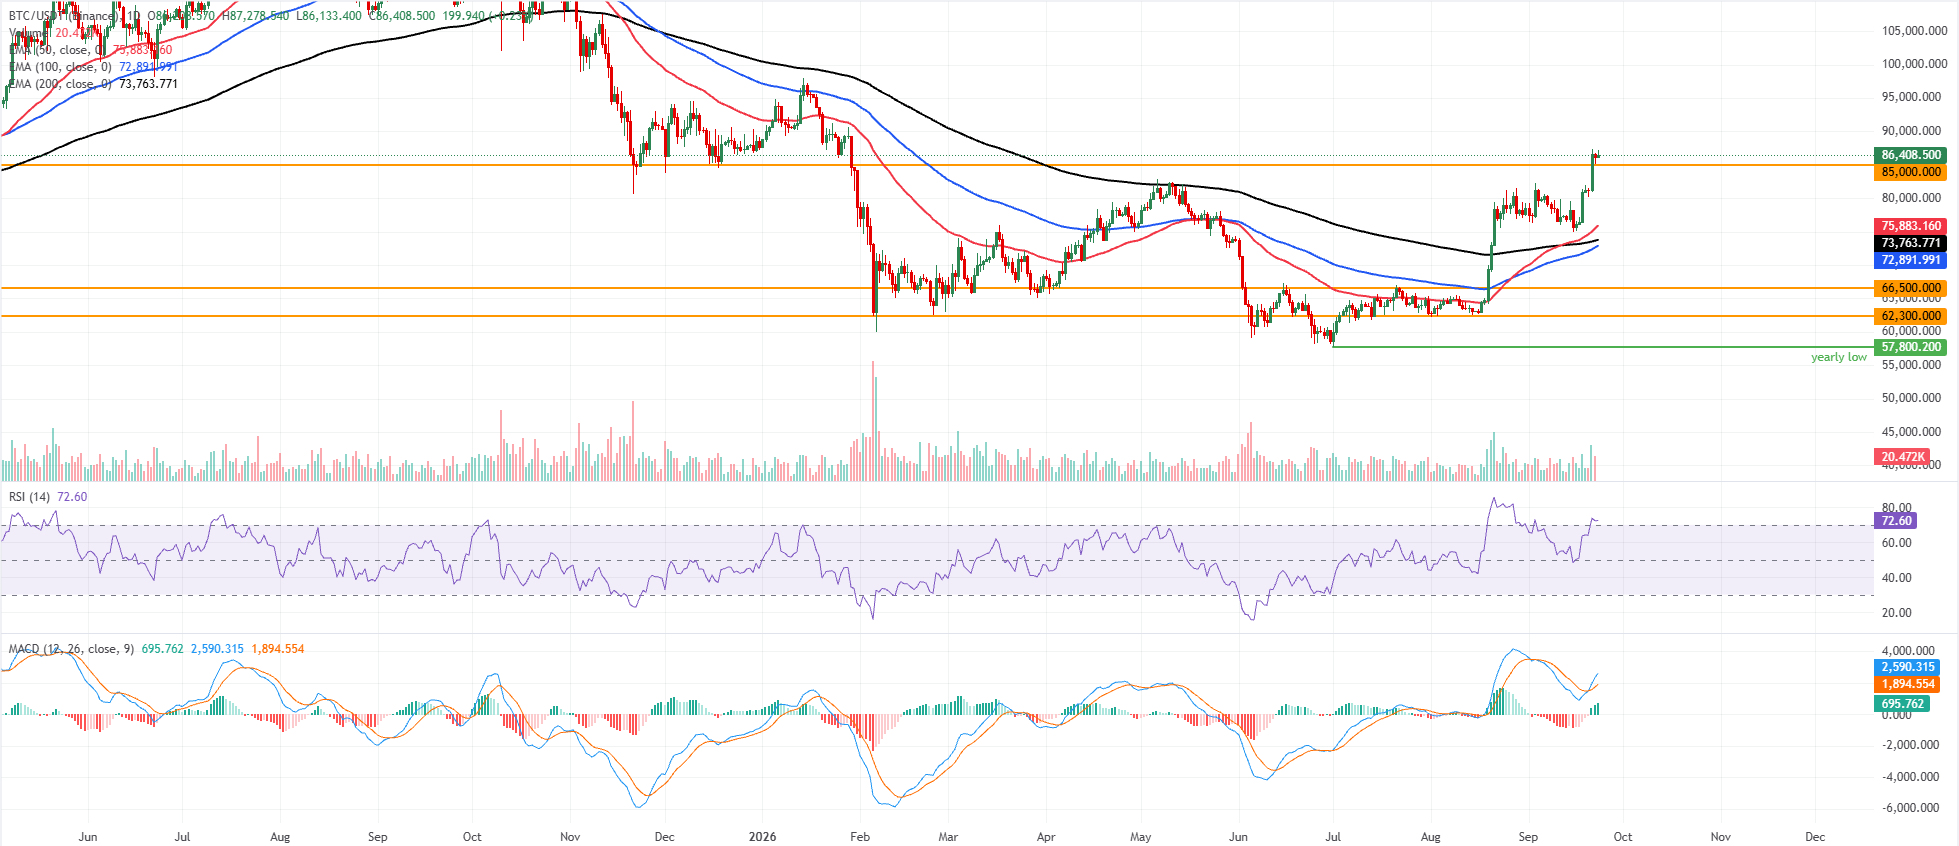
Bitcoin price trades at $86,408 on Wednesday after surging over 6% so far this week. The Crypto King is extending its advance firmly above the key Exponential Moving Averages (EMAs). The 50-day EMA at $75,883, the 100-day EMA at $72,891, and the 200-day EMA at $73,763 all sit well below spot, suggesting a strong bullish backdrop, with the recent breakout finding immediate support at the former horizontal barrier near $85,000.
The Relative Strength Index (14) around 72 flags overbought conditions, while the Moving Average Convergence Divergence (MACD) remains positive, hinting that upside momentum is robust but increasingly stretched.
On the downside, initial support is at $85,000, followed by the clustered dynamic floor of the 50-day EMA at $75,883 and broader trend support from the 200-day EMA at $73,763 and the 100-day EMA at $72,891.
Deeper pullbacks would likely attract buyers toward the prior structural levels at $66,500 and $62,300. At the same time, the absence of nearby overhead resistance on this chart suggests that any fresh highs above the current price would leave BTC to sustain further gains toward the $100,000 mark.
(The technical analysis of this story was written with the help of an AI tool. Know more.)
Bitcoin, altcoins, stablecoins FAQs
Bitcoin is the largest cryptocurrency by market capitalization, a virtual currency designed to serve as money. This form of payment cannot be controlled by any one person, group, or entity, which eliminates the need for third-party participation during financial transactions.
Altcoins are any cryptocurrency apart from Bitcoin, but some also regard Ethereum as a non-altcoin because it is from these two cryptocurrencies that forking happens. If this is true, then Litecoin is the first altcoin, forked from the Bitcoin protocol and, therefore, an “improved” version of it.
Stablecoins are cryptocurrencies designed to have a stable price, with their value backed by a reserve of the asset it represents. To achieve this, the value of any one stablecoin is pegged to a commodity or financial instrument, such as the US Dollar (USD), with its supply regulated by an algorithm or demand. The main goal of stablecoins is to provide an on/off-ramp for investors willing to trade and invest in cryptocurrencies. Stablecoins also allow investors to store value since cryptocurrencies, in general, are subject to volatility.
Bitcoin dominance is the ratio of Bitcoin's market capitalization to the total market capitalization of all cryptocurrencies combined. It provides a clear picture of Bitcoin’s interest among investors. A high BTC dominance typically happens before and during a bull run, in which investors resort to investing in relatively stable and high market capitalization cryptocurrency like Bitcoin. A drop in BTC dominance usually means that investors are moving their capital and/or profits to altcoins in a quest for higher returns, which usually triggers an explosion of altcoin rallies.
Bài viết đề xuất


