


Bitcoin Price Forecast: BTC hits $85,000 as rally gains momentum, but liquidity risks linger
- Bitcoin claims the $85,000 level on Monday after gaining 5.64% and closing above the 50-week SMA at $78,200 the previous week.
- US-listed spot Bitcoin ETFs recorded mild $6.21 million inflows last week, showing resilience despite the CLARITY Act setback and hawkish Fed outlook.
- The rally appears driven by short covering, trader repositioning and renewed leverage, an analyst says, leaving BTC vulnerable to a pullback if the breakout fails.
Bitcoin (BTC) extends gains, claiming the $85,000 mark on Monday after surging nearly 6% and closing above a key resistance zone in the previous week. Meanwhile, institutional demand recorded a mild inflow through spot Exchange Traded Funds (ETFs) last week, showing resilience despite the CLARITY Act setback and hawkish Fed outlook.
However, traders should be cautious, as analysts say the rally appears driven by short covering, trader repositioning and renewed leverage, leaving BTC vulnerable to a pullback if the breakout fails.
Institutional demand remains resilient
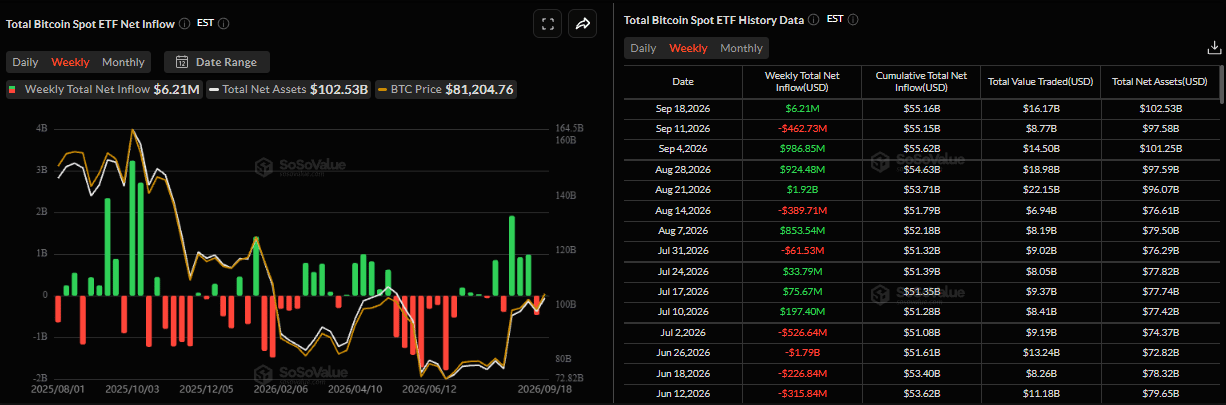
SoSoValue data showed spot Bitcoin ETFs recorded a mild inflow of $6.21 million last week, following an outflow of $462.73 million in the previous one. This mild inflow came despite the CLARITY Act setback and a hawkish Fed outlook last week, suggesting relative resilience despite a challenging regulatory and macroeconomic backdrop.
If these inflows continue and intensify through the week, BTC could extend the ongoing rally.
Some signs of concern
In an exclusive interview, Bitunix Analyst Dean Chen told FXStreet that Bitcoin’s market structure has improved, but the latest rally still lacks enough confirmation to declare a new bull cycle.
Chen highlighted key resistance around $82,282, followed by the previous swing high near $82,800. This is now a critical area for confirmation. If Bitcoin breaks above that zone and holds it as support, it would strengthen the case for a structural recovery.
However, Chen noted that trading volume has not expanded significantly alongside the price advance, raising concerns about the breakout’s strength. He also pointed to volatile ETF flows, with institutional spot demand yet to establish a sustained net-inflow trend.
Moreover, Bitcoin’s Open Interest (OI) increased 3.62% over 24 hours, while short liquidations reached around $49 million, suggesting that short covering and renewed leverage are contributing to the rally. Chen cautioned that rising leverage could amplify downside pressure if BTC fails to sustain the breakout.
“What makes this rally particularly interesting is that it is happening without full support from the macro backdrop,” Chen added.
The US Dollar Index (DXY) rose roughly 1.12% last week and moved back above 100, while the US 2-year Treasury yield climbed to around 4.72%. The 10-year yield remained near 4.96%, while the 30-year yield stayed around 5.30%. In addition, the Federal Reserve (Fed) raised its policy rate by 25 basis points to 3.75%-4.00%, while its latest projections still leave room for another hike this year.
“So I would not simply describe the latest Bitcoin rally as a result of a more favorable macro environment,” Chen said. “In fact, Bitcoin is moving higher while the Dollar and Treasury yields remain relatively restrictive.”
The analyst added that this makes the Crypto King’s recent price action more notable, as the restrictive macro backdrop has so far failed to trigger another wave of selling. The broader crypto liquidity backdrop also remains subdued, with the combined market capitalization of major stablecoins still below its May peak. Chen therefore sees the rally as a combination of existing capital being repositioned, short covering and renewed leverage rather than a broad-based expansion in crypto liquidity.
As a result, Chen remains more constructive on Bitcoin but is watching whether BTC can break and hold the $82,700-$82,800 area, alongside sustained ETF inflows and healthier growth in Open Interest (OI), before considering the move a confirmed trend reversal.
Bitcoin technical outlook: Closes above key 50-week SMA
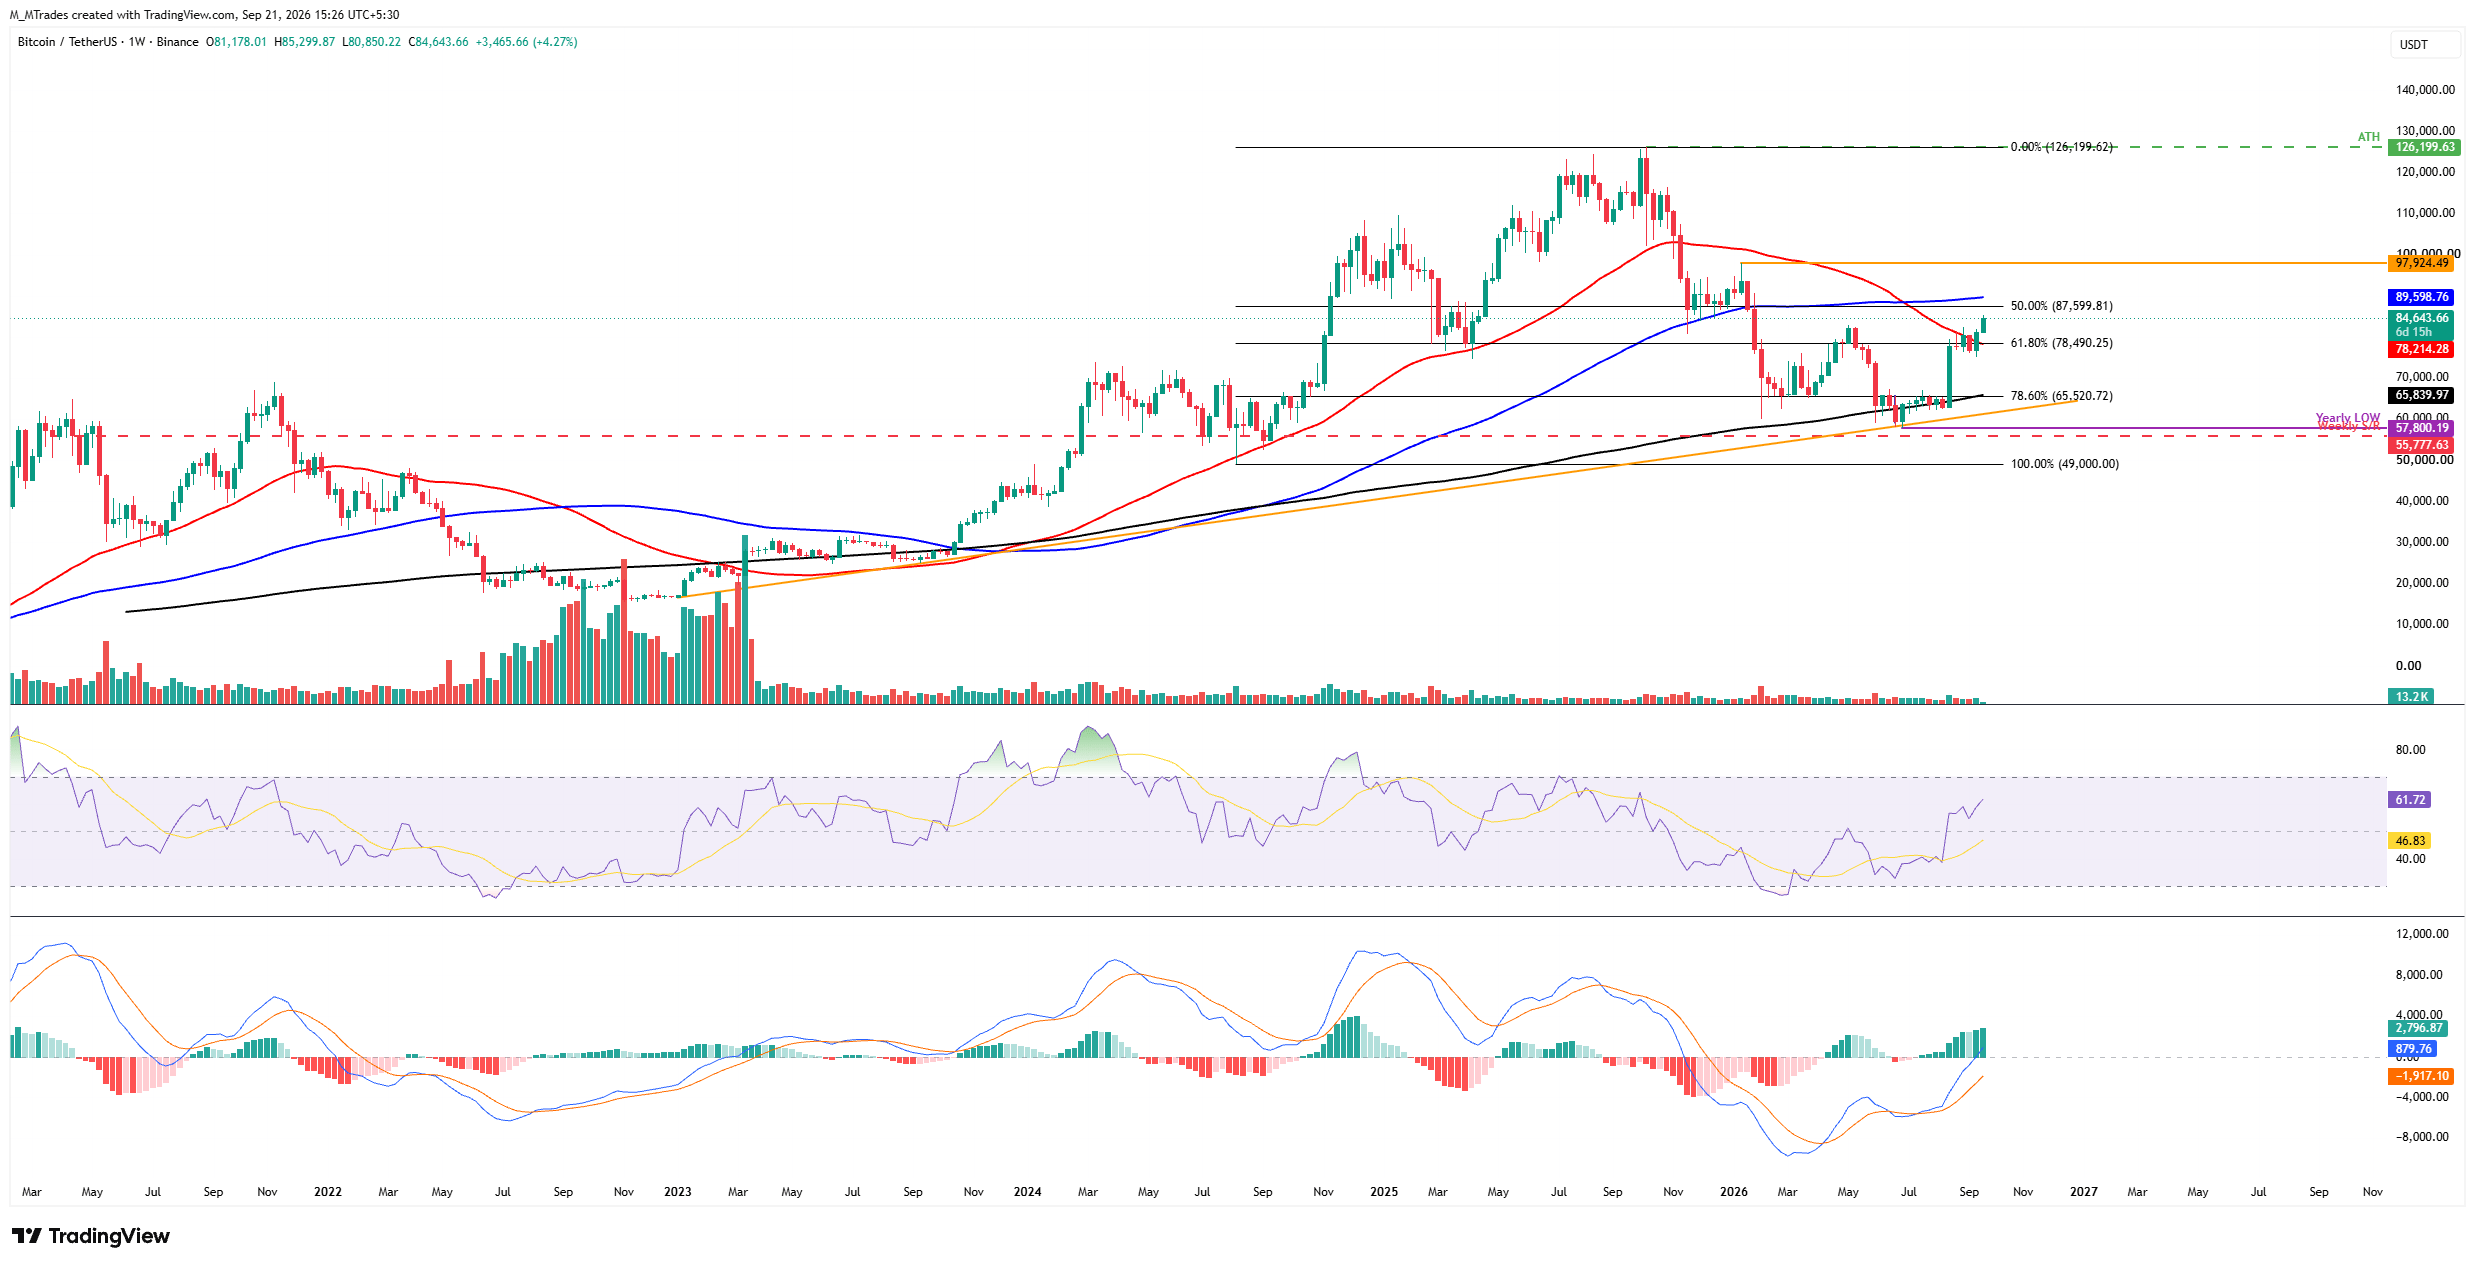
The Crypto King extends its gains, trading above $84,000 at the time of writing on Monday after rallying nearly 6% and closing above the 50-week Simple Moving Average (SMA) at $78,214 last week.
If BTC holds the 50-day SMA support, it could extend the rally toward the 50% Fibonacci retracement level at $87,599 (drawn from the August 2024 low of $49,000 to the October 2025 record high of $126,199), followed by the 100-week SMA at $89,598.
The Relative Strength Index (RSI) on the weekly chart around 61 shows positive momentum without reaching overbought conditions. At the same time, the Moving Average Convergence Divergence (MACD) histogram remains firmly in positive territory, with rising green histogram bars supporting the bullish thesis.
On the other hand, if BTC pulls back, it could extend the correction toward the 50-week SMA at 78,214. A close below this level could trigger further losses toward the key psychological level of $70,000.
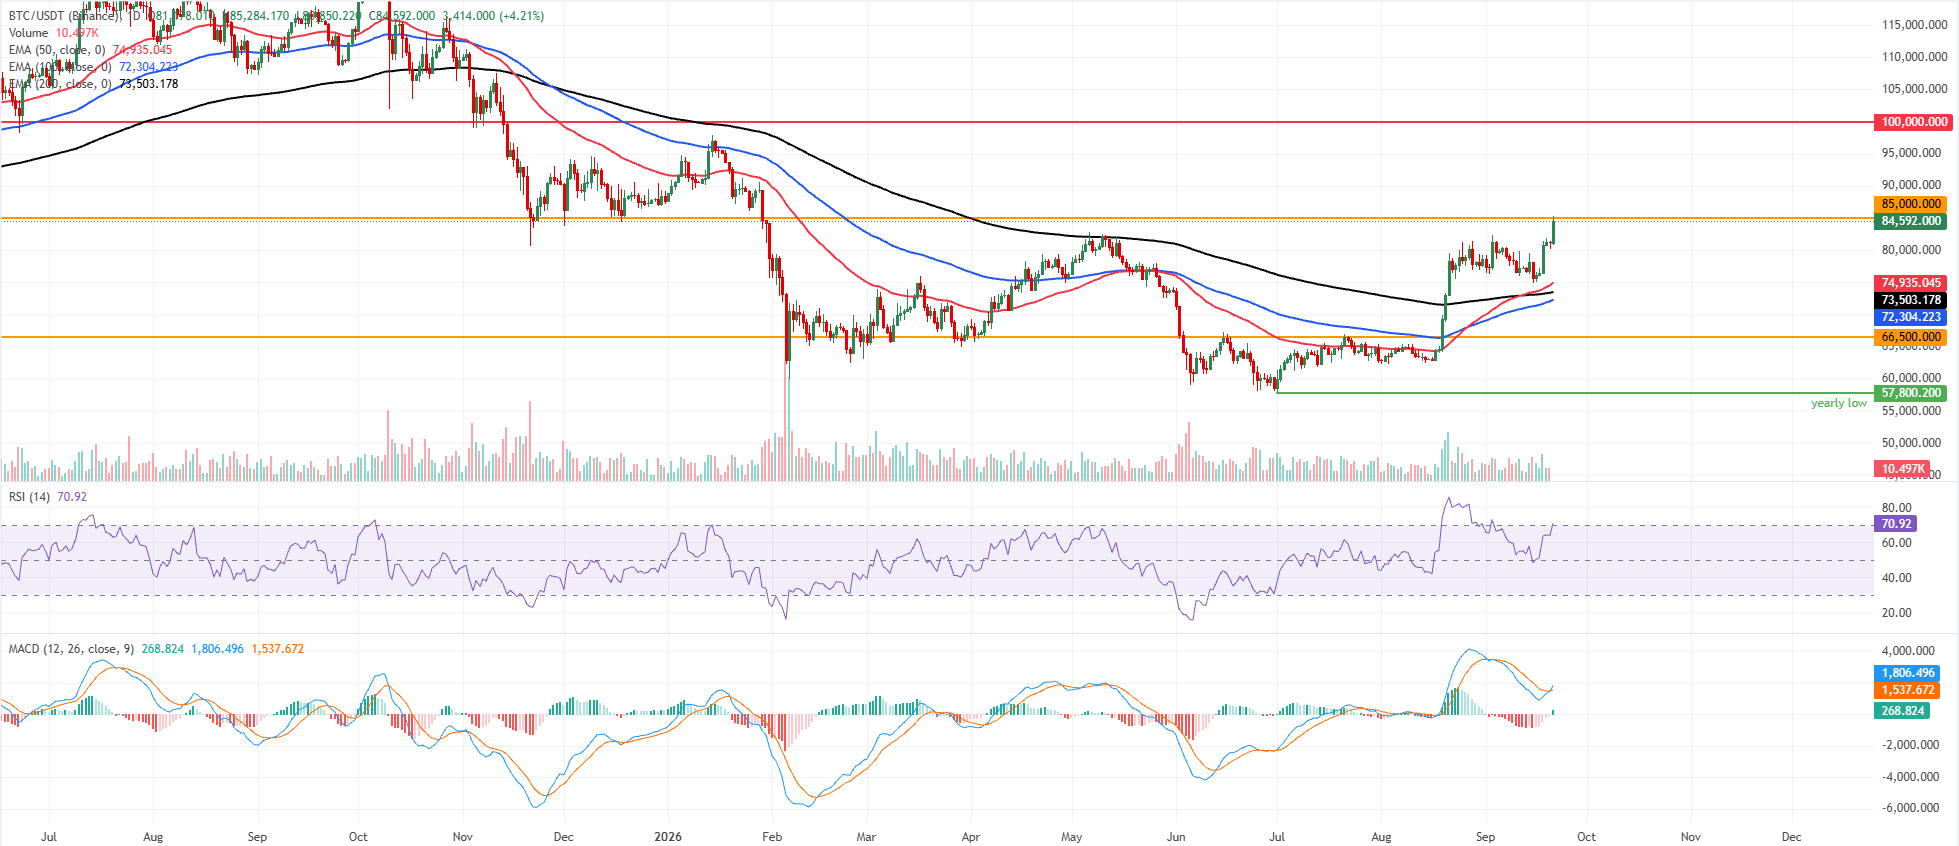
On the daily chart, BTC maintains a bullish near-term bias as price holds well above the 50-day, 100-day, and 200-day Exponential Moving Averages (EMAs) clustered between roughly $72,300 and $74,900.
The daily RSI hovers just below the overbought threshold near 70, while the MACD has turned positive, together suggesting firm but potentially stretched upside momentum as the pair approaches overhead supply.
On the topside, immediate resistance emerges at the horizontal barrier around $85,000, where a break would open the door to further gains.
On the downside, initial support is seen at the 50-day EMA near $74,935, followed by the 200-day EMA around $73,503 and the 100-day EMA near 72,304, with deeper structural cushions at $66,500 and $62,300 if a sharper pullback unfolds.
(The technical analysis of this story was written with the help of an AI tool. Know more.)
Bitcoin, altcoins, stablecoins FAQs
Bitcoin is the largest cryptocurrency by market capitalization, a virtual currency designed to serve as money. This form of payment cannot be controlled by any one person, group, or entity, which eliminates the need for third-party participation during financial transactions.
Altcoins are any cryptocurrency apart from Bitcoin, but some also regard Ethereum as a non-altcoin because it is from these two cryptocurrencies that forking happens. If this is true, then Litecoin is the first altcoin, forked from the Bitcoin protocol and, therefore, an “improved” version of it.
Stablecoins are cryptocurrencies designed to have a stable price, with their value backed by a reserve of the asset it represents. To achieve this, the value of any one stablecoin is pegged to a commodity or financial instrument, such as the US Dollar (USD), with its supply regulated by an algorithm or demand. The main goal of stablecoins is to provide an on/off-ramp for investors willing to trade and invest in cryptocurrencies. Stablecoins also allow investors to store value since cryptocurrencies, in general, are subject to volatility.
Bitcoin dominance is the ratio of Bitcoin's market capitalization to the total market capitalization of all cryptocurrencies combined. It provides a clear picture of Bitcoin’s interest among investors. A high BTC dominance typically happens before and during a bull run, in which investors resort to investing in relatively stable and high market capitalization cryptocurrency like Bitcoin. A drop in BTC dominance usually means that investors are moving their capital and/or profits to altcoins in a quest for higher returns, which usually triggers an explosion of altcoin rallies.
Bài viết đề xuất


