


Ripple and Stellar outlook: XRP ETF demand strengthens, XLM RWA market hits $4 billion milestone
- XRP trades around $1.37 on Tuesday after rebounding slightly, finding support around the key 200-day EMA at $1.35 the previous day.
- XLM nears a cluster of EMAs, a close above this resistance zone suggests recovery ahead.
- XRP records continued ETF inflows while XLM’s RWAs hit a new milestone with market capitalization over $4 billion.
Ripple (XRP) and Stellar (XLM) are showing signs of recovery on Tuesday after rebounding slightly the previous day, following double-digit corrections last week. Moreover, XRP continues to attract Exchange-Traded Fund (ETF) inflows and Stellar’s Real-World Assets (RWAs) ecosystem has surpassed $4 billion. These developments indicate growing institutional interest and could provide fresh fundamental support for a recovery in both altcoins.
XRP institutional demand shows signs of strength
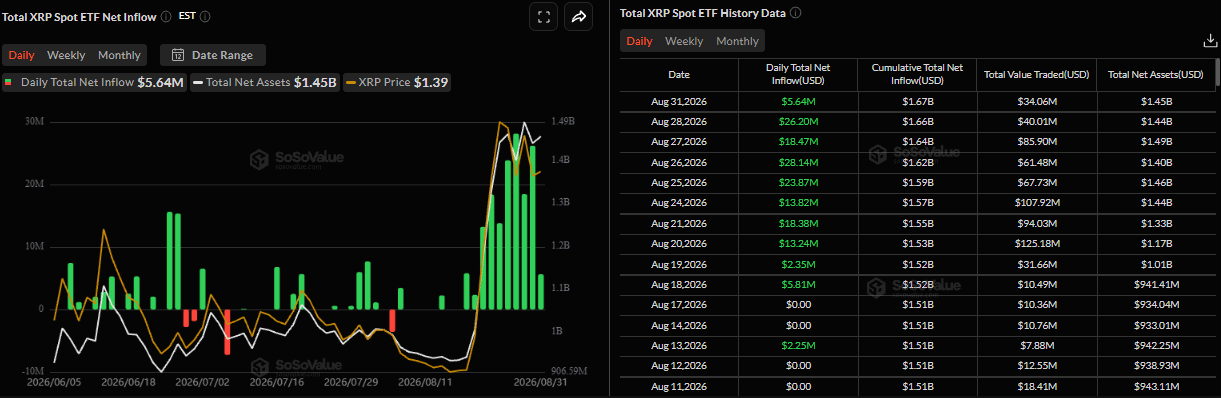
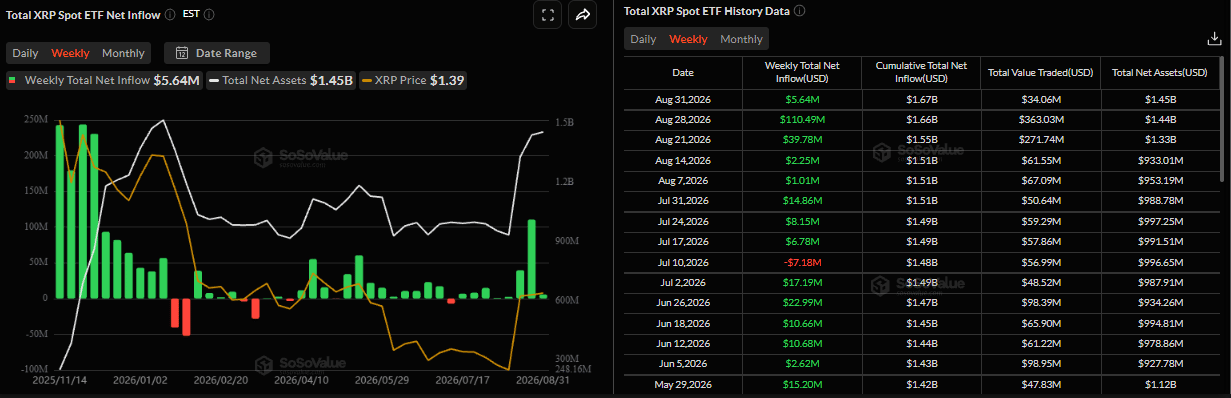
Institutional demand for XRP has remained strong. SoSoValue data showed spot ETFs recorded a $5.64 million inflow on Monday, marking 10 consecutive days of positive flows since August 18. Moreover, net weekly inflows last week exceeded $110 million, the highest weekly flows since early December 2025. If these inflows continue and intensify, XRP could support gains ahead.
XLM RWAs hit $4 billion
Stellar announced on its X account on Monday that Real-World Assets (RWAs) on its network have surpassed $4 billion. This highlights the rapid expansion of Stellar’s RWA ecosystem and supports a bullish long-term outlook for XLM.
XRP technical outlook: Key 200-day EMA holds strong
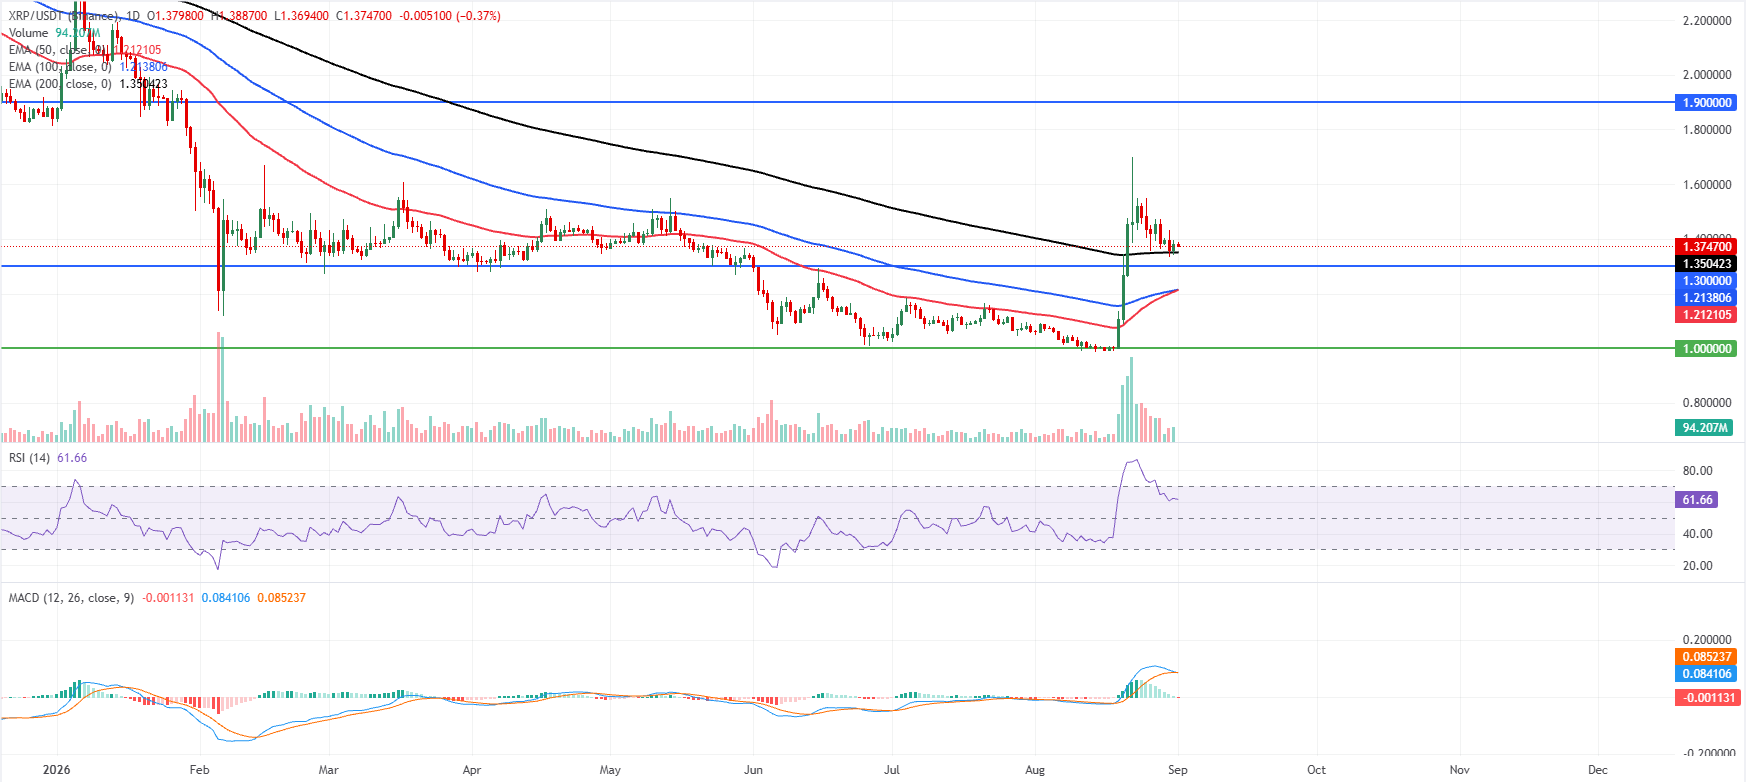
XRP price trades at $1.37 on Tuesday, maintaining a bullish near-term bias as it remains above key Exponential Moving Averages (EMAs). The 200-day EMA at $1.35 underpins the advance together with the 100-day EMA at $1.21 and the 50-day EMA at $1.21, suggesting a constructive underlying trend despite the recent pullback from overbought RSI readings.
The Relative Strength Index (RSI) has eased to 61 from earlier extreme levels. At the same time, the Moving Average Convergence Divergence (MACD) has slipped marginally negative, hinting at waning upside momentum rather than a clear trend reversal as long as price holds over the 200-day EMA.
On the topside, the next significant barrier is the horizontal resistance at $1.90, where fresh supply could emerge if the rally extends.
On the downside, immediate support sits around the current consolidation area, backed by the 200-day EMA at $1.35, followed by the horizontal floor at $1.30. Deeper setbacks would expose the broader demand zone defined by the 100-day and 50-day EMAs clustered near $1.21, ahead of the more distant structural support at $1.00.
XLM technical outlook: Near key resistance zone
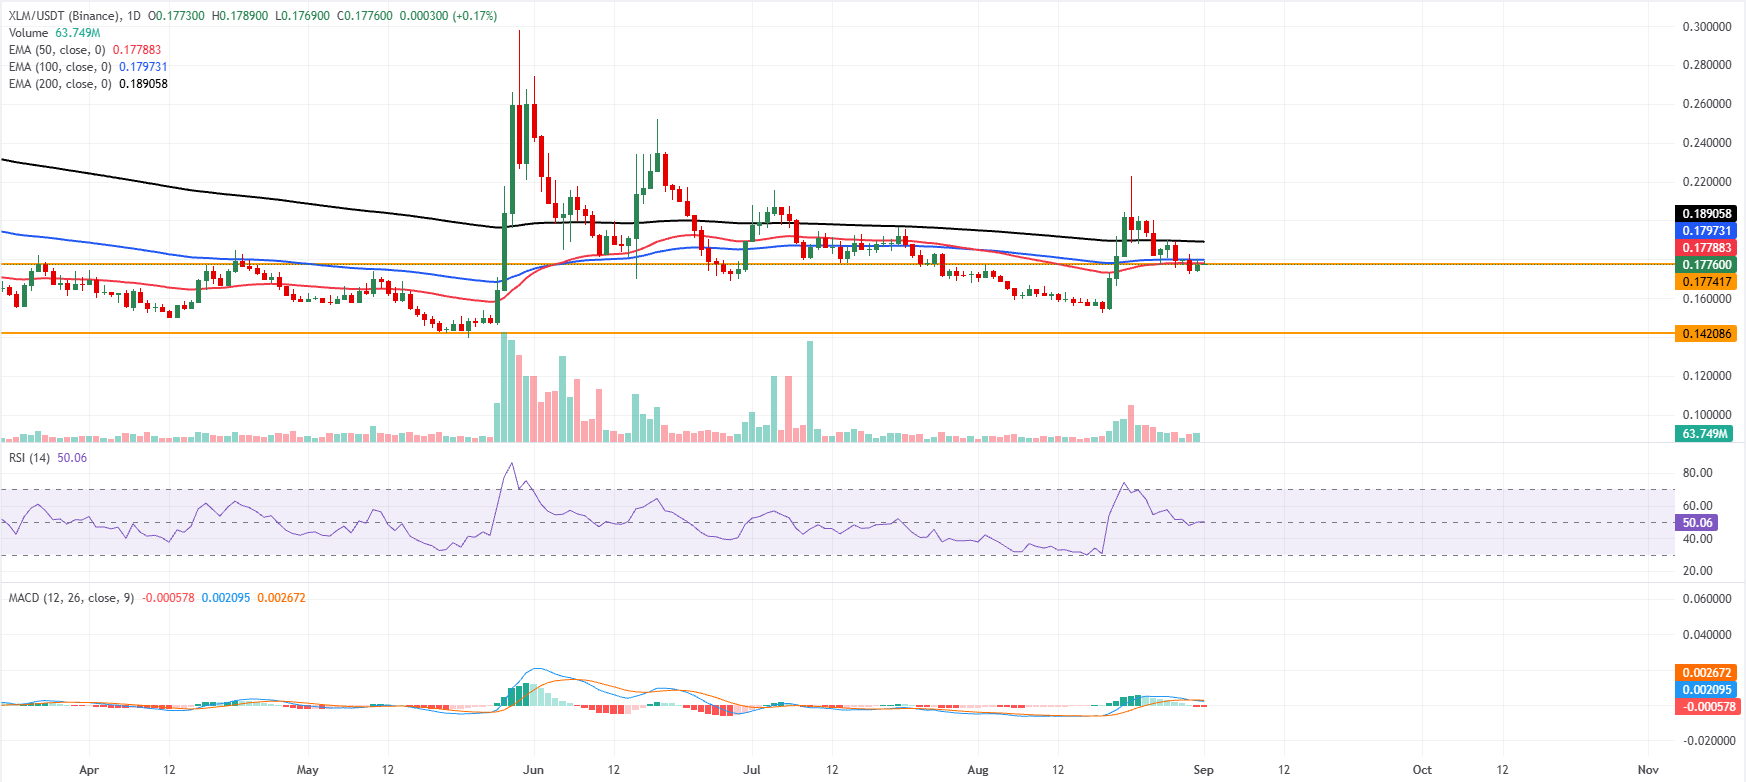
XLM price trades at $0.1776 on Tuesday, capped by a dense cluster of EMAs just overhead, which keeps the near-term bias bearish. XLM price is marginally below the 50-day EMA at $0.1778, with the 100-day and 200-day EMAs higher at $0.1797 and $0.1890, respectively, suggesting rallies remain vulnerable while these levels hold as resistance.
The RSI hovers around 50, hinting at a loss of upside momentum, while the MACD has slipped back below the zero line, reinforcing the idea of a fading bullish phase and scope for further consolidation or downside.
On the downside, immediate support is seen at the nearby horizontal level at $0.1774, which forms a tight pivot zone around the current price, before a more distant structural floor emerges at $0.1420.
On the topside, initial resistance is given by the 50-day EMA at $0.1778, followed by the 100-day EMA at $0.1797 and the 200-day EMA at $0.1890; only a sustained break above this moving-average stack would ease bearish pressure and open the way for a more constructive recovery phase.
(The technical analysis of this story was written with the help of an AI tool. Know more.)
Bài viết đề xuất


