


Top Altcoins Price Forecast: XRP loses $1, ADA in a freefall while SOL remains capped
- Ripple is trading below $1 on Tuesday, risking a steeper decline as downside pressure builds.
- Cardano extends losses amid a steady declining trend for over 10 days, approaching a key support trendline near $0.1650.
- Solana remains capped below $76.92, indicating a bearish bias despite neutral momentum.
Top altcoins, including Ripple (XRP), Cardano (ADA), and Solana (SOL), are facing intense downside pressure, resulting in either a steady decline or a bearish capped tone. Ripple slips below the $1 psychological threshold, Cardano maintains a steady decline for over 10 days, while Solana remains capped below a 50% retracement level near $76.92.
Technical outlook: XRP, ADA, and SOL remain vulnerable to deeper losses
XRP trades below $1.000 on Tuesday, extending a bearish bias as price holds below both the 50-day Exponential Moving Average (EMA) at $1.0740 and the 200-day EMA at $1.3594. The cross-border remittance token also remains capped by a nearer descending trendline resistance around $1.0745, reinforcing the sense of topside exhaustion.
Momentum reflects this bearish pressure, with the Relative Strength Index (RSI) hovering near 35 in shallow oversold territory and the Moving Average Convergence Divergence (MACD) remaining below the signal line, hinting at persistent downside risk.
The S1 Pivot level at $0.9945 serves as the immediate support floor; a sustained breakout below this zone could extend the decline toward the S2 Pivot level at $0.9271.
On the topside, immediate resistance is clustered in the $1.0740–$1.0745 area, where the 50-day EMA converges with the shorter-term descending trendline. A daily close above this band would be needed to ease the current bearish tone and open a path toward the R1 Pivot level at $1.1568.
Cardano trades around $0.1724, extending its pullback beneath the 50-day EMA at $0.1795 and well below the 200-day EMA at $0.2623, which together keep the broader bias bearish. From a technical perspective, the rising support trendline near $0.1650 emerges as the immediate target, where buyers could regain strength.
Momentum has cooled, with the RSI at 42, slipping below the midline and the MACD crossing below its signal line with an expanding negative histogram, hinting that sellers still have the upper hand.
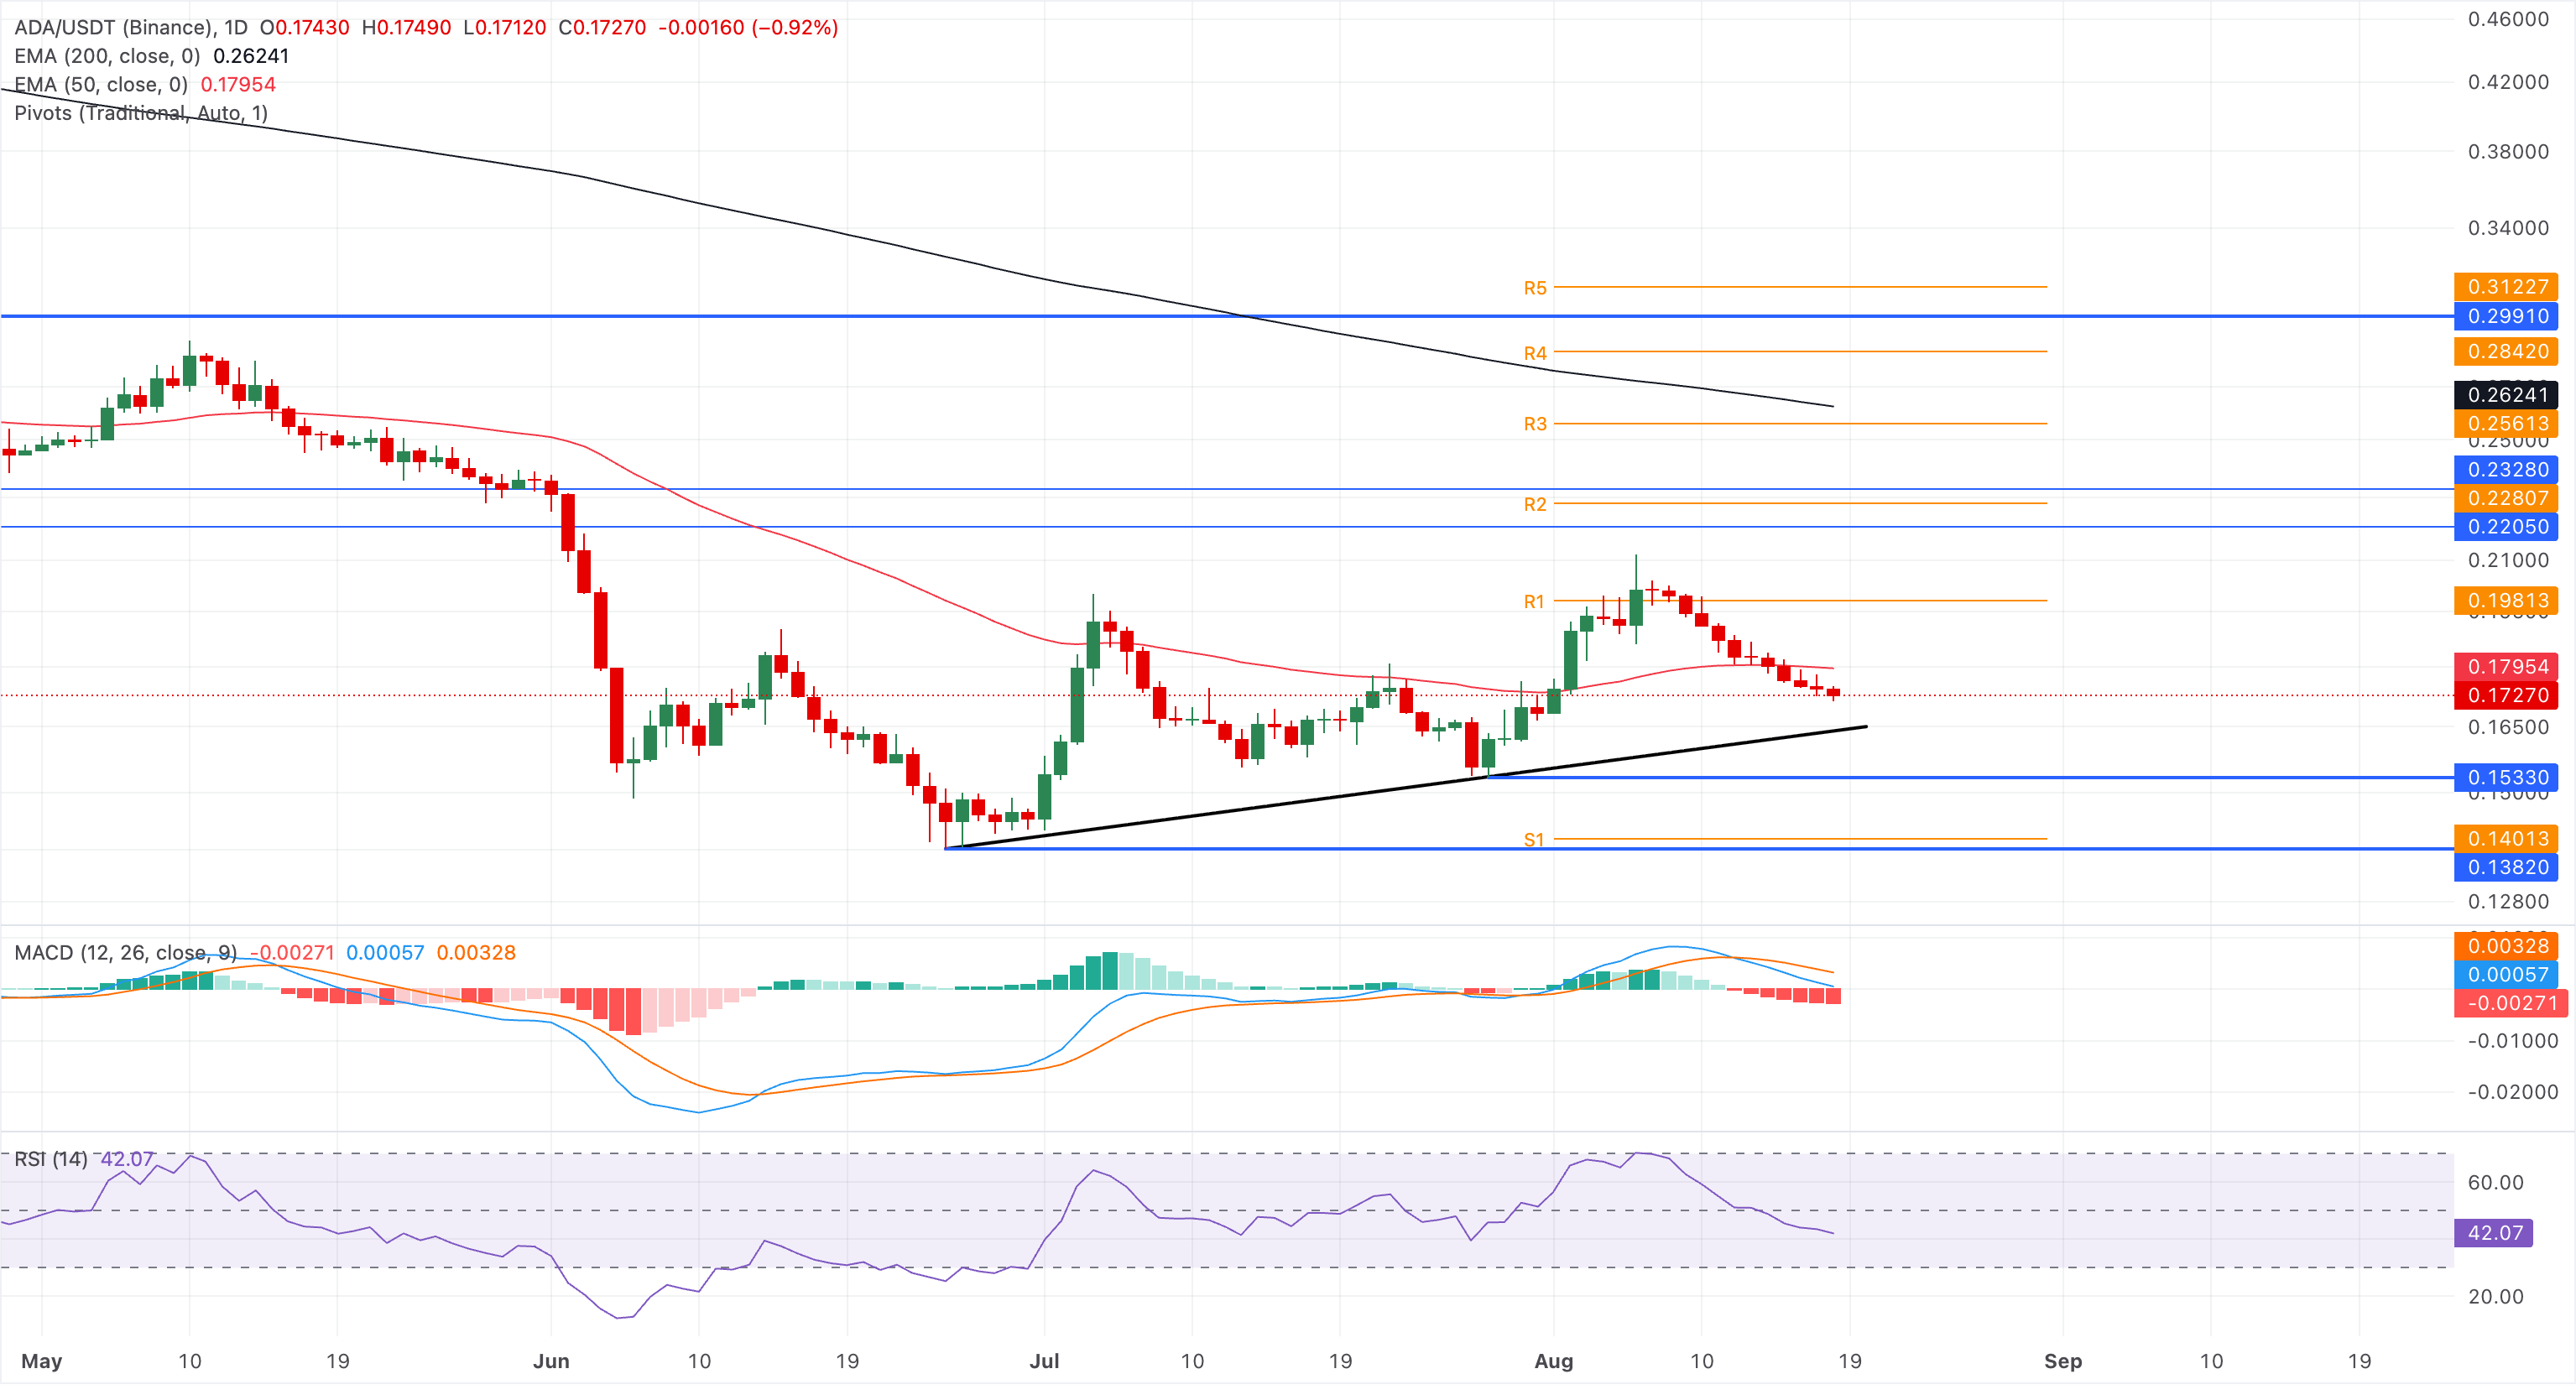
On the topside, immediate resistance aligns with the 50-day EMA at $0.1795, followed by the more significant medium-term barrier at the R1 Pivot level at $0.1981.
Solana hovers above $75.00, holding marginally above the 50-day EMA at $75.51 while remaining well below the 200-day EMA at $92.94, which keeps the broader trend capped despite a mildly constructive near-term tone. In addition, the 50% retracement of the downswing from $98.41 to $60.13, at $76.92, reinforces the capped tone.
The near-term rising support trendline near $73.96 remains a crucial zone for buyers to defend the recent pullbacks. A slip below this zone could result in a steeper decline toward the 23.6% Fibonacci retracement level at $67.54.
The MACD and signal line hold marginally above the zero line with a sideways trend, while the RSI around 51 reaffirms a balanced momentum rather than directional conviction.
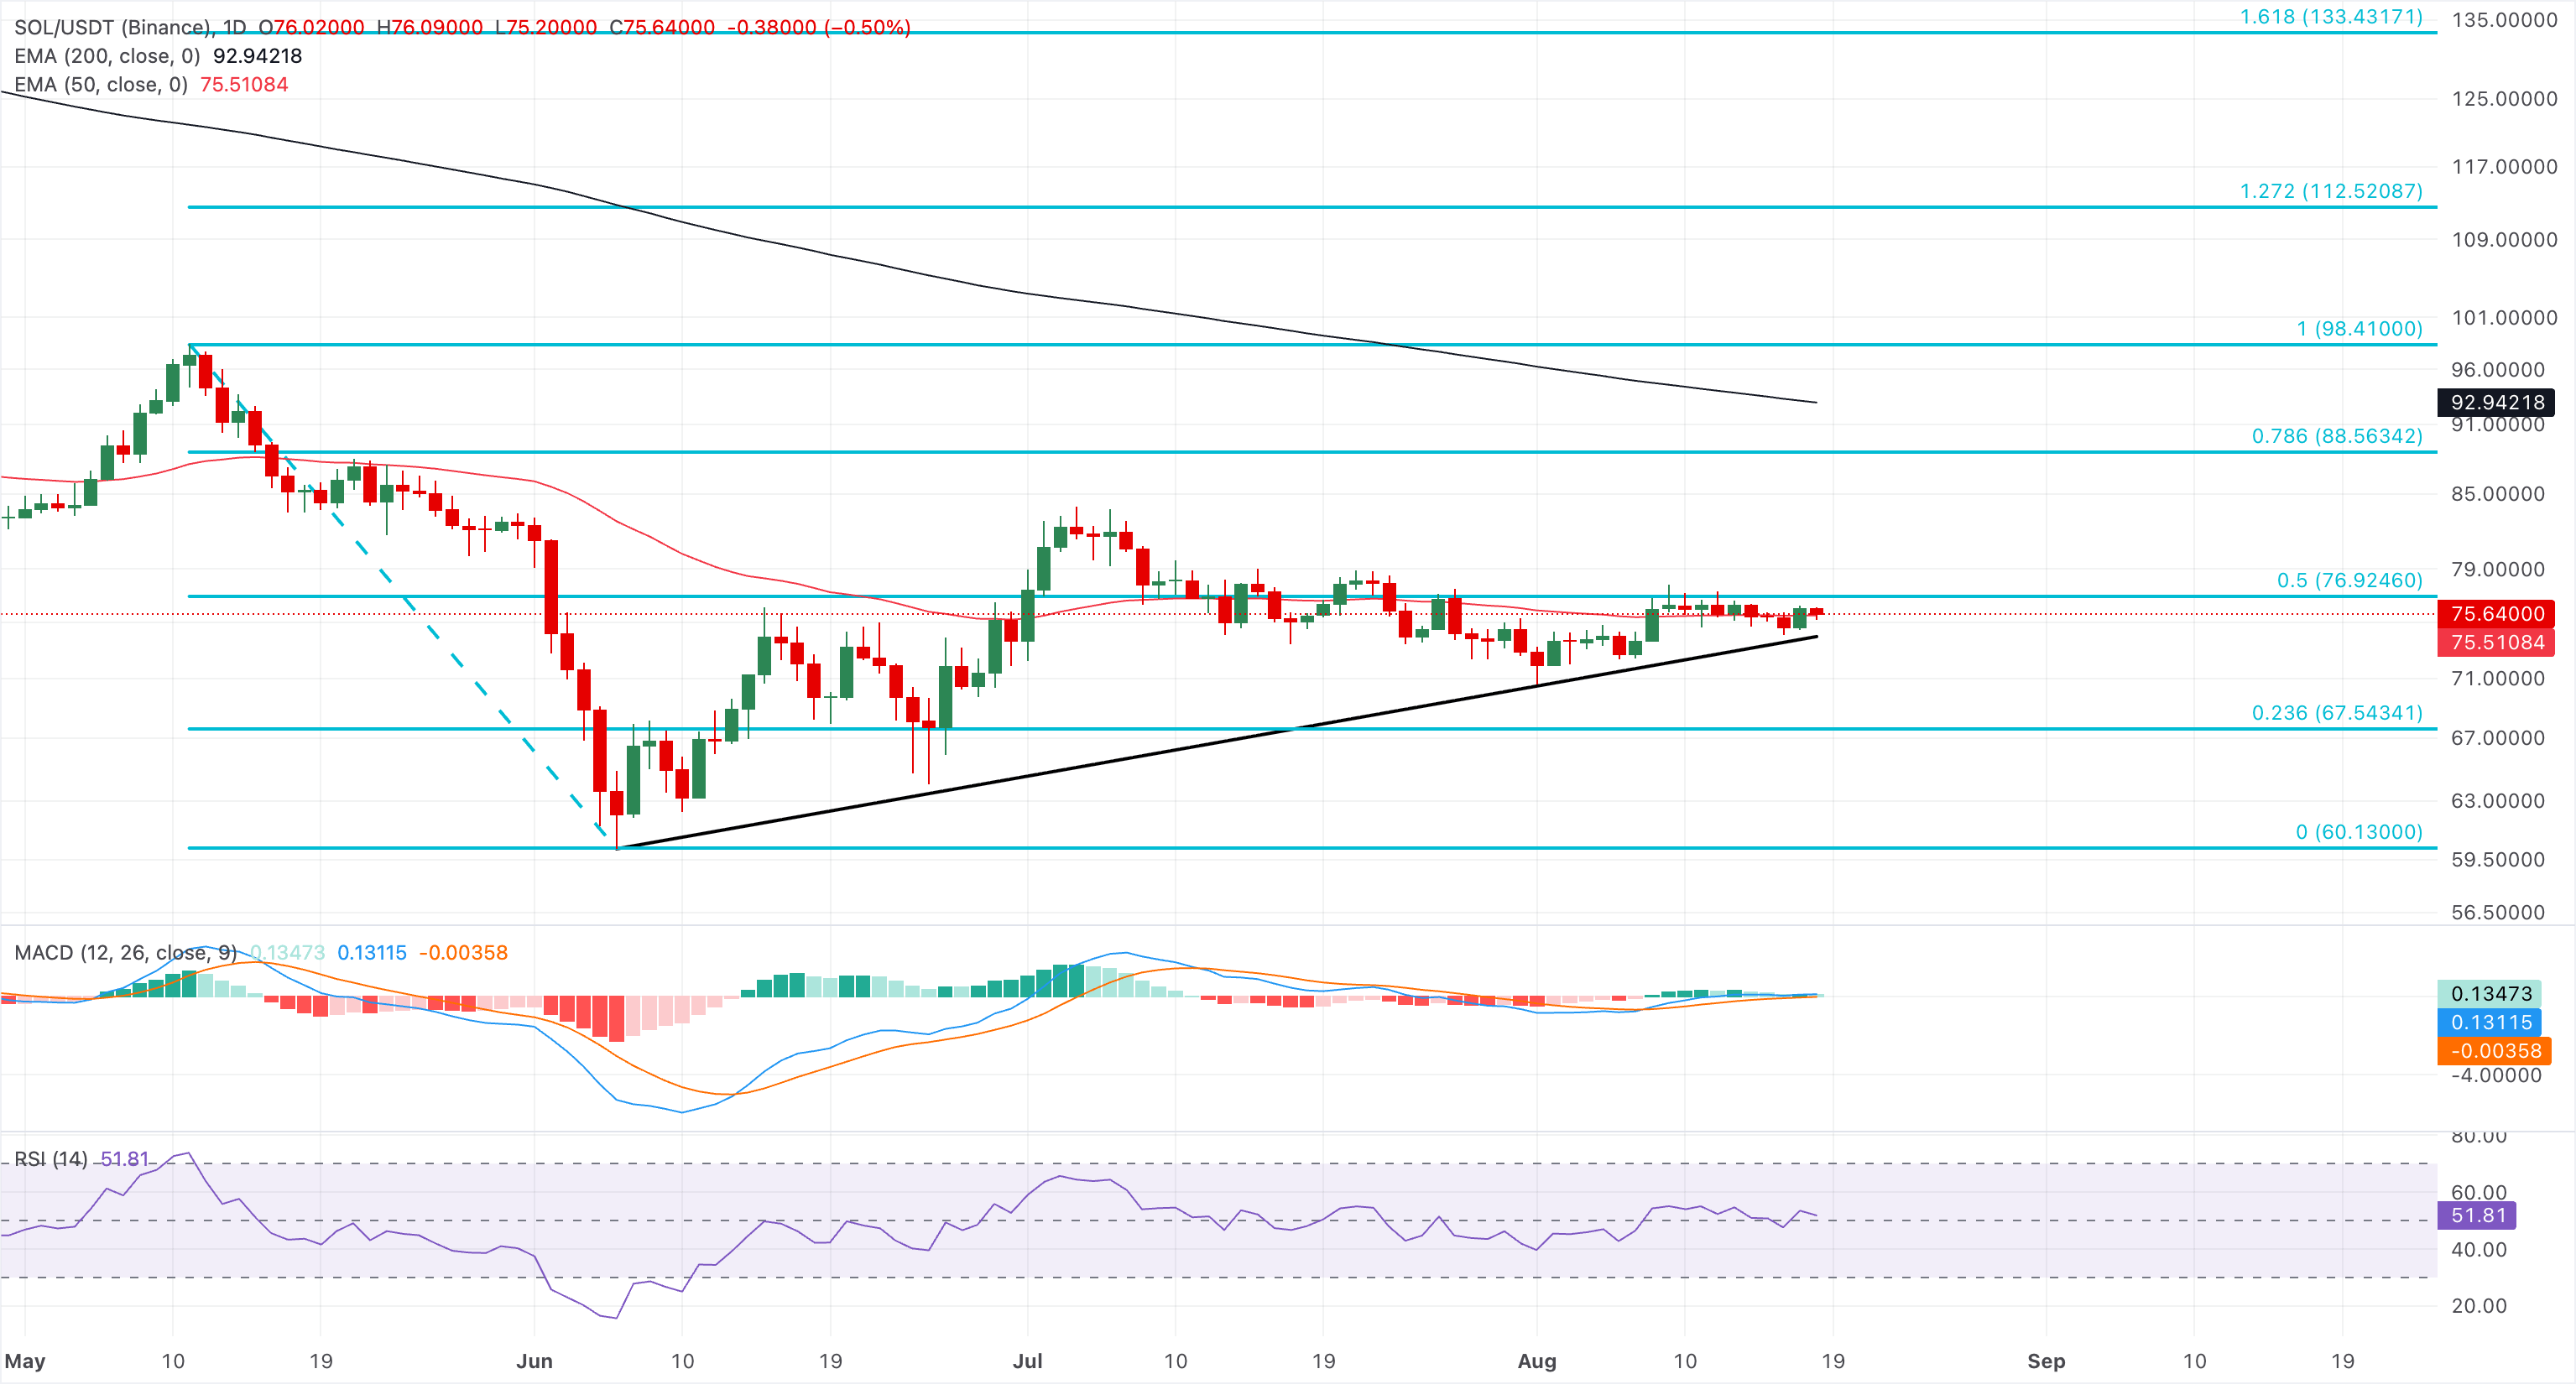
On the topside, initial resistance emerges at the 50% retracement near $76.92, followed by the 78.6% retracement level at $88.56 before the 200-day EMA at $92.94, marking a major long-term cap.
(The technical analysis of this story was written with the help of an AI tool. Know more.)
Bài viết đề xuất


