


Bitcoin Price Forecast: BTC faces volatility as US CPI data looms
- Bitcoin trades at $63,800 on Wednesday after falling more than 2% over the previous two days.
- Mixed spot BTC ETF flows signal cautious sentiment and indecision among institutional investors.
- Traders await US CPI data on Wednesday, which could shift Fed rate hike expectations and trigger fresh volatility in BTC.
Bitcoin (BTC) trades around $63,800 at the time of writing on Wednesday after falling more than 2% over the previous two days. Mixed spot Exchange Traded Funds (ETFs) flows suggest cautious institutional demand. Meanwhile, traders are now turning their attention to the upcoming US July Consumer Price Index (CPI) data on Wednesday, which could influence Federal Reserve (Fed) rate hike expectations and trigger fresh volatility in the Crypto King.
US CPI could shape risky assets outlook
All eyes remain on the high-impact US CPI data, which could determine whether risky assets such as BTC extend their recovery or decline sharply.
Nothing appears to have changed in the fundamental backdrop as the deadlock between the US and Iran over the talks on the reopening of the Strait of Hormuz and the US and Yemen's Iran-aligned Houthis’ separate attacks on shipping continue to keep Oil prices and inflation concerns elevated.
According to the CME Group's FedWatch Tool, the odds of a September Fed rate hike stand at nearly 50%, shifting the focus back to the US CPI data release, particularly the core inflation readings, as they are shielded from the war-driven energy swings.
FXStreet economic calendar shows that the annual core CPI is seen rising by 2.5% in July, slowing from a 2.6% increase in June. Meanwhile, core CPI inflation is expected to climb to 0.2% month-over-month (MoM) in July, following a flat reading in June.
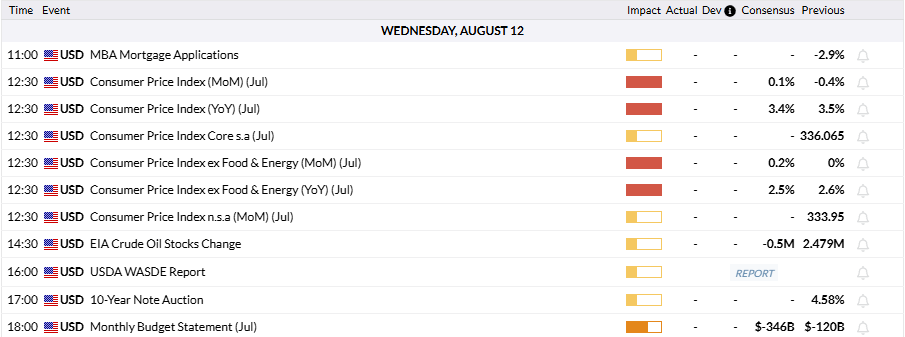
A hotter-than-expected core CPI reading could strengthen expectations for a more hawkish Fed. This outlook could support safer assets such as the US Dollar (USD) and Treasury yields and weigh on risk-sensitive assets such as BTC. Conversely, softer inflation data could revive expectations for Fed rate cuts, weaken the Dollar and yields, and provide a bullish catalyst for Bitcoin.
However, traders should be cautious as persistent geopolitical uncertainty could limit the initial reaction and keep BTC vulnerable to heightened volatility following the CPI release.
Institutional investors show mixed signs
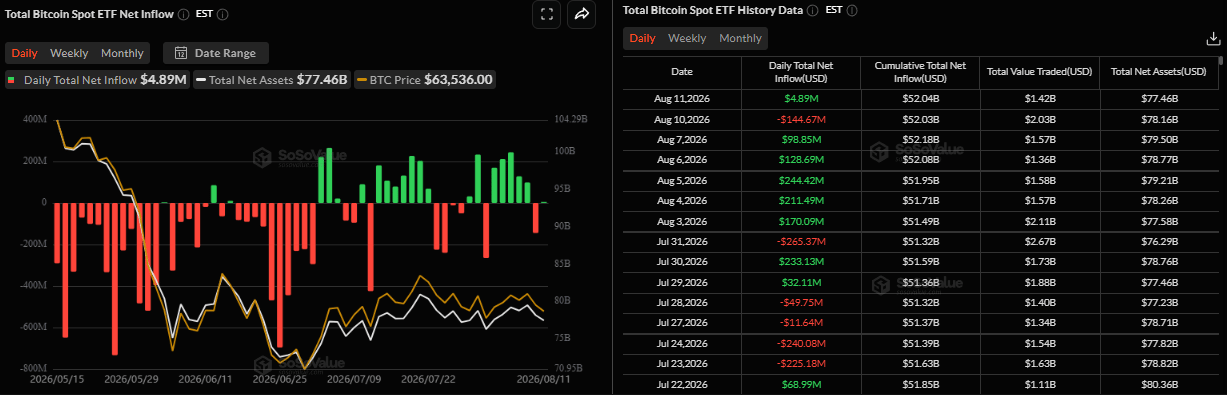
Institutional demand for Bitcoin shows caution with mild bullish sentiment. SoSoValue data shows that spot BTC ETF recorded a mild inflow of $4.89 million on Tuesday after an outflow of $144.67 million the previous day. This shift suggests that institutional selling pressure may be easing, but the relatively small inflow indicates that investors remain cautious ahead of the US CPI release.
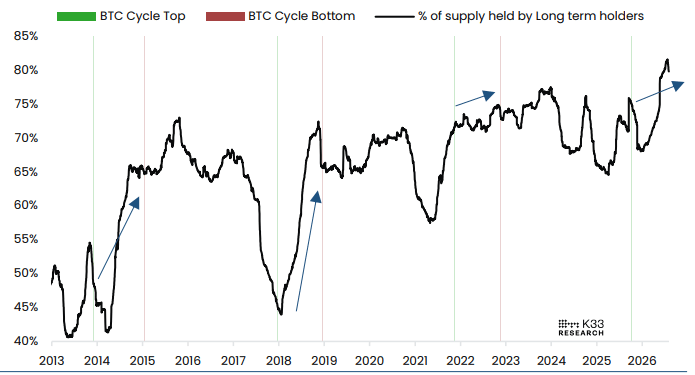
A K33 Research report on Tuesday highlighted that long-term holders are absorbing BTC.
The report explains that combining the stagnant and boring price action with uniquely soft trading volumes, we find a market characterized by clear apathy. Sellers' aggressiveness has naturally declined, as they have had plenty of time to sell amid discouraging narratives, a 50% drawdown, and months of opportunities to exit. Clear on-chain trends show inventory moving from long-term holders to short-term holders and then back to new long-term holders, as illustrated by the arrows in the chart below, further implying sell-side saturation. Meanwhile, BTC naturally faces reluctant participation from buyers amid clear relative weakness and few imminent signs of a regime change.
“All in all, this has left BTC stuck in a rigorously bland trading range, chopping around at close to a 50% drawdown from its all-time high. As we have stressed multiple times, we continue to view this as a very appealing area to allocate to BTC,” concluded the K33 Research analyst.
Bitcoin technical outlook: BTC to test $65K resistance or slide toward $60K?
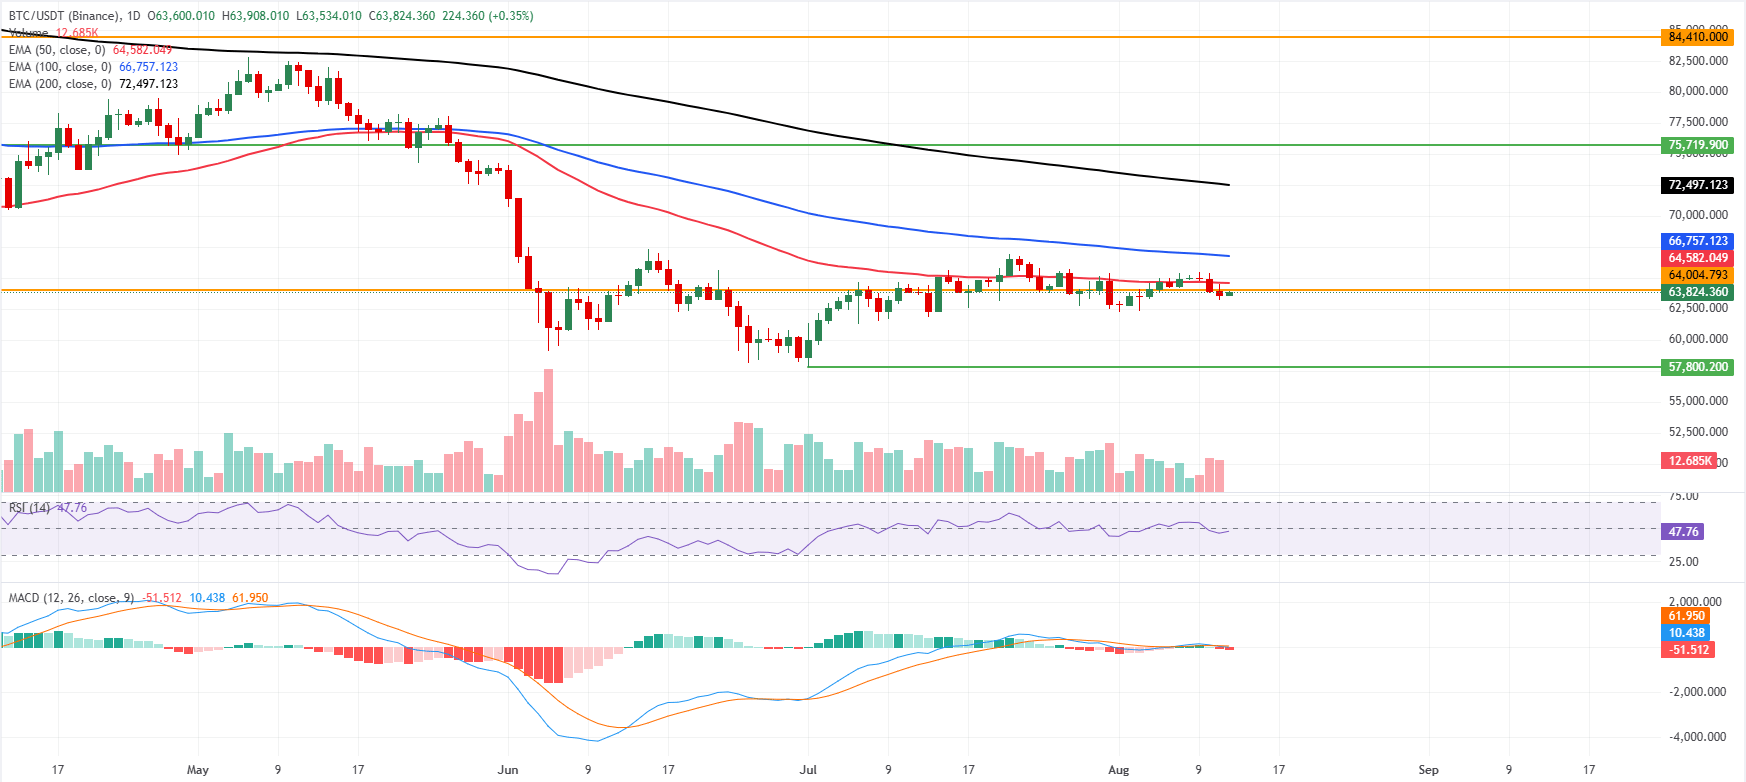
Bitcoin price trades around $63,800 on Wednesday, retaining a bearish near-term bias as it holds below all key EMAs on the daily chart. The 50-day EMA at $64,582, the 100-day EMA at $66,757 and the 200-day EMA at $72,497 all sit above price, suggesting the broader trend remains under downside pressure despite the recent bounce from sub-$63,000.
Momentum indicators are subdued, with the Relative Strength Index (RSI) at 47 hovering just below neutral and the Moving Average Convergence Divergence (MACD) with a slightly negative histogram, hinting at a weak, corrective tone rather than impulsive buying.
On the topside, immediate resistance is seen at the horizontal level around $64,004, just above the current price, with the 50-day EMA at $64,582 reinforcing this initial cap. Further up, the 100-day EMA at $66,757 and the 200-day EMA at $72,497 define successive barriers before a more distant structural ceiling at $75,719.
On the downside, the key psychological support is at $60,000. A daily close below this area would trigger a deeper correction toward the yearly low of $57,800 set on July 1.
(The technical analysis of this story was written with the help of an AI tool. Know more.)
Bitcoin, altcoins, stablecoins FAQs
Bitcoin is the largest cryptocurrency by market capitalization, a virtual currency designed to serve as money. This form of payment cannot be controlled by any one person, group, or entity, which eliminates the need for third-party participation during financial transactions.
Altcoins are any cryptocurrency apart from Bitcoin, but some also regard Ethereum as a non-altcoin because it is from these two cryptocurrencies that forking happens. If this is true, then Litecoin is the first altcoin, forked from the Bitcoin protocol and, therefore, an “improved” version of it.
Stablecoins are cryptocurrencies designed to have a stable price, with their value backed by a reserve of the asset it represents. To achieve this, the value of any one stablecoin is pegged to a commodity or financial instrument, such as the US Dollar (USD), with its supply regulated by an algorithm or demand. The main goal of stablecoins is to provide an on/off-ramp for investors willing to trade and invest in cryptocurrencies. Stablecoins also allow investors to store value since cryptocurrencies, in general, are subject to volatility.
Bitcoin dominance is the ratio of Bitcoin's market capitalization to the total market capitalization of all cryptocurrencies combined. It provides a clear picture of Bitcoin’s interest among investors. A high BTC dominance typically happens before and during a bull run, in which investors resort to investing in relatively stable and high market capitalization cryptocurrency like Bitcoin. A drop in BTC dominance usually means that investors are moving their capital and/or profits to altcoins in a quest for higher returns, which usually triggers an explosion of altcoin rallies.
Bài viết đề xuất


