


Crypto Today: Bitcoin and Ethereum gain ground as XRP extends decline amid potential Iran-Oman deal
- Bitcoin maintains a short-term bullish outlook near $65,000 ahead of a possible Iran-Oman deal on the Strait of Hormuz.
- Ethereum extends recovery for a second consecutive day, reclaiming support above $1,900.
- XRP bears retain control as the price falls toward the critical $1.00 level amid a weak technical structure.
The cryptocurrency market is somewhat lethargic on Thursday, with Bitcoin (BTC) approaching $65,000, Ethereum (ETH) holding above $1,900 while Ripple (XRP) trades under pressure around $1.05. This mixed outlook comes ahead of a potential deal between Iran and Oman on the management of shipping through the Strait of Hormuz. Still, Iran has denied negotiations with the United States (US).
Iran and Oman eye Strait of Hormuz deal
Iran and Oman are reportedly nearing the finalization of a strategic framework for commercial shipping through the Strait of Hormuz. Despite progress, Iranian Deputy Foreign Minister Kazem Gharibabadi emphasized to Islamic Republic News Agency (IRNA) that any agreement would not necessarily guarantee the immediate reopening of the waterway.
A senior Gulf official assesses the probability of a deal being reached by Friday at 50%.
US Vice President JD Vance stated in a Fox News interview that negotiations with Iran are likely to be “messy”, citing significant challenges posed by Iran’s fractured political system and negotiating stance.
Moreover, Iran has continued to deny negotiations with the US despite President Donald Trump's optimism on Tuesday that a deal could be announced this week.
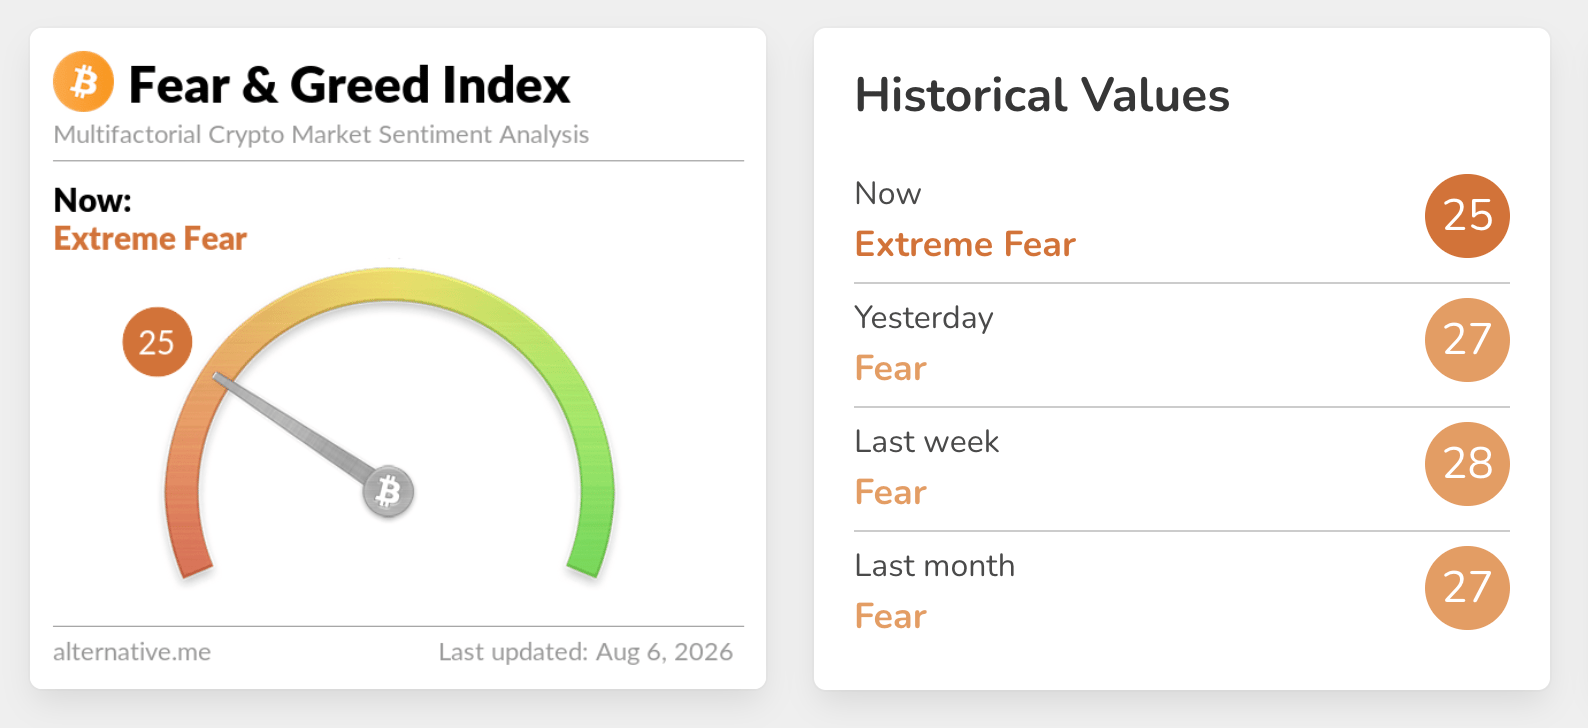
Despite Bitcoin and Ethereum sustaining a slightly short-term bullish outlook, crypto market sentiment is back in Extreme Fear territory at 25 on Thursday, down from 27 the day before. This broadly means that appetite for risk assets remains on the back foot as investors assess the direction the US and Iran are likely to take if negotiations fail.
"Investors remain focused on several key variables, including the Federal Reserve's monetary policy outlook, global liquidity conditions, the performance of the US Dollar (USD), and developments in the international geopolitical landscape,” Simon-Peter Massabni, Business Development head at XS.com, said in a comment.
Bitcoin builds on reclaimed support
Bitcoin holds a modest bullish bias as it trades above the short-term 50-day Exponential Moving Average (EMA) at $64,673 and above the reclaimed downtrend resistance trendline around $63,514, while still capped by the Parabolic SAR at $65,404.
Momentum is constructive, with the Relative Strength Index (RSI) hovering near 54 and the Moving Average Convergence Divergence (MACD) line turning slightly positive, which together hint that buyers are gradually regaining control even though the broader trend remains constrained by the 100-day and 200-day EMAs at $67,043 and $72,505, respectively.
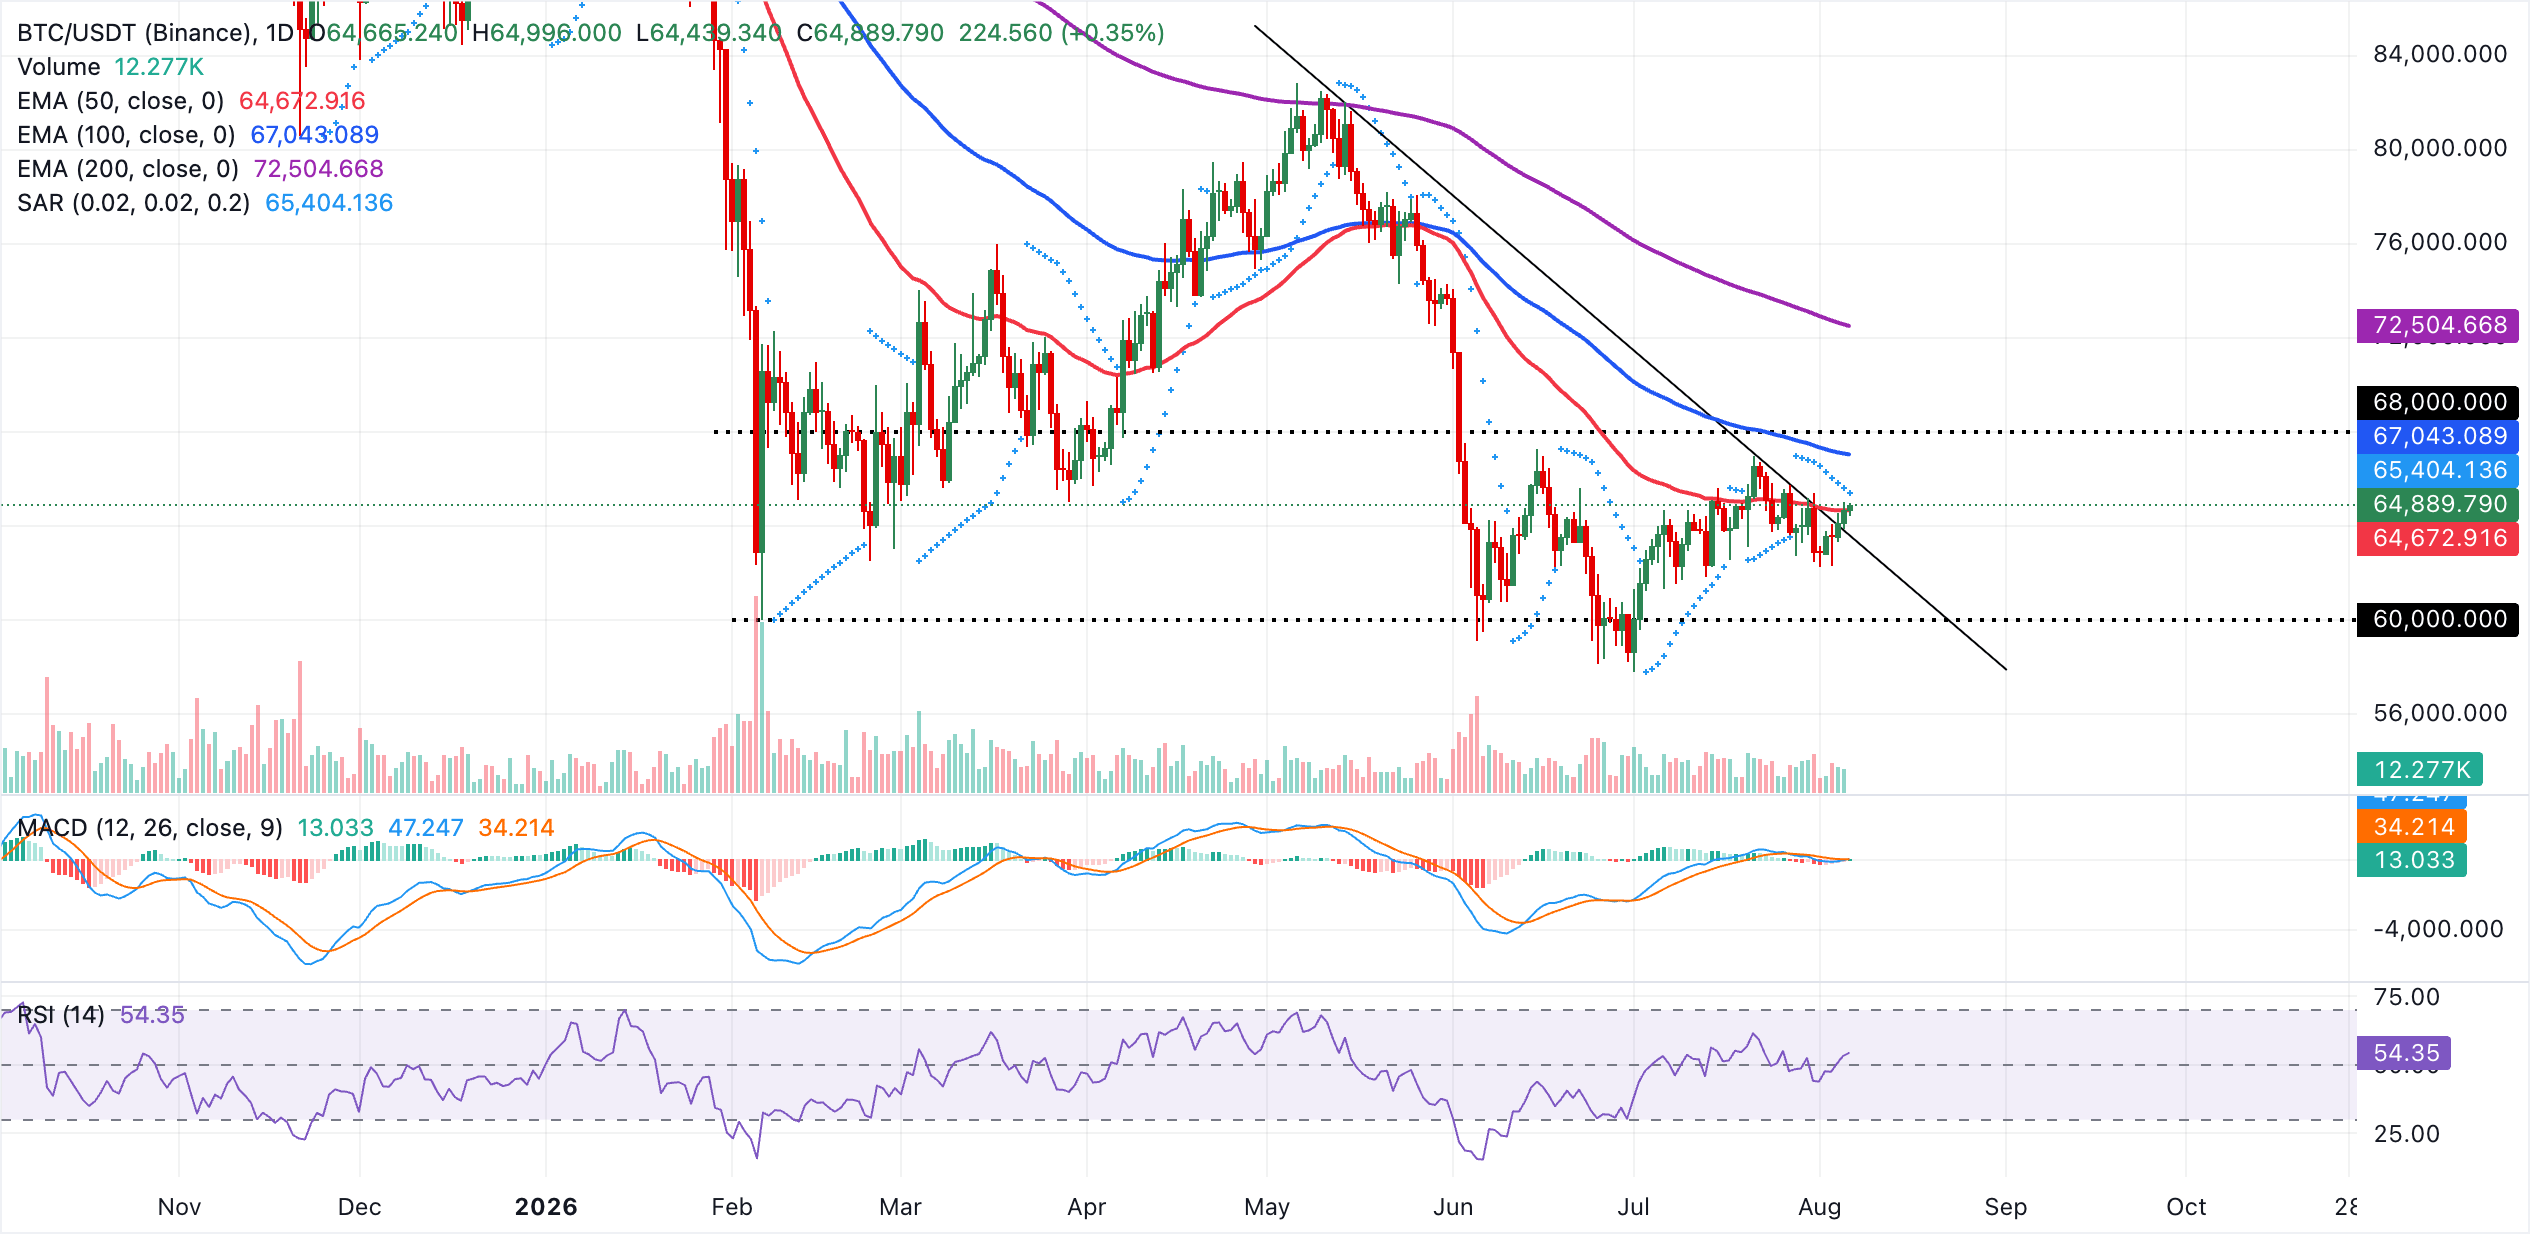
On the downside, initial support emerges at the 50-day EMA near $64,673, followed by the former descending trendline barrier turned support around $63,514. On the topside, immediate resistance is defined by the Parabolic SAR at $65,404, with further hurdles at the 100-day EMA around $67,043.20 and then the 200-day EMA near $72,505, levels that would need to be decisively cleared to strengthen the bullish continuation narrative.
“Bitcoin continues to trade roughly 50% below its all-time high reached in October, highlighting that the market still requires new catalysts to establish a stronger bullish trend,” Massabni added.
Altcoins technical outlook: Ethereum rebounds as XRP weakens
Ethereum trades at $1,913, holding above the 50-day EMA at $1,856 and the broken rising trendline support near $1,859, which together underpin a mildly constructive near-term tone. Still, the pair remains capped beneath the 100-day EMA at $1,925 and the 200-day EMA at $2,134, keeping the broader recovery in check until these levels are reclaimed.
The RSI around 56 suggests moderate bullish momentum, while the MACD still prints a negative histogram, hinting that upside pressure is improving but not yet dominant.
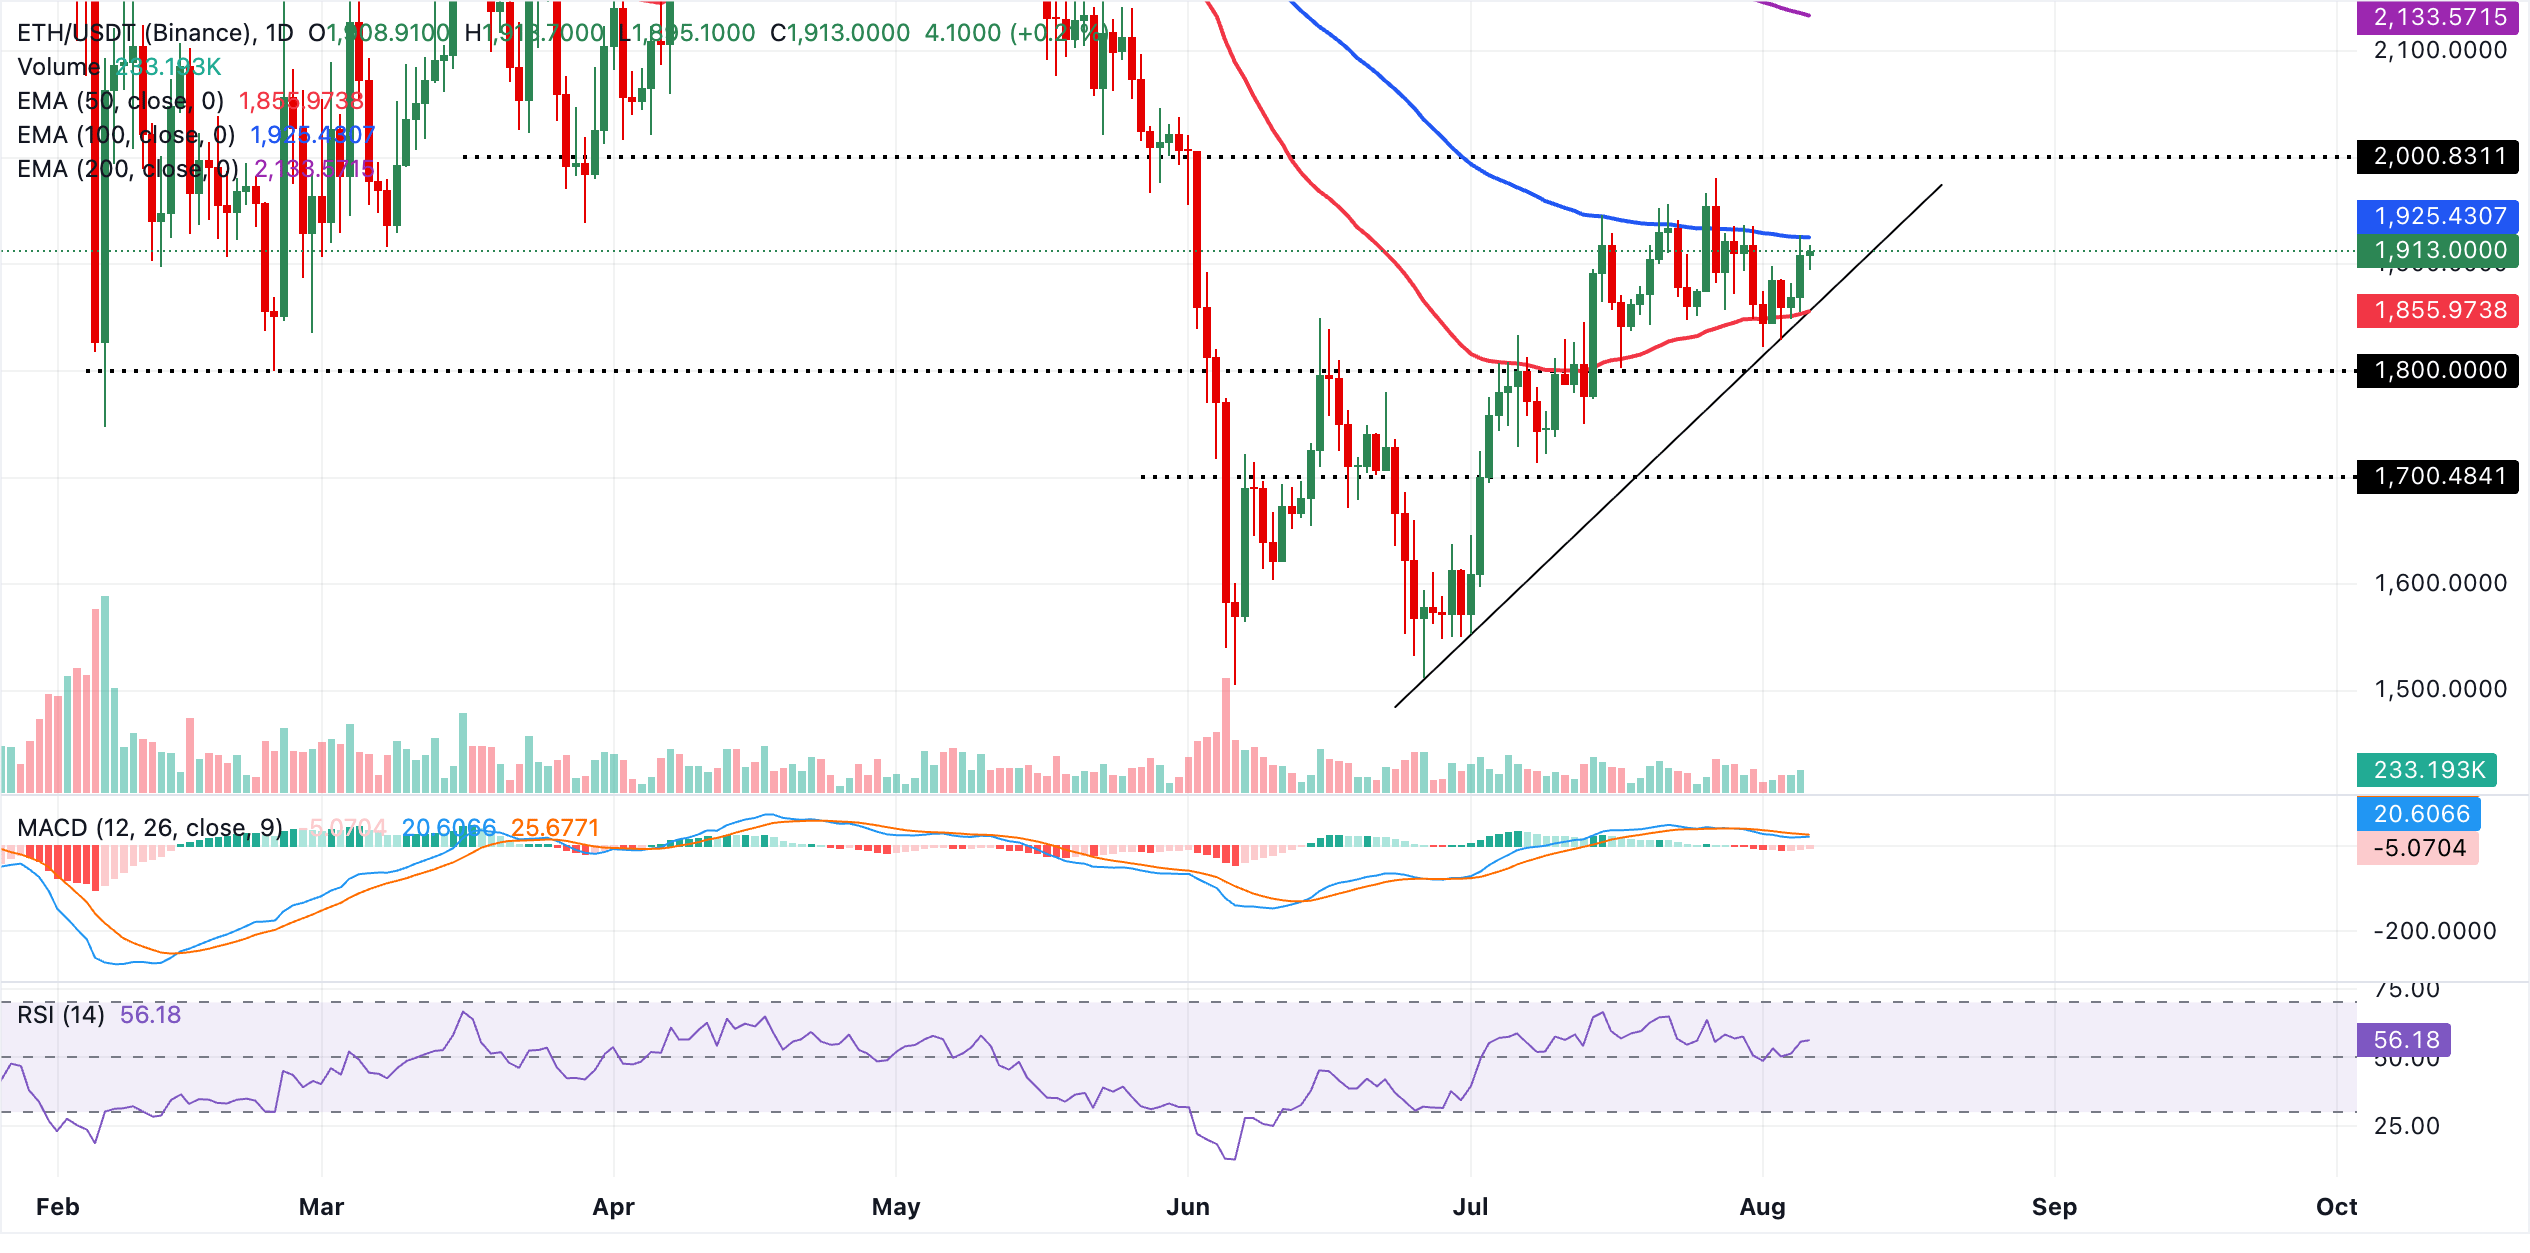
Immediate support lies at the $1,913 area as a short-term pivot, followed by the former trendline break level at $1,859 and then the 50-day EMA at $1,856, where buyers are likely to defend the broader uptrend structure. On the topside, initial resistance emerges at the 100-day EMA at $1,925. A sustained move above this barrier would open the way toward the more significant 200-day EMA at $2,134, beyond which the medium-term bullish case would be reinforced.
XRP, on the other hand, maintains a bearish near-term bias as the spot price holds beneath the 50-day EMA at about $1.11, the 100-day EMA near $1.20, and the 200-day EMA around $1.39, keeping the broader recovery capped. Bollinger Bands show price trading below the midline at roughly $1.09, while the RSI near 40 and a negative MACD reading hint at subdued momentum consistent with continued downside pressure.
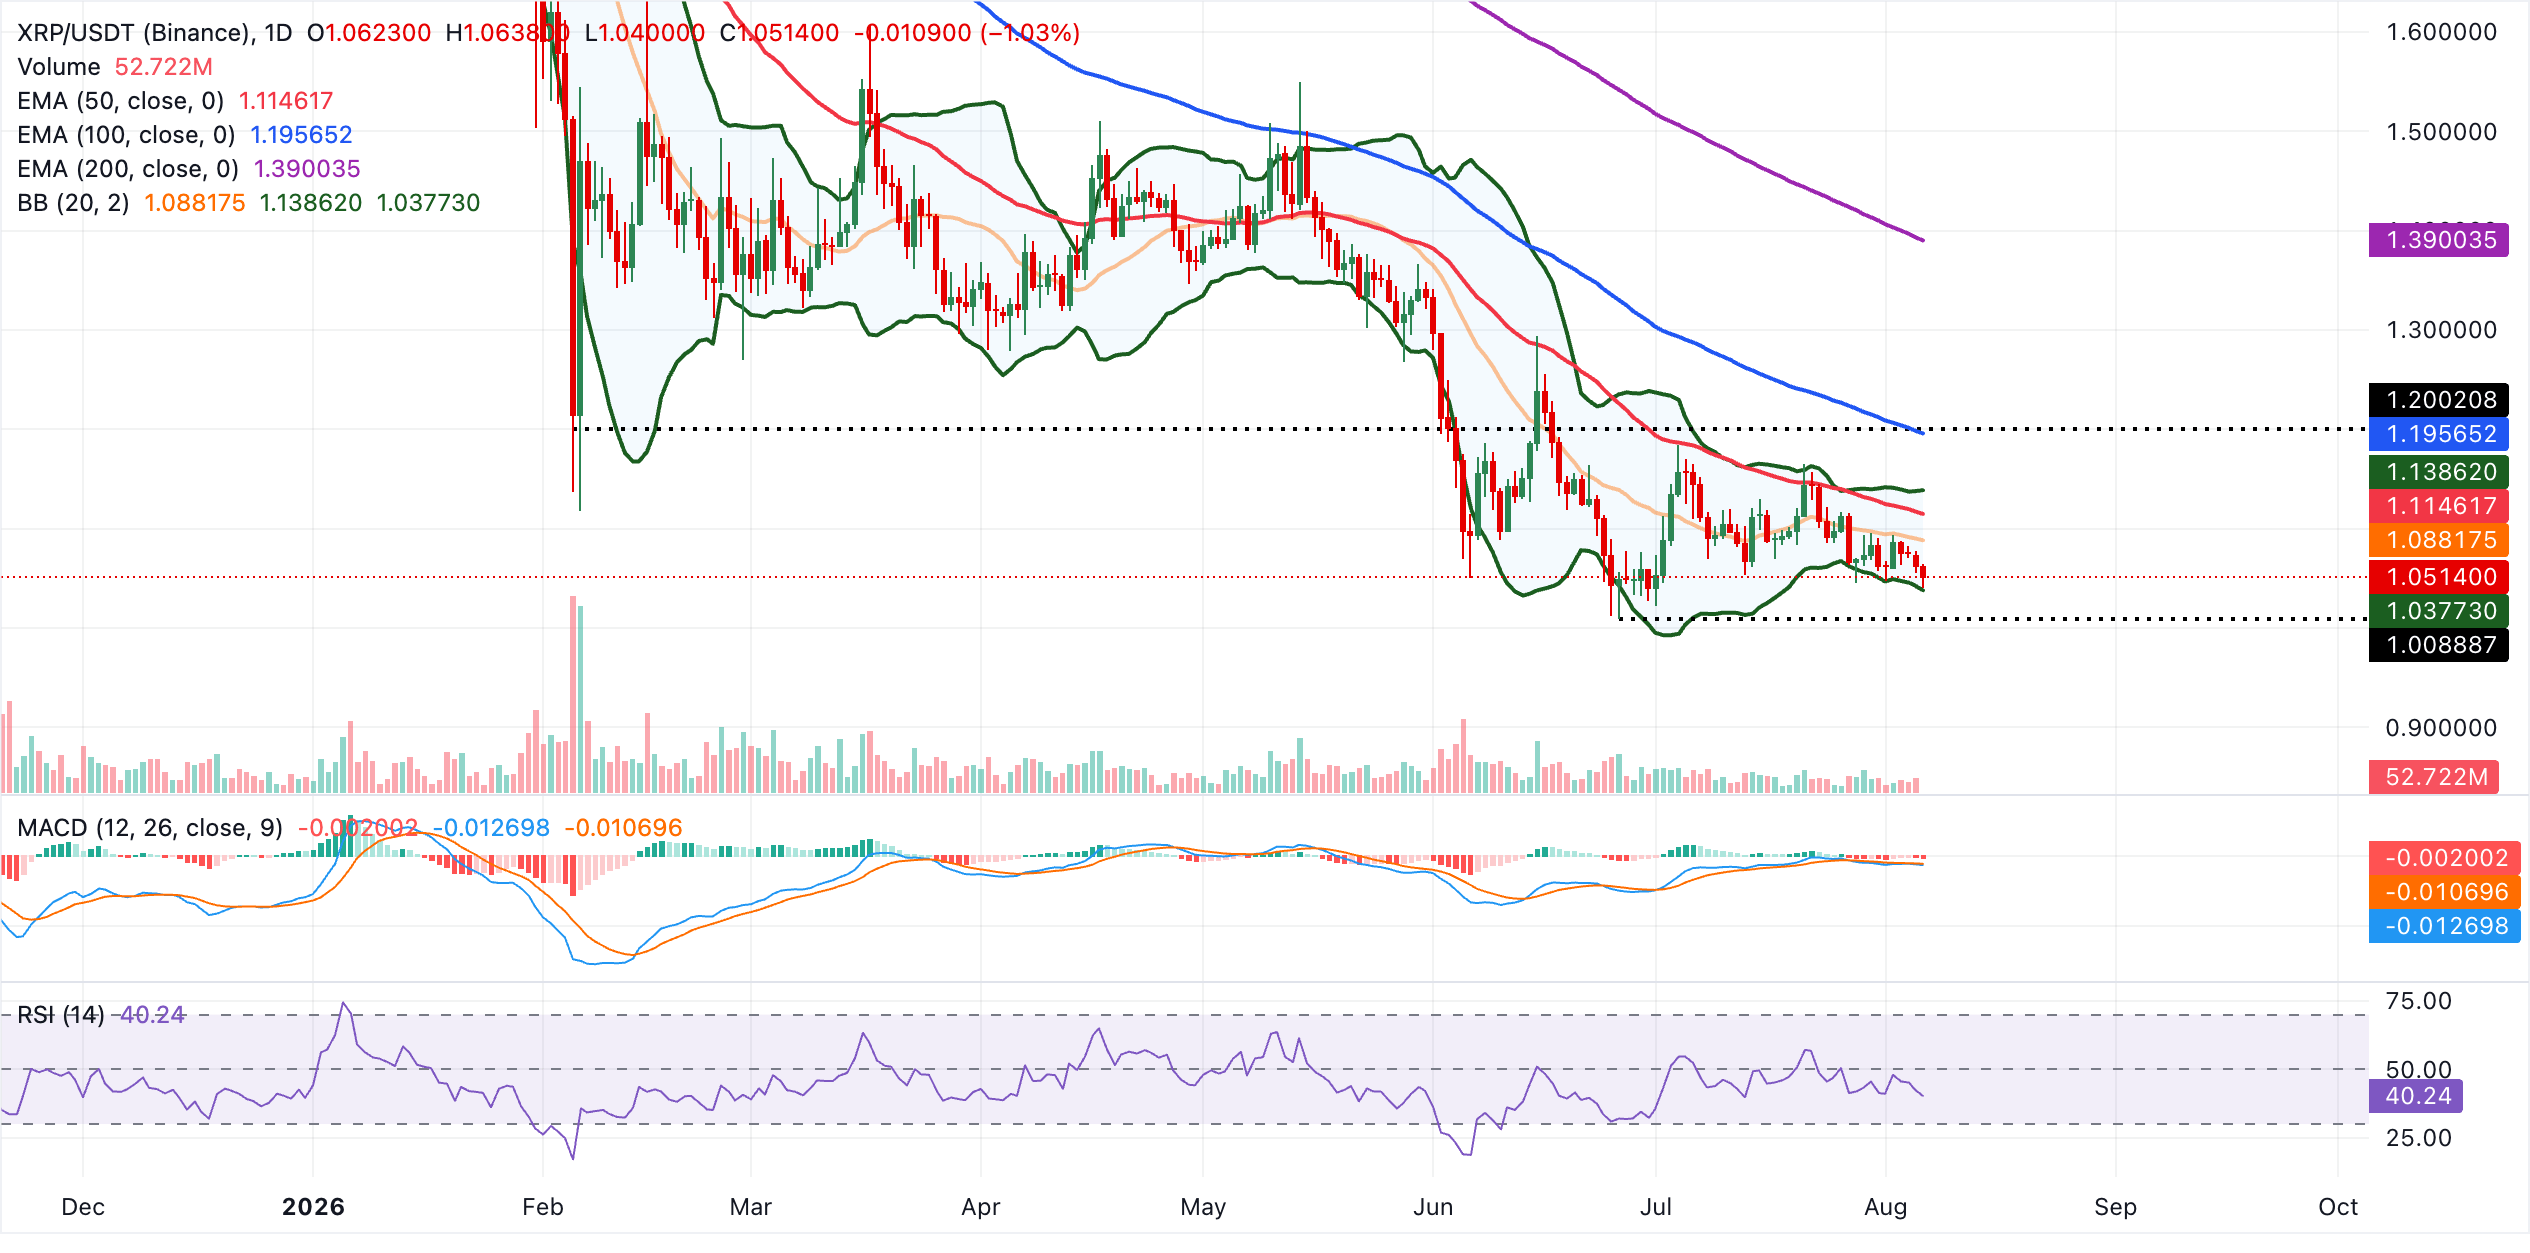
On the topside, initial resistance emerges at the Bollinger Band midline around $1.09, with the 50-day EMA at $1.11 reinforcing a nearby supply zone before stronger caps align at the 100-day EMA near $1.20 and the 200-day EMA around $1.39. On the downside, the lower Bollinger Band at approximately $1.04 acts as immediate support. A clear break under this level would open the door to further weakness as sellers retain control below the stacked daily EMAs.
(The technical analysis of this story was written with the help of an AI tool. Know more.)
Bitcoin, altcoins, stablecoins FAQs
Bitcoin is the largest cryptocurrency by market capitalization, a virtual currency designed to serve as money. This form of payment cannot be controlled by any one person, group, or entity, which eliminates the need for third-party participation during financial transactions.
Altcoins are any cryptocurrency apart from Bitcoin, but some also regard Ethereum as a non-altcoin because it is from these two cryptocurrencies that forking happens. If this is true, then Litecoin is the first altcoin, forked from the Bitcoin protocol and, therefore, an “improved” version of it.
Stablecoins are cryptocurrencies designed to have a stable price, with their value backed by a reserve of the asset it represents. To achieve this, the value of any one stablecoin is pegged to a commodity or financial instrument, such as the US Dollar (USD), with its supply regulated by an algorithm or demand. The main goal of stablecoins is to provide an on/off-ramp for investors willing to trade and invest in cryptocurrencies. Stablecoins also allow investors to store value since cryptocurrencies, in general, are subject to volatility.
Bitcoin dominance is the ratio of Bitcoin's market capitalization to the total market capitalization of all cryptocurrencies combined. It provides a clear picture of Bitcoin’s interest among investors. A high BTC dominance typically happens before and during a bull run, in which investors resort to investing in relatively stable and high market capitalization cryptocurrency like Bitcoin. A drop in BTC dominance usually means that investors are moving their capital and/or profits to altcoins in a quest for higher returns, which usually triggers an explosion of altcoin rallies.
Bài viết đề xuất


