


Crypto Market Overview: US Fed rate hike fears weigh on Bitcoin – TAO, ADA sustain gains
- Bitcoin holds steady above $63,000 on Wednesday amid rising fears of a US Fed rate hike.
- Bittensor extends gains on Wednesday, advancing roughly 4% from the previous day.
- Cardano hovers above $0.1600, following a 4% rebound the previous day.
The broader cryptocurrency market maintains risk-off sentiment ahead of the US Federal Reserve (Fed) interest rate decision on Wednesday. Bitcoin (BTC) holds above $63,000 on Wednesday, while Bittensor (TAO) and Cardano (ADA) sustain gains from the previous day.
US Fed rate decision raises concerns in the crypto market
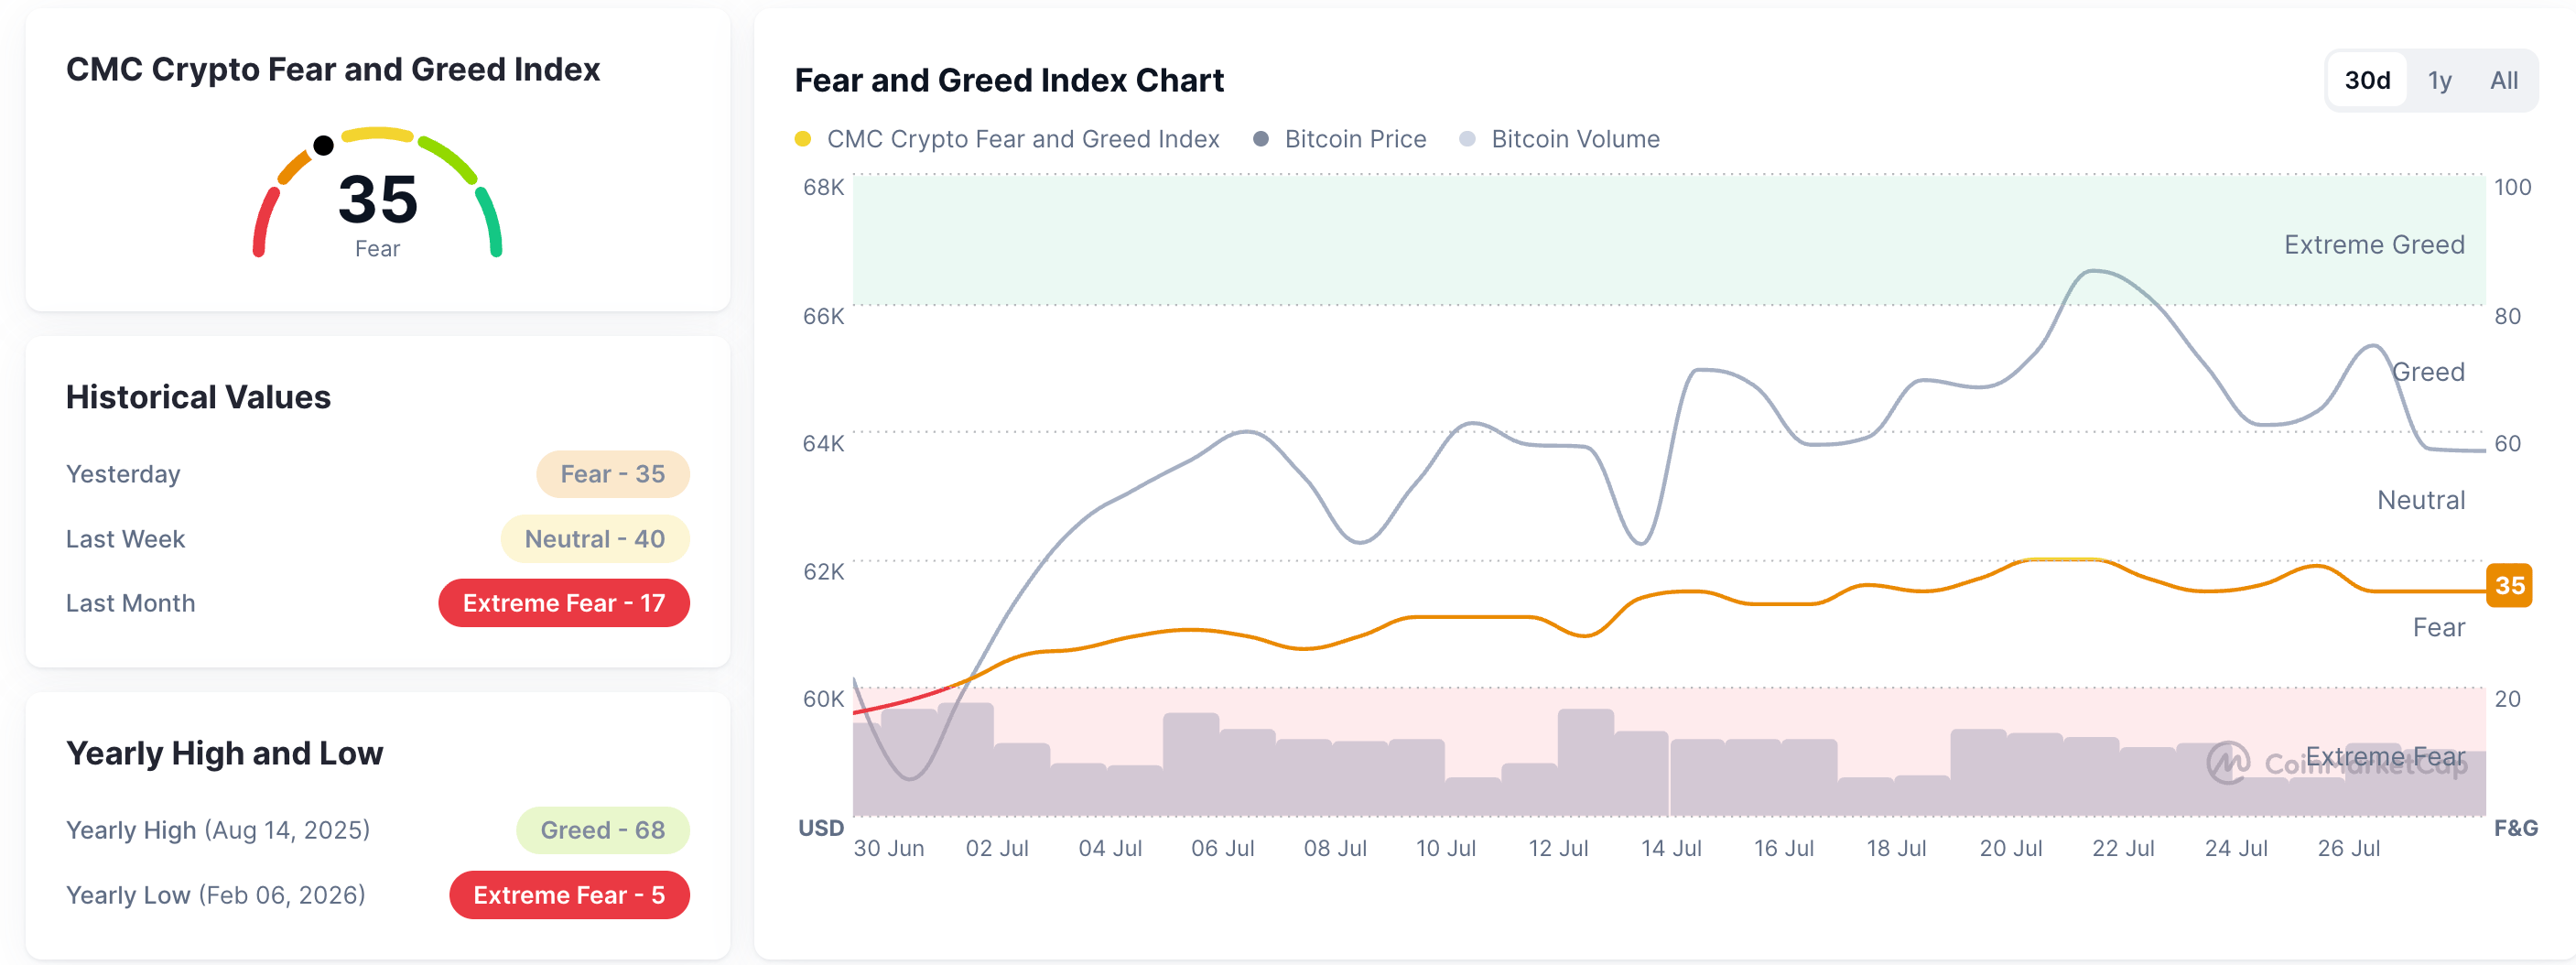
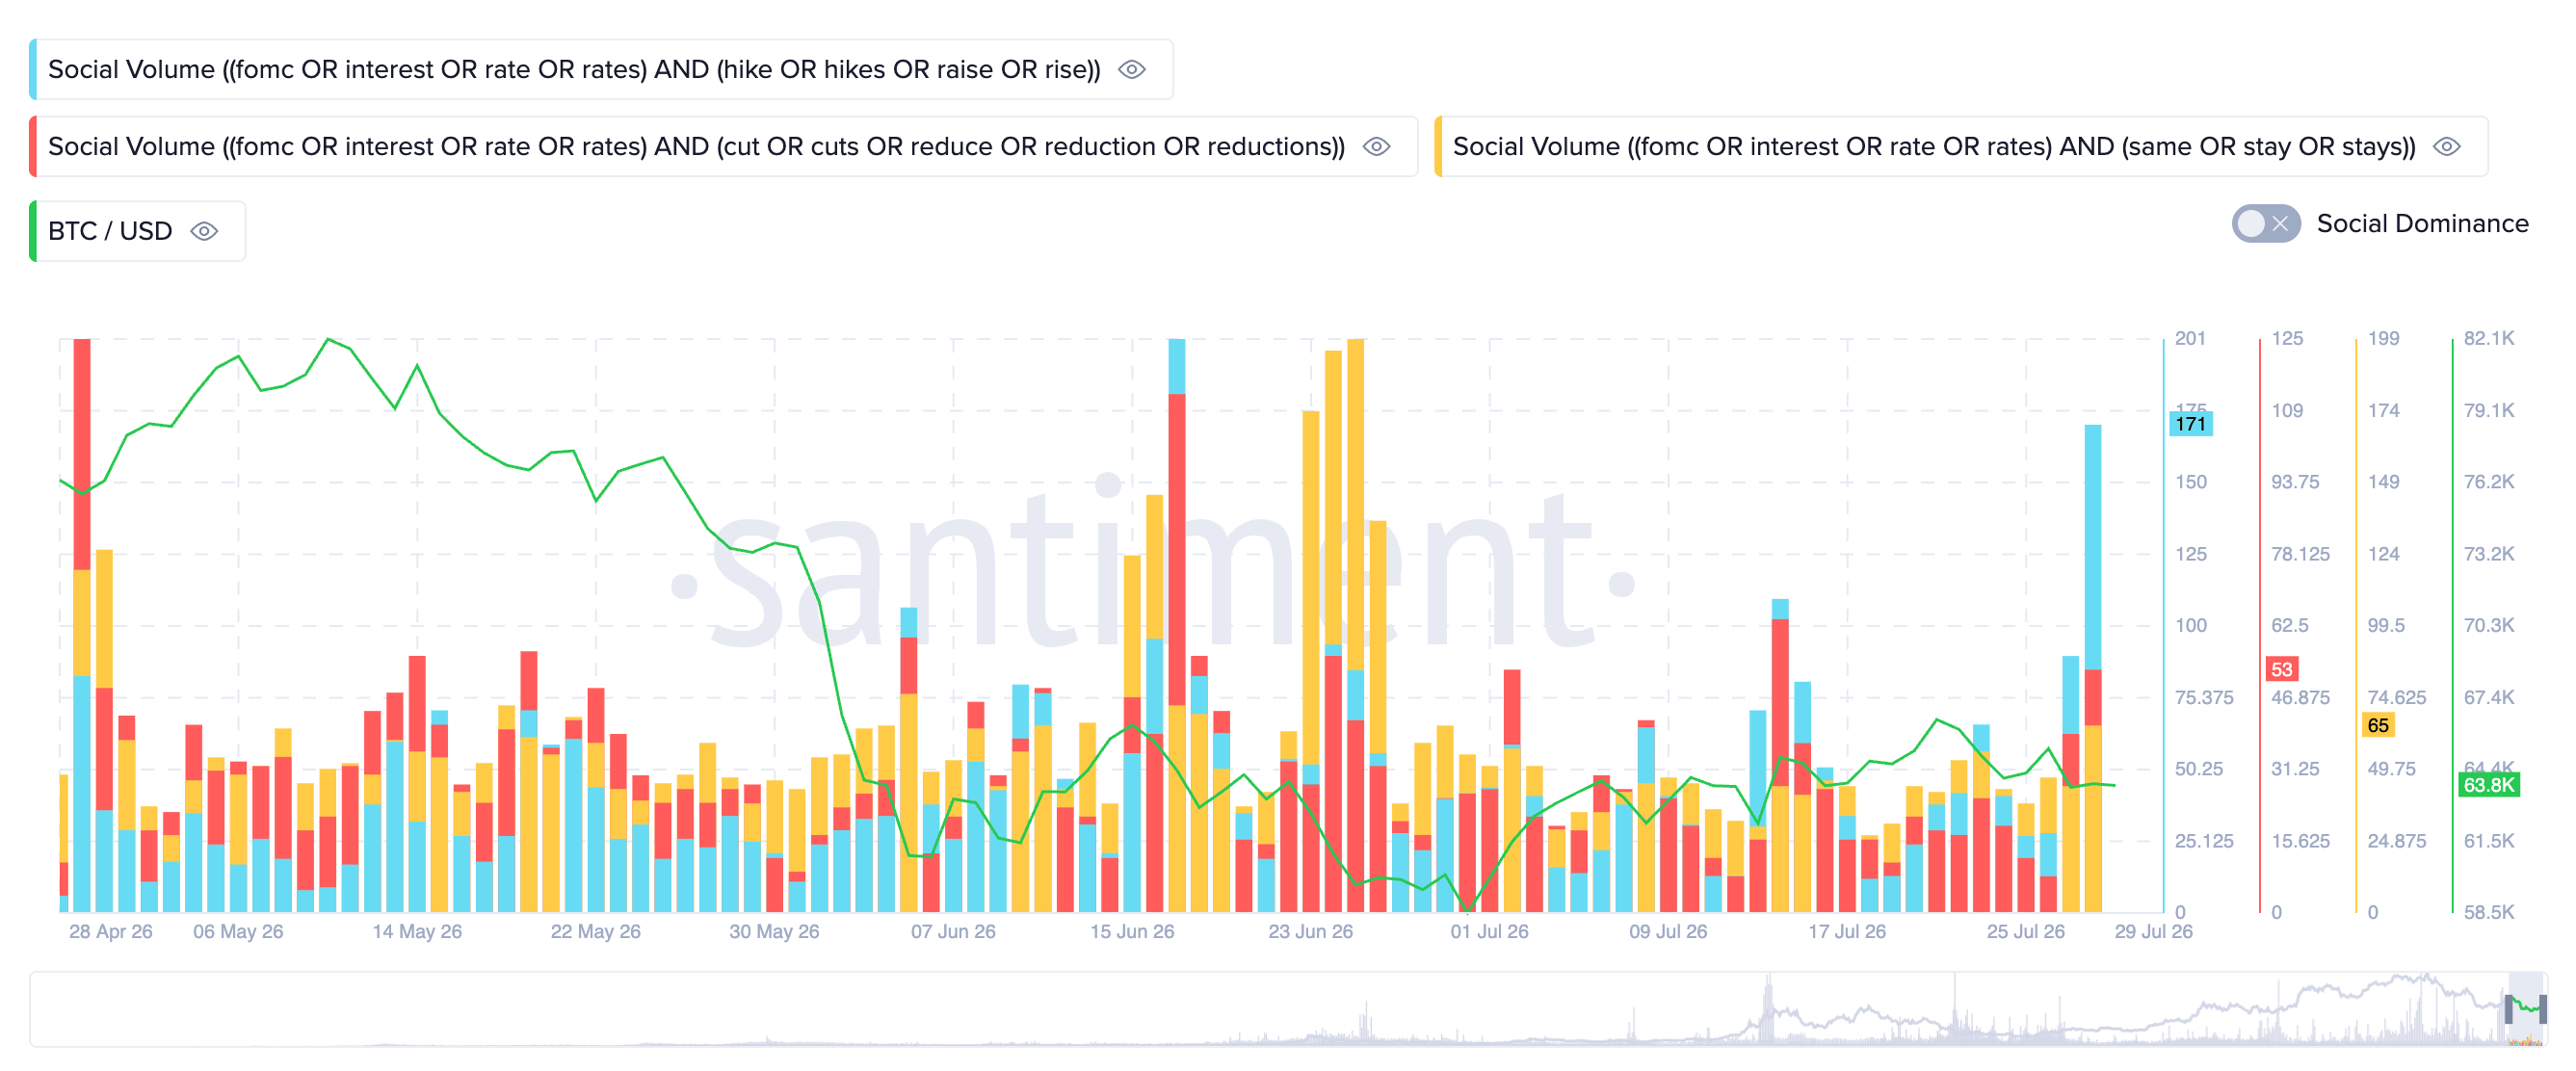
CoinMarketCap’s Fear and Greed Index is at 35, stabilizing after reversing from the neutral zone boundary at 40 on Sunday. This suggests market sentiment is slipping toward a risk-off stance. Santiment data reaffirms fears linked to the US Fed rate decision on Wednesday at 2:00 PM Eastern Time, with social volume of a rate hike reaching 171, while the rate cuts or stays the same are down to 53 and 65, respectively.
Taken together, crypto market sentiment is bearish, anticipating a potential rate hike on Wednesday that could reduce liquidity in high-risk assets.
Technical outlook: Will Bitcoin avoid a steeper correction?
Bitcoin keeps a bearish near-term tone as price holds below the 50-day Exponential Moving Average (EMA) at roughly $64,950 and well under the 200-day EMA near $74,211. This configuration suggests the broader trend remains pressured, with momentum subdued.
The Relative Strength Index (RSI) at 48 hovers near the neutral midline, and the Moving Average Convergence Divergence (MACD) shows a downward slope after crossing below its signal line, hinting at lingering downside bias.
On the topside, initial resistance is defined by the 50-day EMA around $64,950, and a stronger cap emerges at the 200-day EMA near $74,211, ahead of the prior uptrend-line break region around $76,971, where sellers would likely regroup on any sharp rebound.
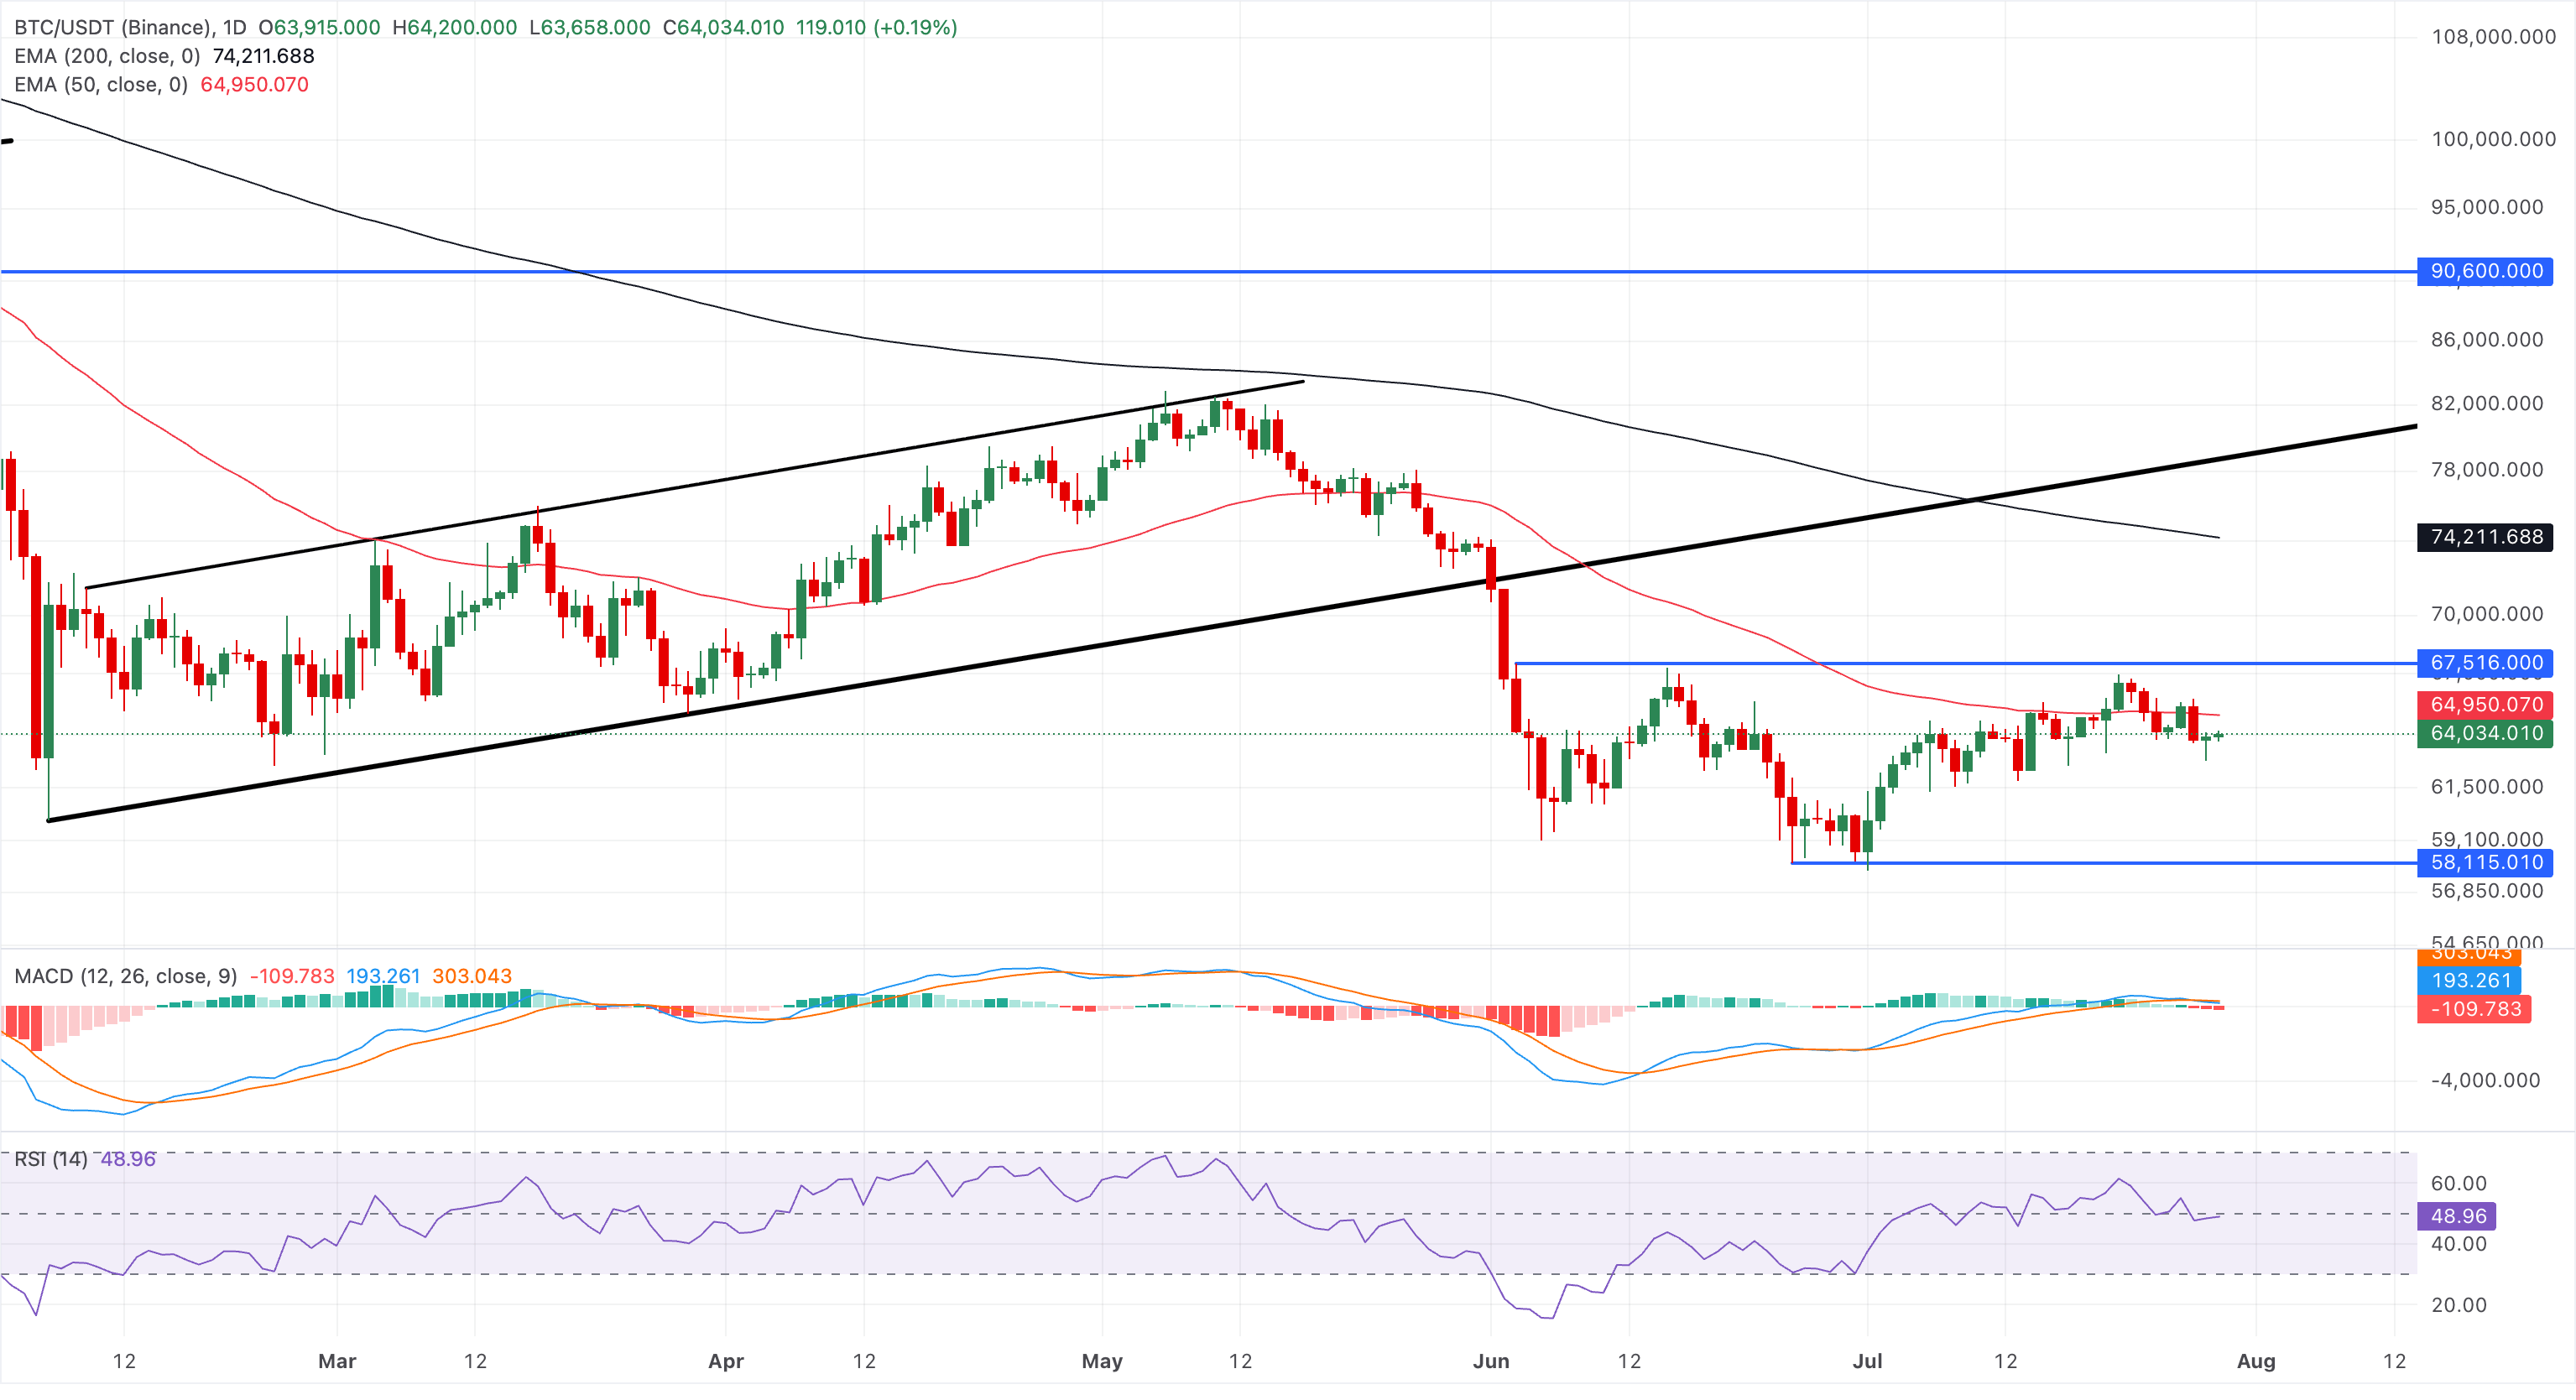
With no nearby structural supports, a steeper correction in Bitcoin could test the $60,000 mark.
Technical outlook: Bittensor and Cardano show mild recovery
Cardano maintains a bearish near-term tone as price remains below the 50- and 200-day EMAs at roughly $0.1738 and $0.2665. The pair also remains under the descending resistance trend line projected around the $0.1754 break area, underscoring persistent topside supply.
The MACD crosses marginally below its signal line while the RSI at 46 hovers below the midline, hinting at waning momentum rather than a sustained recovery.
Initial resistance is seen at the 50-day EMA near $0.1738, reinforced by the descending trendline around $0.1754. A daily close above this cluster would be needed to ease immediate downside pressure.
On the downside, the next notable technical floor does not emerge until the June 25 low at $0.1382, leaving the pair vulnerable to further weakness if sellers regain control below recent lows.
TAO trades below $200 on Wednesday, maintaining a bearish near-term bias as price remains below a descending resistance line near $200. The AI token is capped by the 50-day EMA at about $211, reflecting a broader bearish trend.
That said, the MACD holds marginally above the signal line, extending the upward trend, while the RSI at around 46 suggests downside momentum is softening rather than accelerating.
On the topside, initial resistance aligns at the downtrend line around $200, where a daily close above would be needed to ease immediate selling pressure, followed by the 50-day EMA near $211 as a more distant bullish trigger zone.
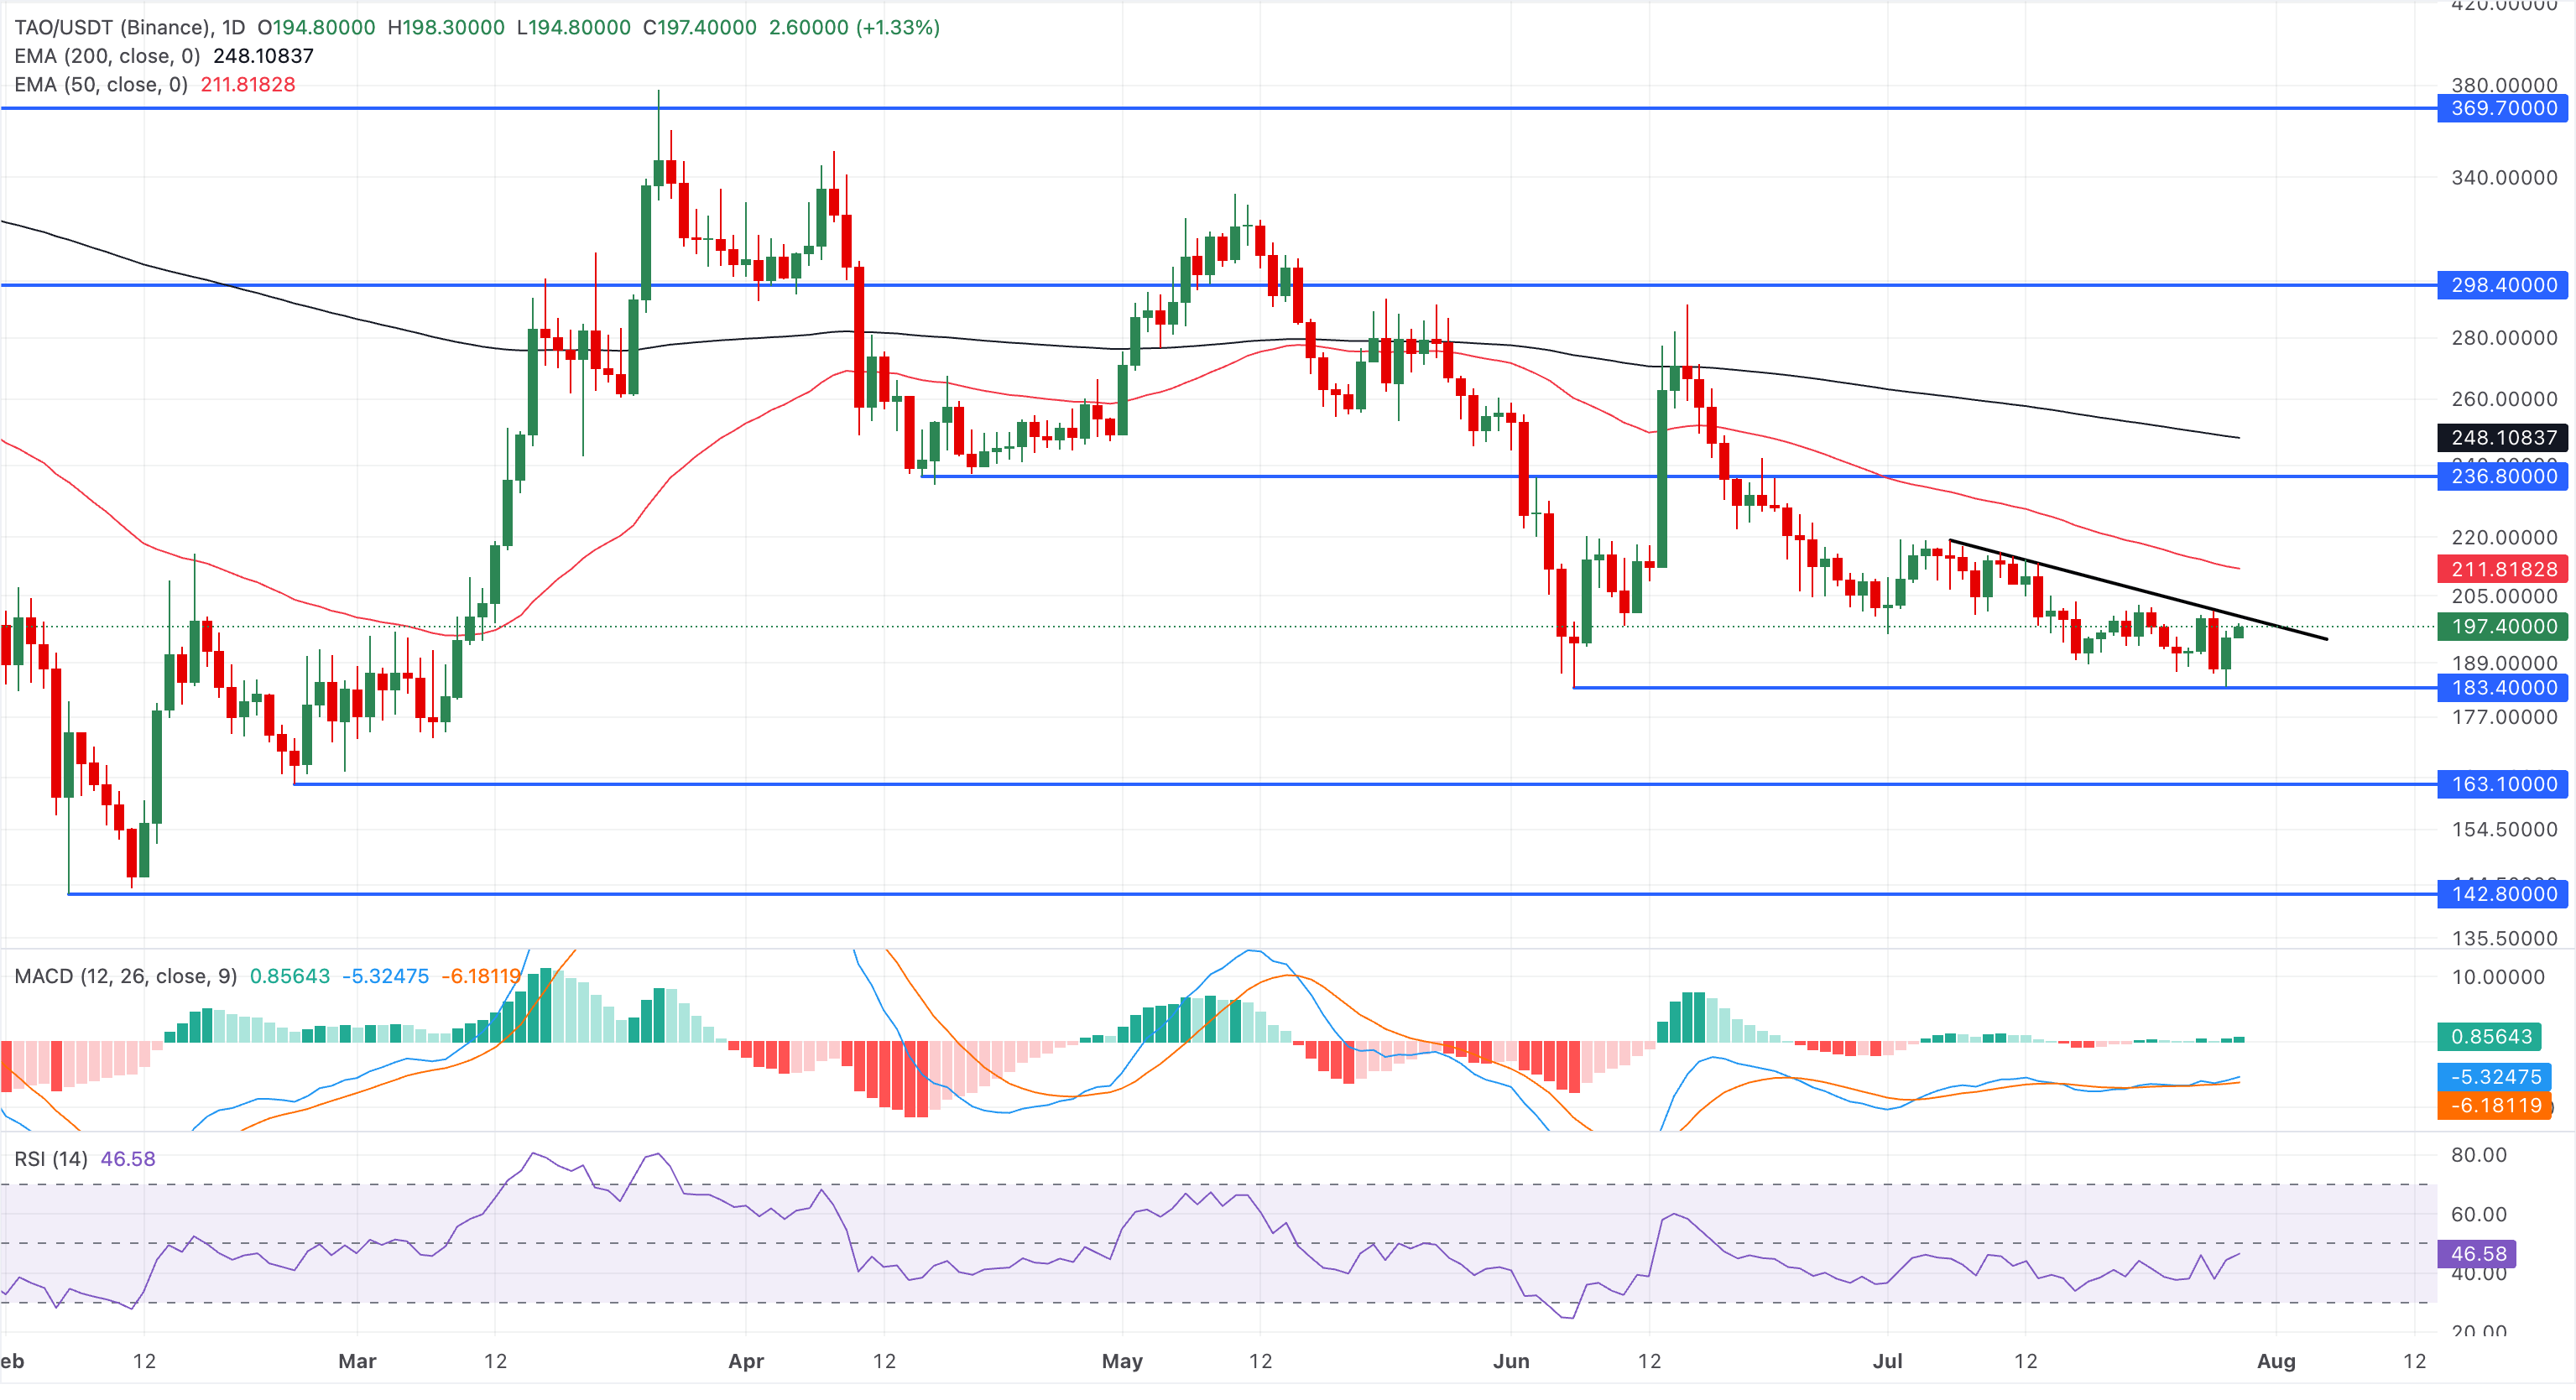
Looking down, the June 6 low at $183 emerges as the key structural support floor.
(The technical analysis of this story was written with the help of an AI tool. Know more.)
Bài viết đề xuất


