


Bitcoin Price Prediction: BTC holds above key support amid ETF inflows, US-Iran bombing pause
- Bitcoin holds above the 200-Week SMA around $63,500 after posting four consecutive weeks of gains.
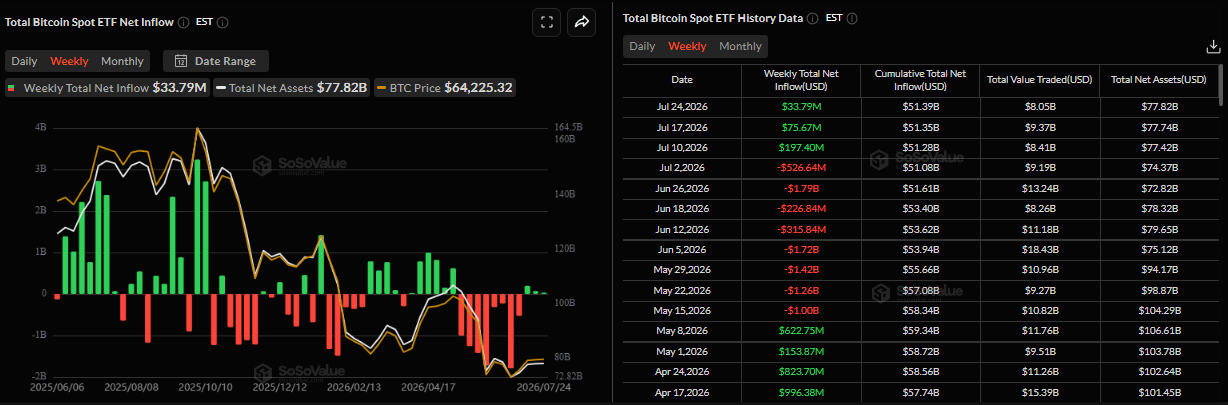
- US-listed spot ETFs recorded mild inflows last week, marking the third consecutive week of gains after heavy withdrawals.
- The US-Iran pause their strikes, which adds to hopes for diplomatic negotiations and improves risk appetite.
Bitcoin (BTC) holds above the key 200-week Simple Moving Average (SMA) around $63,500, having posted four consecutive weeks of gains. Institutional demand shows mild signs of improvement with spot Exchange Traded Funds (ETFs) posting inflows for a third consecutive week. The halt in US-Iran strikes has renewed hopes for diplomatic negotiations, improving modest risk appetite and supporting the Crypto King’s recovery.
US-Iran pause strikes, lifting risk sentiment
US paused its two-week bombing campaign against Iran late on Friday, prompting Tehran to suspend its retaliatory attacks against Washington’s allies in the Middle East for a second night.
On Sunday, Iran said it will halt its own attacks as long as the US does the same, a senior Iranian official reported to Reuters.
On the same day, US Ambassador to the United Nations Mike Waltz said that while forces remained locked and loaded, President Donald Trump wanted to give negotiations another chance.
“He’s giving talks some space; he’s giving it a little bit of room,” Waltz said, without providing further details.
These easing geopolitical conditions and renewed hopes for diplomatic negotiations have improved risk appetite, providing a mild tailwind for risky assets such as BTC.
Institutional demand shows mild signs of improvement
Institutional demand reflects mild signs of strength. SoSoValue data show that spot BTC ETFs recorded an inflow of $33.79 million last week, marking the third week of steady inflows.
These positive flows suggest institutional investors are gradually returning to the market; however, the magnitude remains modest compared with the heavy outflows recorded from mid-May to early July. If the inflow trend continues and strengthens this week, BTC could see recovery ahead.
Bitcoin Price Prediction: Key EMAs hold strong
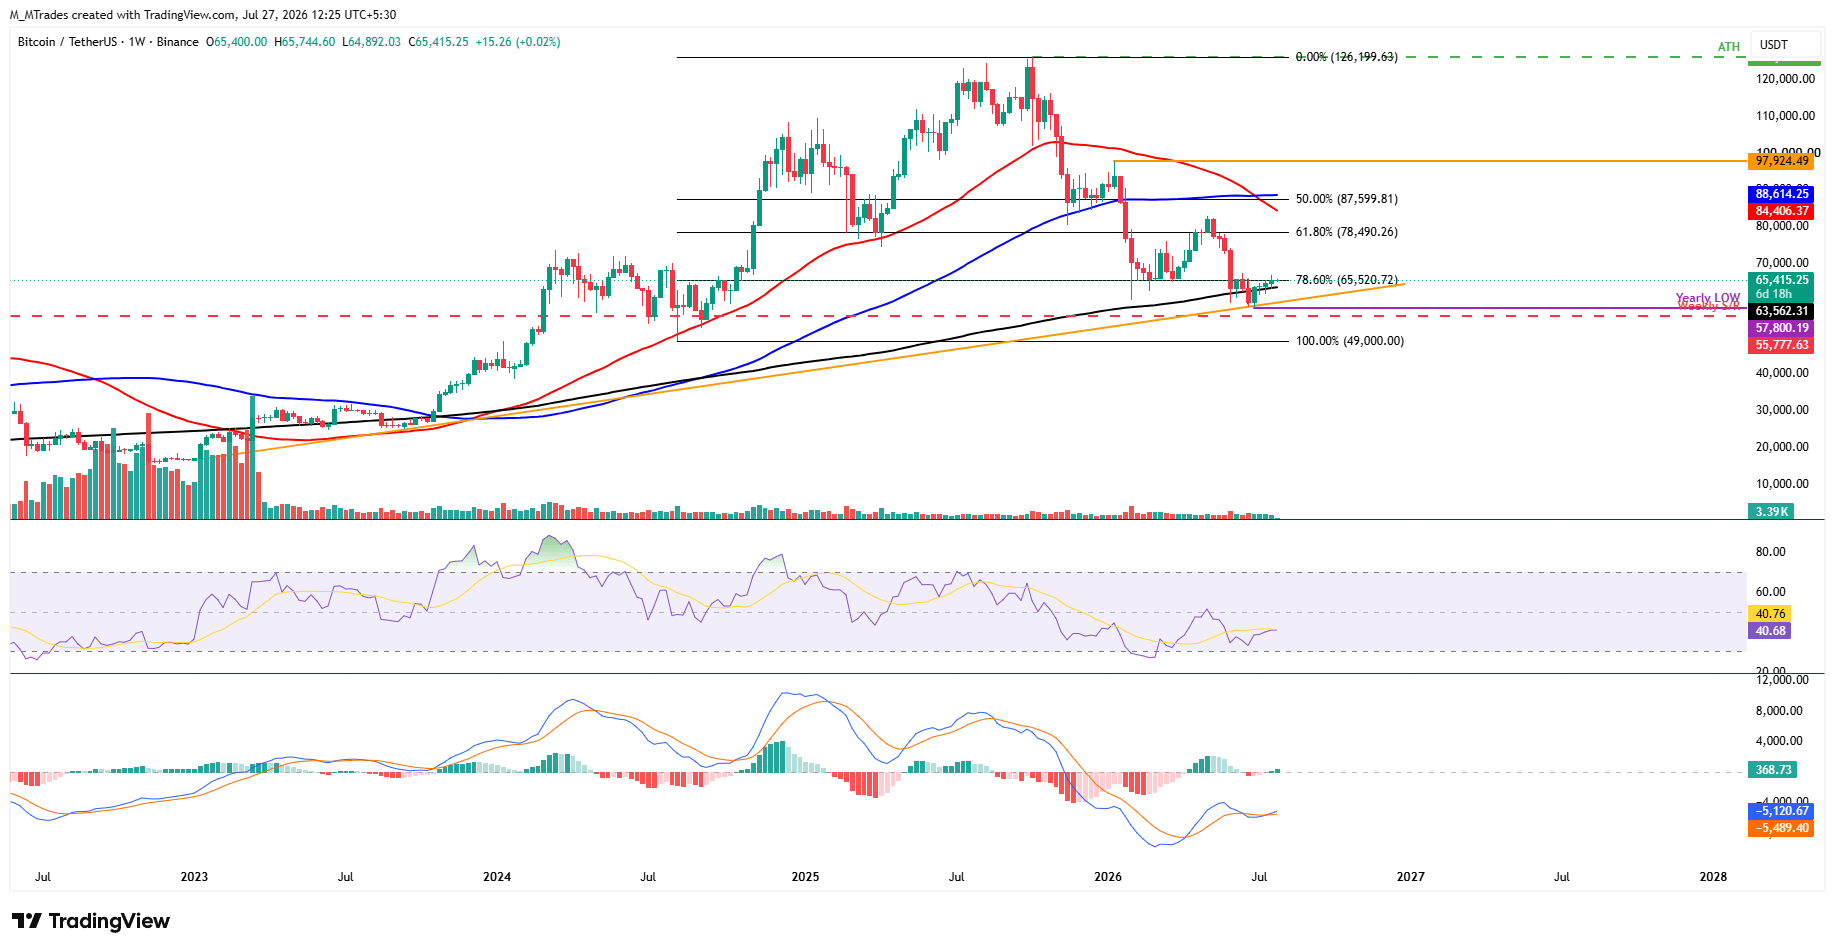
Bitcoin recovered slightly, over 1% last week, marking the fourth consecutive week of gains since the end of June. BTC is holding strong above the 200-week Simple Moving Average (SMA) at $63,561 and trades above $65,300 on Monday.
If the Crypto King holds above the 200-day SMA at $63,561 and closes above the immediate resistance at the 78.60% Fibonacci retracement level at $65,520 (drawn from the August 2024 low of $49,000 to the October 2025 record high at $126,199), then BTC could extend the recovery toward the 61.80% Fibonacci retracement level at $78,490.
Momentum indicators on the weekly chart show mild signs of fading bearish sentiment: the Relative Strength Index (RSI) is trending higher toward the neutral 50 level, with a reading of 40 on Monday. Meanwhile, the Moving Average Convergence Divergence (MACD) flipped to a bullish crossover last week, supporting a positive outlook.
However, if BTC fails to find support around the 200-day SMA at $63,561 and closes below it on a weekly basis, it could extend the losses toward the ascending trendline support, roughly around $59,500.
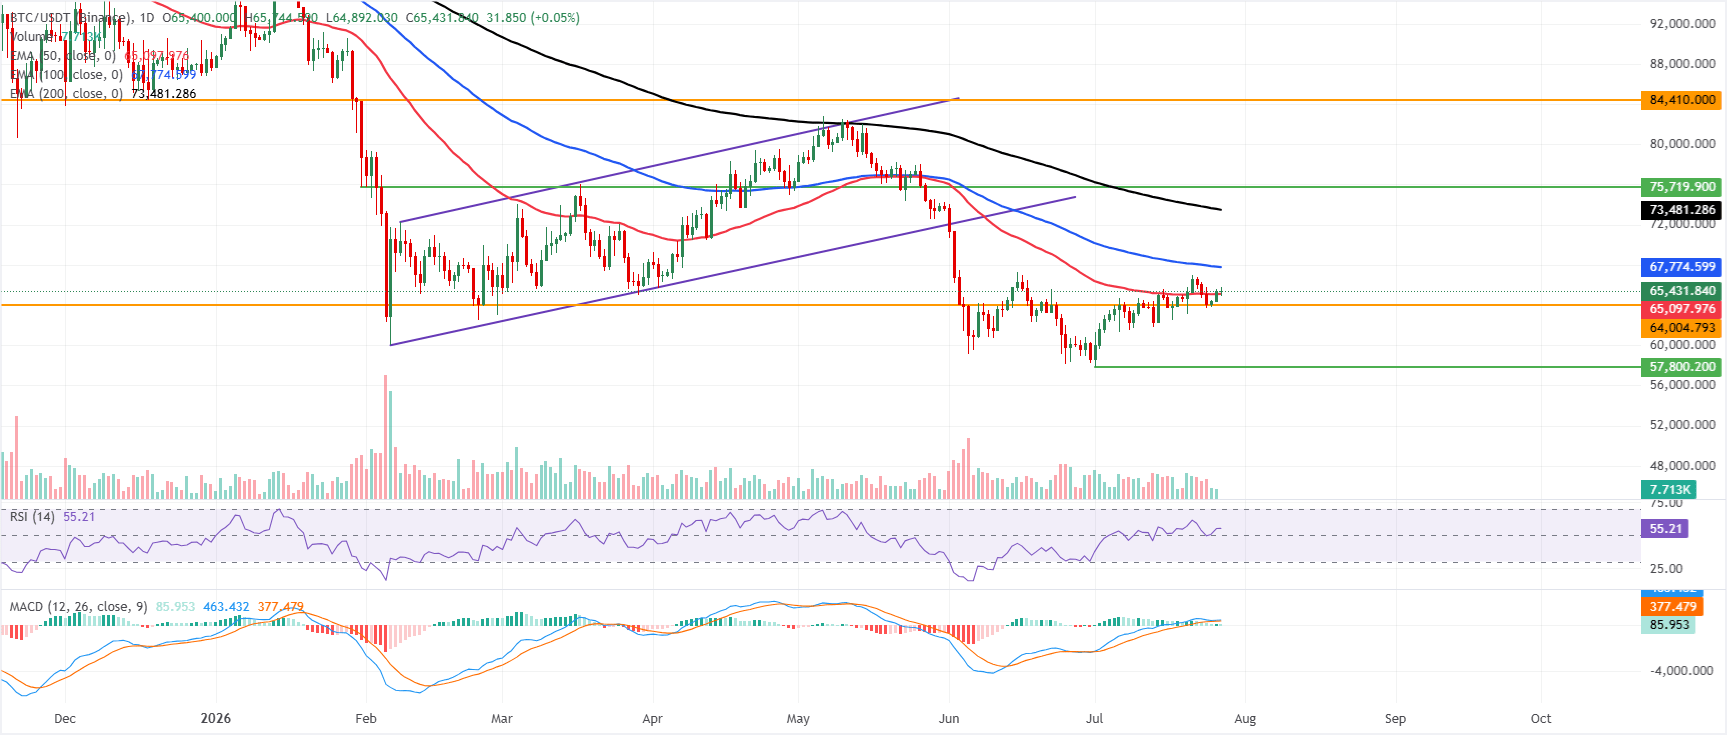
On the daily chart, BTC is holding a neutral-to-bullish bias, trading above the 50-day Exponential Moving Average (EMA) at $65,097 while remaining capped by the higher EMAs. The Crypto King has reclaimed short-term trend support after recent volatility, and the daily RSI around 55 suggests moderate buying pressure without overbought conditions. The MACD histogram stays in positive territory but has been losing altitude, hinting that upside momentum is constructive yet not aggressive.
On the topside, initial resistance emerges at the 100-day EMA near $67,774, with the 200-day EMA around $73,481 acting as a more strategic barrier before a major horizontal cap at $84,410.
On the downside, immediate support comes from the 50-day EMA at $65,097, while a break below that level would expose the next key floor at the horizontal level of $64,004, where dip-buying interest could be tested.
(The technical analysis of this story was written with the help of an AI tool. Know more.)
Bitcoin, altcoins, stablecoins FAQs
Bitcoin is the largest cryptocurrency by market capitalization, a virtual currency designed to serve as money. This form of payment cannot be controlled by any one person, group, or entity, which eliminates the need for third-party participation during financial transactions.
Altcoins are any cryptocurrency apart from Bitcoin, but some also regard Ethereum as a non-altcoin because it is from these two cryptocurrencies that forking happens. If this is true, then Litecoin is the first altcoin, forked from the Bitcoin protocol and, therefore, an “improved” version of it.
Stablecoins are cryptocurrencies designed to have a stable price, with their value backed by a reserve of the asset it represents. To achieve this, the value of any one stablecoin is pegged to a commodity or financial instrument, such as the US Dollar (USD), with its supply regulated by an algorithm or demand. The main goal of stablecoins is to provide an on/off-ramp for investors willing to trade and invest in cryptocurrencies. Stablecoins also allow investors to store value since cryptocurrencies, in general, are subject to volatility.
Bitcoin dominance is the ratio of Bitcoin's market capitalization to the total market capitalization of all cryptocurrencies combined. It provides a clear picture of Bitcoin’s interest among investors. A high BTC dominance typically happens before and during a bull run, in which investors resort to investing in relatively stable and high market capitalization cryptocurrency like Bitcoin. A drop in BTC dominance usually means that investors are moving their capital and/or profits to altcoins in a quest for higher returns, which usually triggers an explosion of altcoin rallies.
Bài viết đề xuất


