

Cardano Price Forecast: Short-term recovery lacks retail support

Nguồn Fxstreet
  • Cardano edges lower on Wednesday, capped below its 50-day EMA at $0.1770.
  • Cardano derivatives data point to easing retail demand with contracting trading volume and Open Interest.
  • The technical outlook for ADA shows a bearish bias, as price remains capped below a key resistance trendline.

Cardano (ADA) price edges lower on Wednesday after the 50-day Exponential Moving Average (EMA) at $1.770 capped two consecutive days of recovery seen earlier this week. ADA futures point to waning retail traction as Open Interest and trading volume decline amid elevated long liquidations. The technical outlook for ADA is bearish, as momentum remains subdued below a resistance trendline near $0.1782. 

Demand wanes in Cardano futures 

Cardano derivatives market witnesses a decline in retail activity and conviction. CoinGlass data show that ADA futures Open Interest (OI) is down 7% over the last 24 hours to $402.74 million, with trading volume down 41% to $352.30 million. Typically, a decline in volume and OI suggests easing retail interest.

At the same time, long liquidations of $241,350 outpace short liquidations of $175,480, indicating a sell-side dominance. Meanwhile, the positive funding rate of 0.0044%, down from a peak of 0.0088% the previous day, reaffirms easing bullish sentiment among traders.
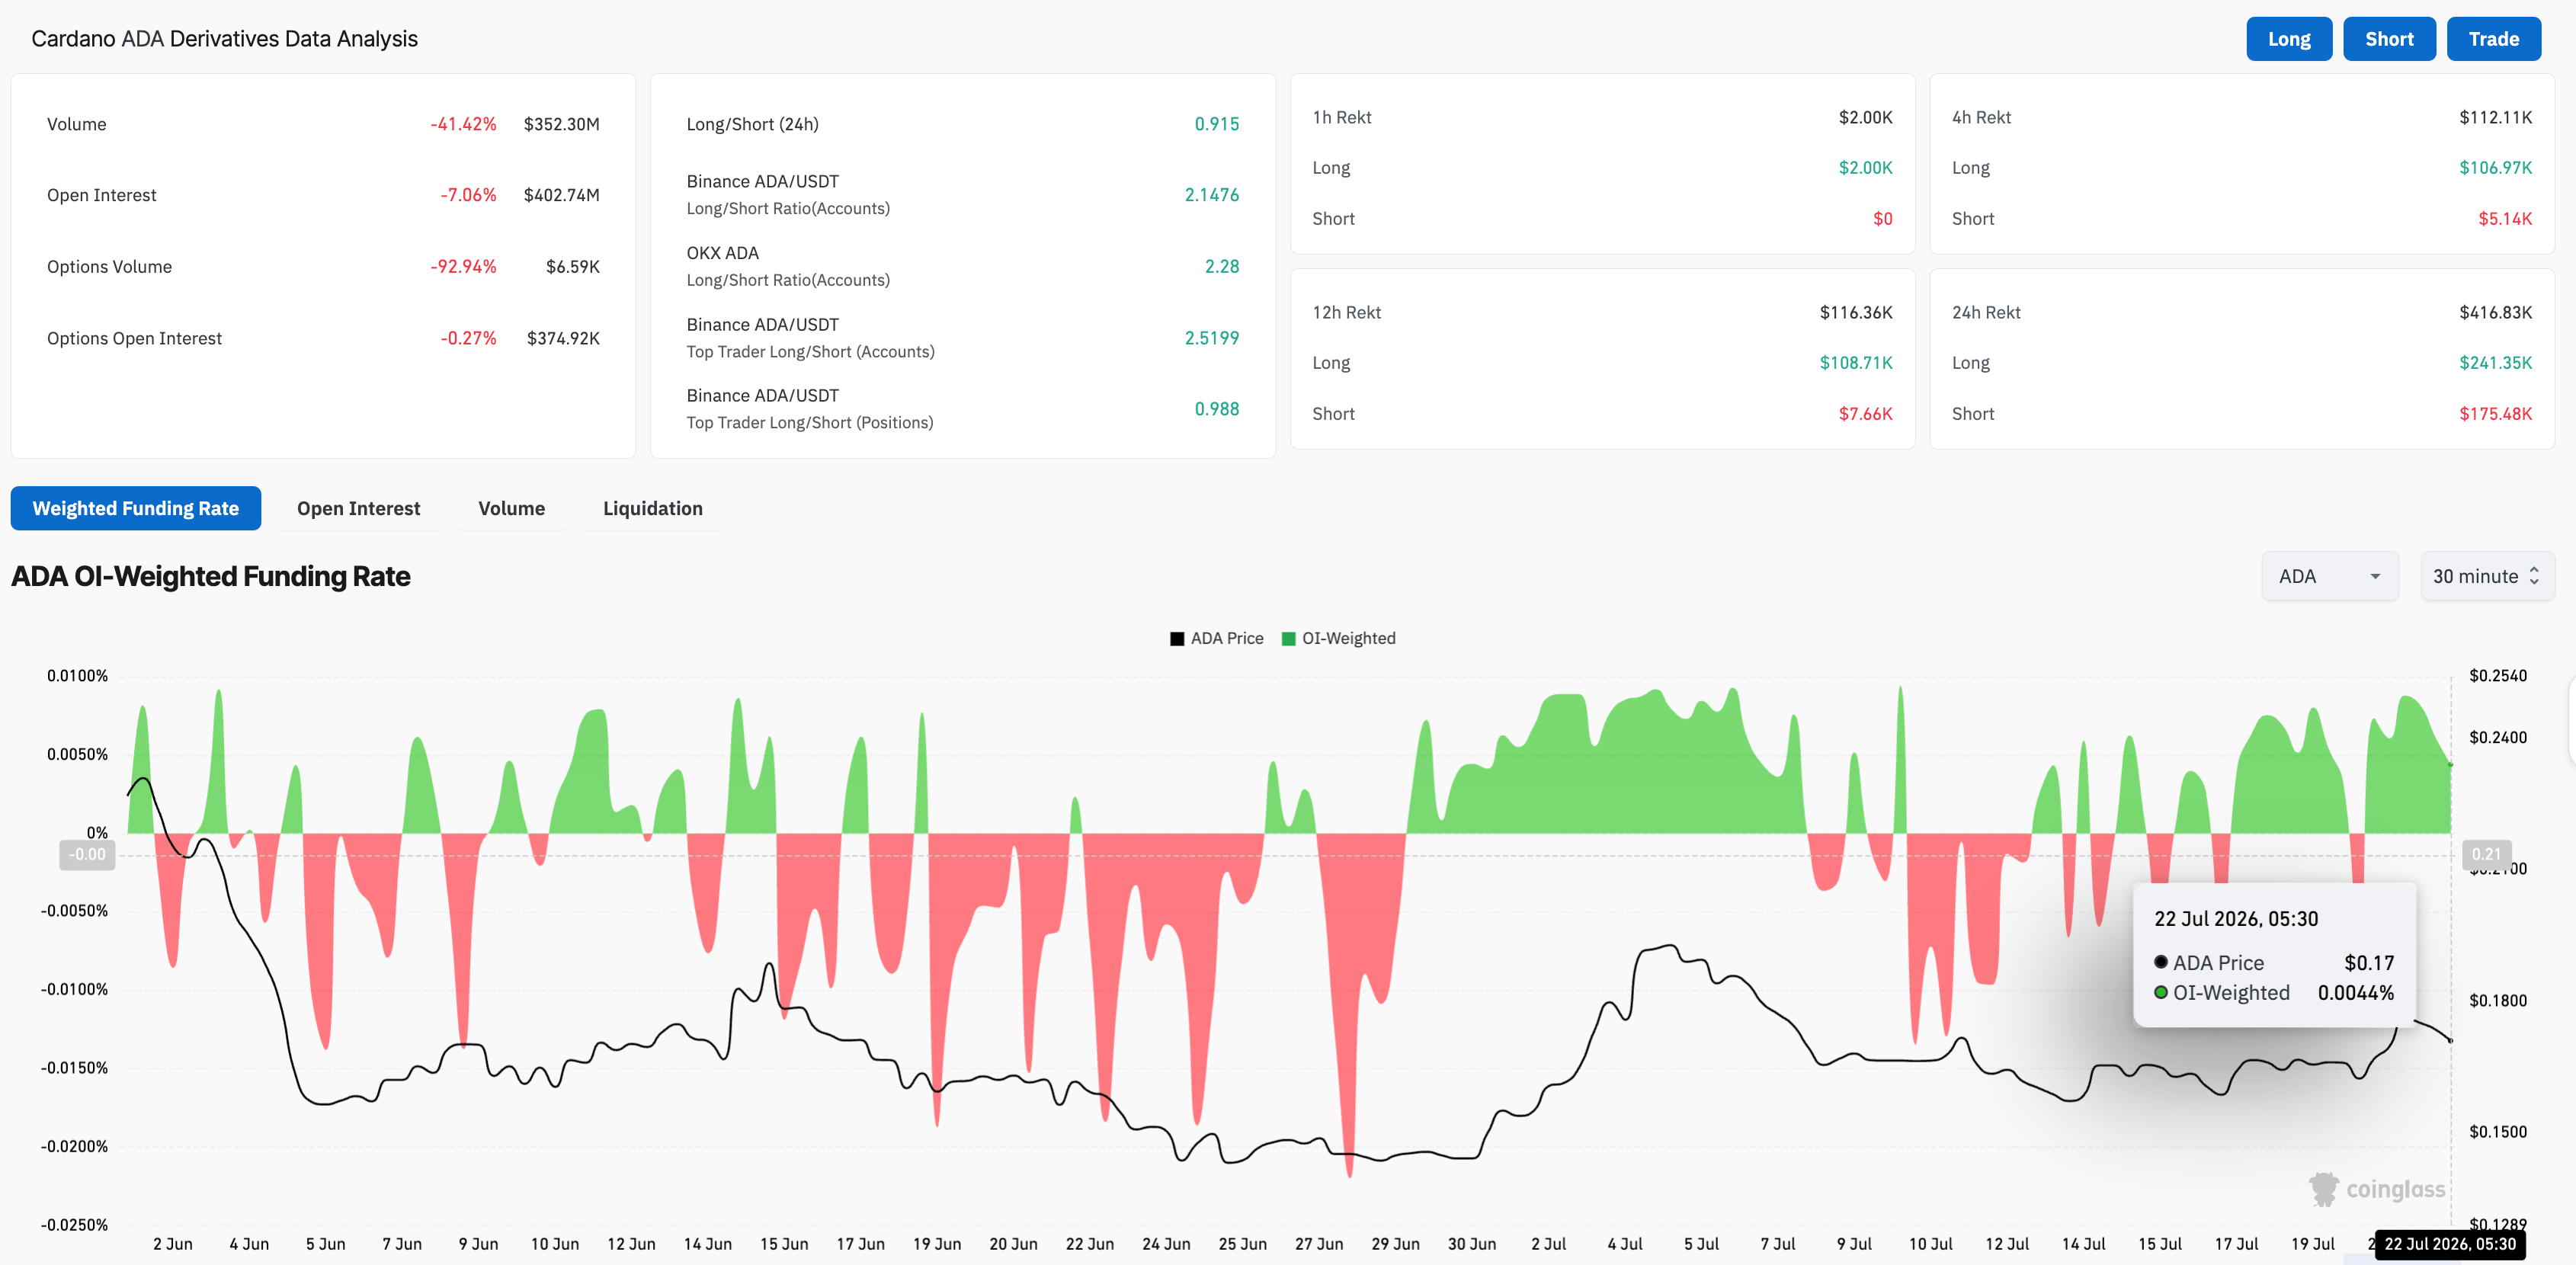
ADA derivatives data. Source: CoinGlass

Could Cardano sustain its bullish momentum?

Cardano edges lower on Wednesday, capped under the 50-day EMA at $0.1770 and well below the 200-day EMA at $0.2858. The downward resistance trendline, near the 50-day EMA at $0.1782, reinforces the overhead supply cluster, while the upward support trendline break level at $0.1629 underpins the recent higher lows.

The Moving Average Convergence Divergence (MACD) histogram stays marginally positive, hinting at mildly constructive momentum, but the Relative Strength Index (RSI) around 52 suggests only neutral directional pressure, leaving the broader bias constrained by the dominant resistance band.

On the topside, immediate resistance is seen at the 50-day EMA at $0.1771, followed by the downward resistance trend line reference at $0.1782. A sustained move above this zone would be needed to ease the current bearish cap and open the way toward the more distant $0.2205 horizontal level.

Chart Analysis ADA/USDT (Binance)
ADA/USDT daily price chart.

On the downside, first support aligns with the upward-trending structural level at $0.1629, while a deeper pullback would expose the horizontal support area near $0.1486, where buyers are likely to defend a broader range floor.

(The technical analysis of this story was written with the help of an AI tool. Know more.)

Tuyên bố miễn trừ trách nhiệm: Chỉ dành cho mục đích thông tin. Hiệu suất trong quá khứ không đảm bảo cho kết quả trong tương lai.
placeholder
Đồng yên Nhật dao động gần mức thấp nhất trong nhiều tháng so với USD giữa những lo ngại về tài chính và sự không chắc chắn của BoJĐồng yên Nhật (JPY) dao động trong một khoảng giá trong phiên giao dịch châu Á vào thứ Tư và vẫn gần mức thấp nhất kể từ cuối tháng Hai, đã chạm vào đô la Mỹ (USD) vào ngày hôm trước
Tác giả  FXStreet
ngày19 tháng 11 năm 2025
Đồng yên Nhật (JPY) dao động trong một khoảng giá trong phiên giao dịch châu Á vào thứ Tư và vẫn gần mức thấp nhất kể từ cuối tháng Hai, đã chạm vào đô la Mỹ (USD) vào ngày hôm trước
placeholder
Đồng yên Nhật tăng lên mức cao nhất kể từ ngày 18 tháng 2 khi dữ liệu tiền lương khả quan và GDP thúc đẩy kỳ vọng BoJ tăng lãi suấtCặp USD/JPY giảm trong ngày thứ hai liên tiếp – đồng thời đánh dấu ngày giảm thứ tư trong năm ngày qua – và rơi xuống mức thấp nhất kể từ ngày 18 tháng 2, quanh vùng giữa 153,00 trong phiên giao dịch châu Á vào thứ Ba.
Tác giả  FXStreet
9 tháng 08 ngày Thứ Ba
Cặp USD/JPY giảm trong ngày thứ hai liên tiếp – đồng thời đánh dấu ngày giảm thứ tư trong năm ngày qua – và rơi xuống mức thấp nhất kể từ ngày 18 tháng 2, quanh vùng giữa 153,00 trong phiên giao dịch châu Á vào thứ Ba.
placeholder
Xung đột Mỹ - Iran đẩy giá dầu tăng vọt khi WTI vượt 100 USD và Brent tiến sát 110 USD Giá dầu thế giới tiếp tục tăng mạnh trong tuần này. Vào thứ Năm theo giờ Miền Đông, dầu thô WTI (USOIL) đã vượt qua mốc 100 USD/thùng, đóng cửa ở mức 103,94 USD, tăng 7,51%; dầu thô Brent
Tác giả  TradingKey
11 giờ trước
Giá dầu thế giới tiếp tục tăng mạnh trong tuần này. Vào thứ Năm theo giờ Miền Đông, dầu thô WTI (USOIL) đã vượt qua mốc 100 USD/thùng, đóng cửa ở mức 103,94 USD, tăng 7,51%; dầu thô Brent
placeholder
Forex hôm nay: Đồng đô la Mỹ tích luỹ đà tăng khi trọng tâm chuyển sang báo cáo lạm phát quan trọngĐây là những gì bạn cần biết vào thứ Sáu, ngày 11 tháng 9:
Tác giả  FXStreet
4 giờ trước
Đây là những gì bạn cần biết vào thứ Sáu, ngày 11 tháng 9:
placeholder
Dự báo giá vàng: PPI và giá dầu gia tăng lo ngại lạm phát, liệu CPI có thể thay đổi hướng đi của giá vàng?Tính đến phiên giao dịch châu Á ngày 11/9, giá vàng (XAUUSD) hôm nay tiếp tục duy trì trạng thái tích lũy yếu sau khi giảm mạnh xuống gần 4.300 USD vào thứ Năm, với giá giao dịch mới nhất
Tác giả  FXStreet
4 giờ trước
Tính đến phiên giao dịch châu Á ngày 11/9, giá vàng (XAUUSD) hôm nay tiếp tục duy trì trạng thái tích lũy yếu sau khi giảm mạnh xuống gần 4.300 USD vào thứ Năm, với giá giao dịch mới nhất
sản phẩm liên quan
goTop
quote