


Bitcoin Weekly Forecast: Billions in ETF outflows don’t bode well
- Bitcoin edges below $74,000 on Friday and is set to post its third consecutive week of losses.
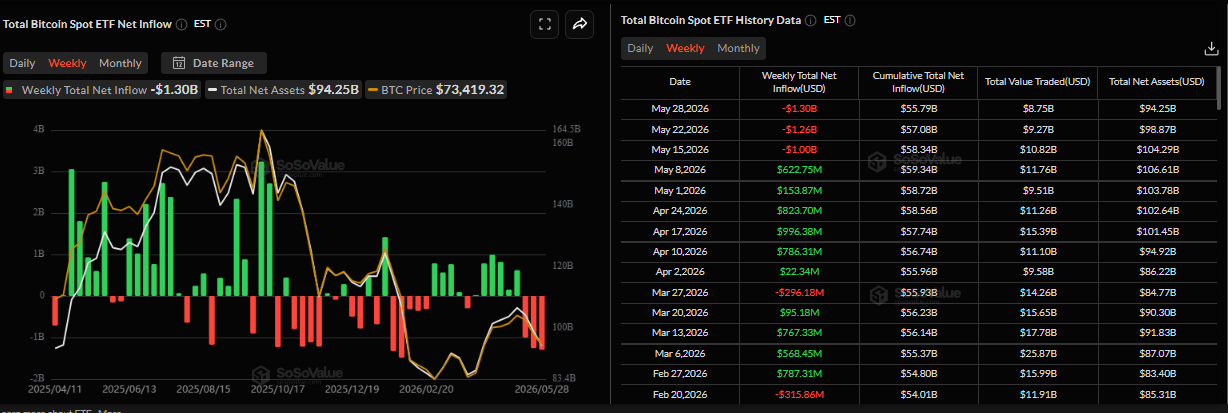
- US-listed spot ETFs recorded outflows of over $1.30 billion through Thursday, marking a third straight week of withdrawals.
- Sticky inflation and macroeconomic headwinds continue to cap Bitcoin’s upside potential.
Bitcoin (BTC) remains under pressure, trading below $74,000 on Friday, and is set to post its third consecutive week of losses. The institutional sell-off continues, with spot BTC Exchange-Traded funds (ETFs) recording billions in outflows. In addition, sticky inflation and macroeconomic headwinds suppress the Crypto King’s upside potential.
Institutional sell-off continues
Institutional demand continues to weaken so far this week. SoSoValue weekly data show that spot BTC ETFs recorded an outflow of $1.30 billion through Thursday. Unless Friday’s inflows are very significant, BTC would mark the third consecutive week of $1 billion in weekly outflows, signaling weakening institutional demand and potentially leading to a price decline.
Crypto King struggles despite optimism in US-Iran peace talks
On Thursday, Axios, citing two US officials, reported that the US and Iran had reached a draft agreement to extend the ongoing ceasefire for 60 days, which includes “unrestricted” energy flow through the Strait of Hormuz. This eases concerns about a prolonged disruption to Oil flows through the region and keeps Crude Oil prices depressed near the monthly trough.
However, the agreement will remain under review by US President Donald Trump, and he will deliver his remarks in a couple of days. The MoU also includes Iran’s commitment not to pursue its nuclear ambitions.
Crypto traders and investors have not reacted much as BTC and major cryptos continue their correction, with uncertainty still surrounding the deal.
Sticky inflation weighs on Bitcoin
On the macroeconomic front, rising US inflation kept a lid on BTC. On Thursday, the US Bureau of Economic Analysis (BEA) reported that the Personal Consumption Expenditures (PCE) Price Index accelerated to 3.8% YoY rate in April from 3.5% in the previous month. Moreover, the core gauge, which excludes volatile food and energy prices, rose 3.3%, as anticipated.
The data reinforced expectations that the US Federal Reserve (Fed) may need to keep rates elevated for longer and offset a slowdown in economic growth. The second estimate revealed that the US Gross Domestic Product (GDP) increased at an annualized rate of 1.6% in the first quarter of 2026. This was a downward revision from the advance estimate of 2.0%.
Traders, however, seem convinced that the Fed will keep borrowing costs elevated or even raise interest rates further by the end of the year as inflation remains sticky. Higher interest rates generally reduce market liquidity and push investors toward safer yield-bearing assets, limiting demand for risk-sensitive assets such as Bitcoin.
Sequans exits the DAT model
As explained in the previous report, a falling BTC price could reduce liquidity and trigger a spiral effect. On Thursday, Sequans Communications (SQNS) announced that it has fully redeemed its remaining convertible debt and is winding down its Bitcoin treasury strategy. This highlights the pressure that weaker market conditions can place on companies holding BTC in reserves.
The Crypto King has remained in a broader downtrend since reaching its all-time high of $126,199 on October 6, falling sharply to a low near $60,000 in early February. However, BTC staged a modest recovery through early May, yet the primary trend is still bearish.
If BTC continues to trade lower lows, liquidity conditions could tighten further, placing additional stress on the Digital Asset Treasury (DAT) model and forcing firms to reassess their treasury exposure and capital allocation strategies.
Meanwhile, big players such as Strategy continue to defend their holdings, relying heavily on equity issuance to fund additional Bitcoin purchases despite the ongoing market weakness.
On-chain perspective signals weakening demand
CryptoQuant’s chart below shows that Crypto King’s overall demand has flipped into net contraction.
Perpetual futures demand, which drove the April–May rally, reversed sharply as prices hit overhead supply at $82,000, prompting traders to close leveraged longs and removing the marginal buying pressure that had sustained the move.
 (1)-1780042238402.png)
In addition, BTC 30-day demand growth for spot ETFs has turned net sellers, reaching its lowest level in nearly a month, indicating further weakness in BTC’s demand.
 (3)-1780042307530.png)
Technical outlook: Shatters key supports
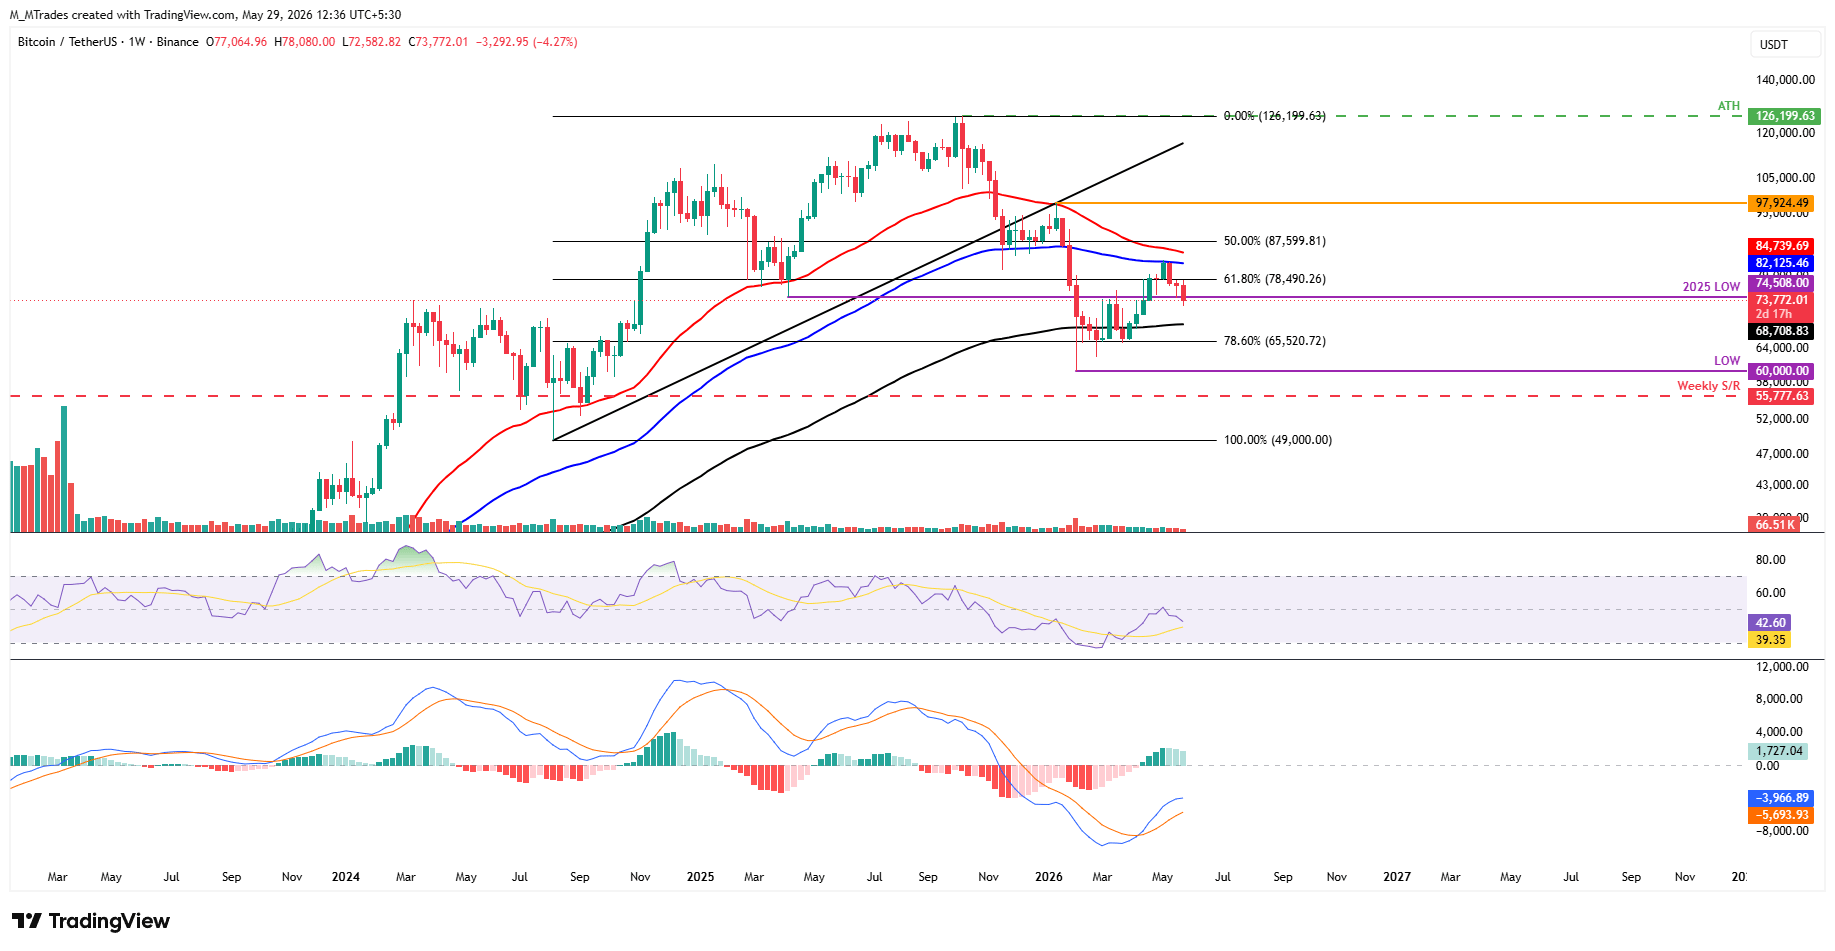
Bitcoin is extending its losses for the third consecutive week after being rejected by the 100-Week Exponential Moving Average (EMA) at $82,121 in mid-May. As of this week, the Crypto King is trading below the 2025 yearly low of $74,508 on Friday.
If BTC continues its correction and closes below the 2025 yearly low at $74,508 on a weekly basis, it could extend the decline toward the 200-week EMA at $68,708.
Momentum is mixed on the weekly chart, with signs of concern: the Relative Strength Index (RSI) slips below the neutral 50 level, reading 42 on Friday, while the Moving Average Convergence Divergence (MACD) histogram remains firmly positive, suggesting bullish pressure is attempting to reassert itself despite the recent correction.
On the daily chart, the Crypto king has shattered below all key daily EMAs and maintains a bearish near-term bias. Momentum remains weak, with the RSI slipping toward oversold territory near 36 and the MACD on the same period remaining in negative territory, with a declining line below zero, suggesting persistent downside pressure.
On the downside, initial support lies at the rising trendline break area around $71,648, ahead of the 23.6% Fibonacci retracement at $68,950 (drawn from the January high to the February low), which marks a more significant floor if selling extends.
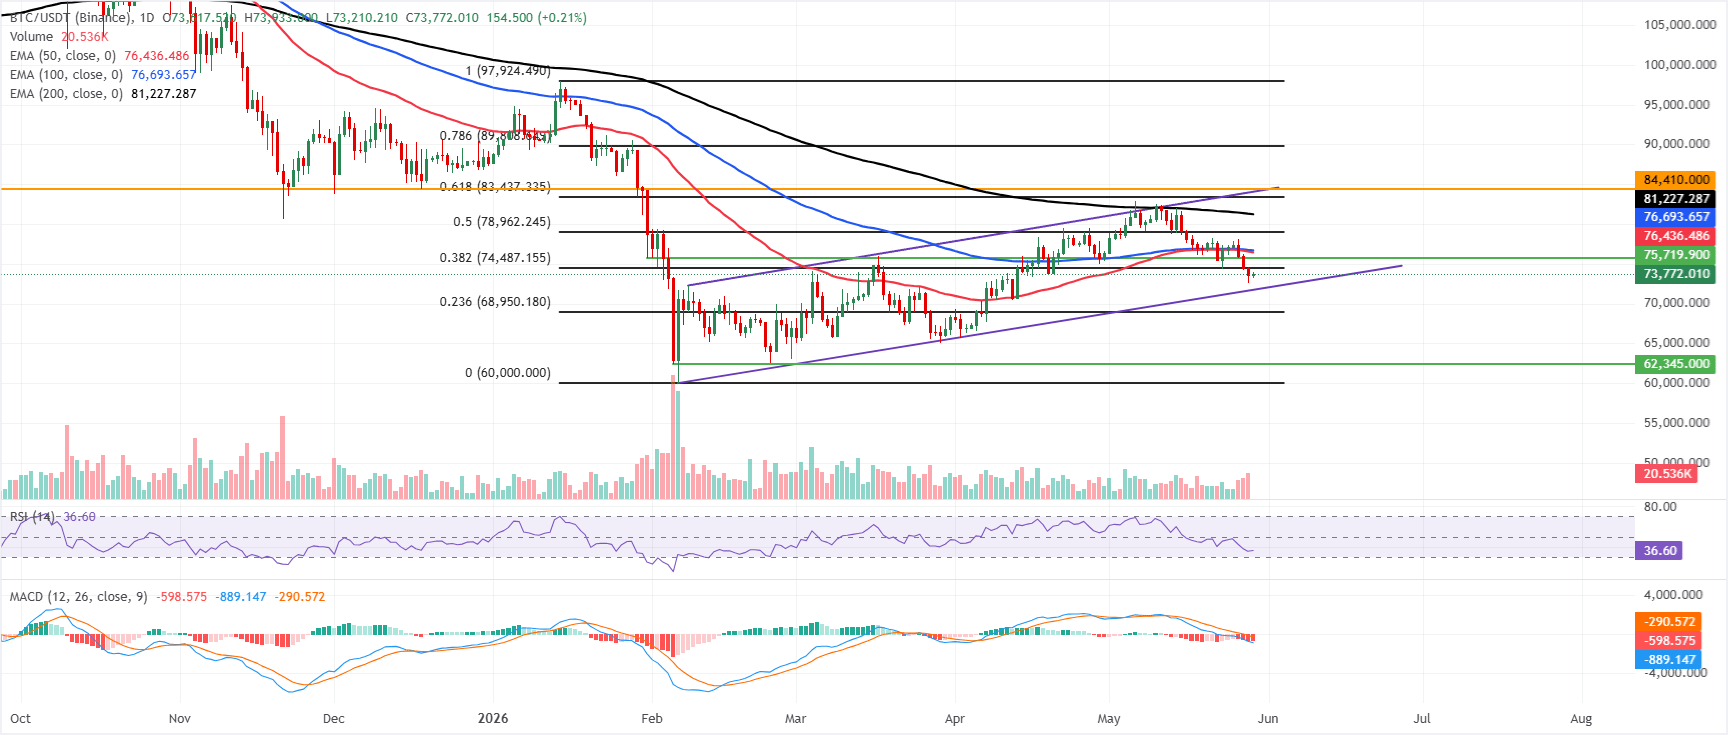
On the topside, immediate resistance is seen at the 38.2% Fibonacci retracement near $74,487, with the cluster of the 50-day and 100-day EMAs just above $76,500-$76,750 acting as a dense supply zone before the 50% retracement at $78,962 and the 200-day EMA around $81,247. Beyond there, the 61.8% Fibonacci retracement at $83,437 and the horizontal barrier at $84,410 define the upper resistance band that would need to be reclaimed to ease the current bearish tone.
(The technical analysis of this story was written with the help of an AI tool.)
Bitcoin, altcoins, stablecoins FAQs
Bitcoin is the largest cryptocurrency by market capitalization, a virtual currency designed to serve as money. This form of payment cannot be controlled by any one person, group, or entity, which eliminates the need for third-party participation during financial transactions.
Altcoins are any cryptocurrency apart from Bitcoin, but some also regard Ethereum as a non-altcoin because it is from these two cryptocurrencies that forking happens. If this is true, then Litecoin is the first altcoin, forked from the Bitcoin protocol and, therefore, an “improved” version of it.
Stablecoins are cryptocurrencies designed to have a stable price, with their value backed by a reserve of the asset it represents. To achieve this, the value of any one stablecoin is pegged to a commodity or financial instrument, such as the US Dollar (USD), with its supply regulated by an algorithm or demand. The main goal of stablecoins is to provide an on/off-ramp for investors willing to trade and invest in cryptocurrencies. Stablecoins also allow investors to store value since cryptocurrencies, in general, are subject to volatility.
Bitcoin dominance is the ratio of Bitcoin's market capitalization to the total market capitalization of all cryptocurrencies combined. It provides a clear picture of Bitcoin’s interest among investors. A high BTC dominance typically happens before and during a bull run, in which investors resort to investing in relatively stable and high market capitalization cryptocurrency like Bitcoin. A drop in BTC dominance usually means that investors are moving their capital and/or profits to altcoins in a quest for higher returns, which usually triggers an explosion of altcoin rallies.
Bài viết đề xuất


