

Ethereum, Ripple, Solana and Dogecoin brace for bearish week as ETF outflows deepen market stress
- Bitcoin slips below $77,000 on Monday, risking a steeper correction under $75,000.
- Altcoins decline amid heightened liquidations, risk-off sentiment, ETF outflows, and upcoming $750 million token unlocks.
- Major altcoins, including Ethereum, Ripple, Solana and Dogecoin, remain exposed to further downside amid growing selling pressure.
The broader cryptocurrency market is under intense selling pressure as Bitcoin (BTC) slipped below $77,000 on Monday, triggering a bearish cascading effect in altcoins. Ethereum (ETH), Ripple (XRP), Solana (SOL) and Dogecoin (DOGE) extend their fourth consecutive day of losses, aligning with the increase in crypto long liquidations, declining investors’ risk appetite, and institutional outflows.
The upcoming token unlocks worth over $750 million this week could add to the selling pressure, risking a bearish week ahead for altcoins.
Rising selling pressure paints the altcoin market red
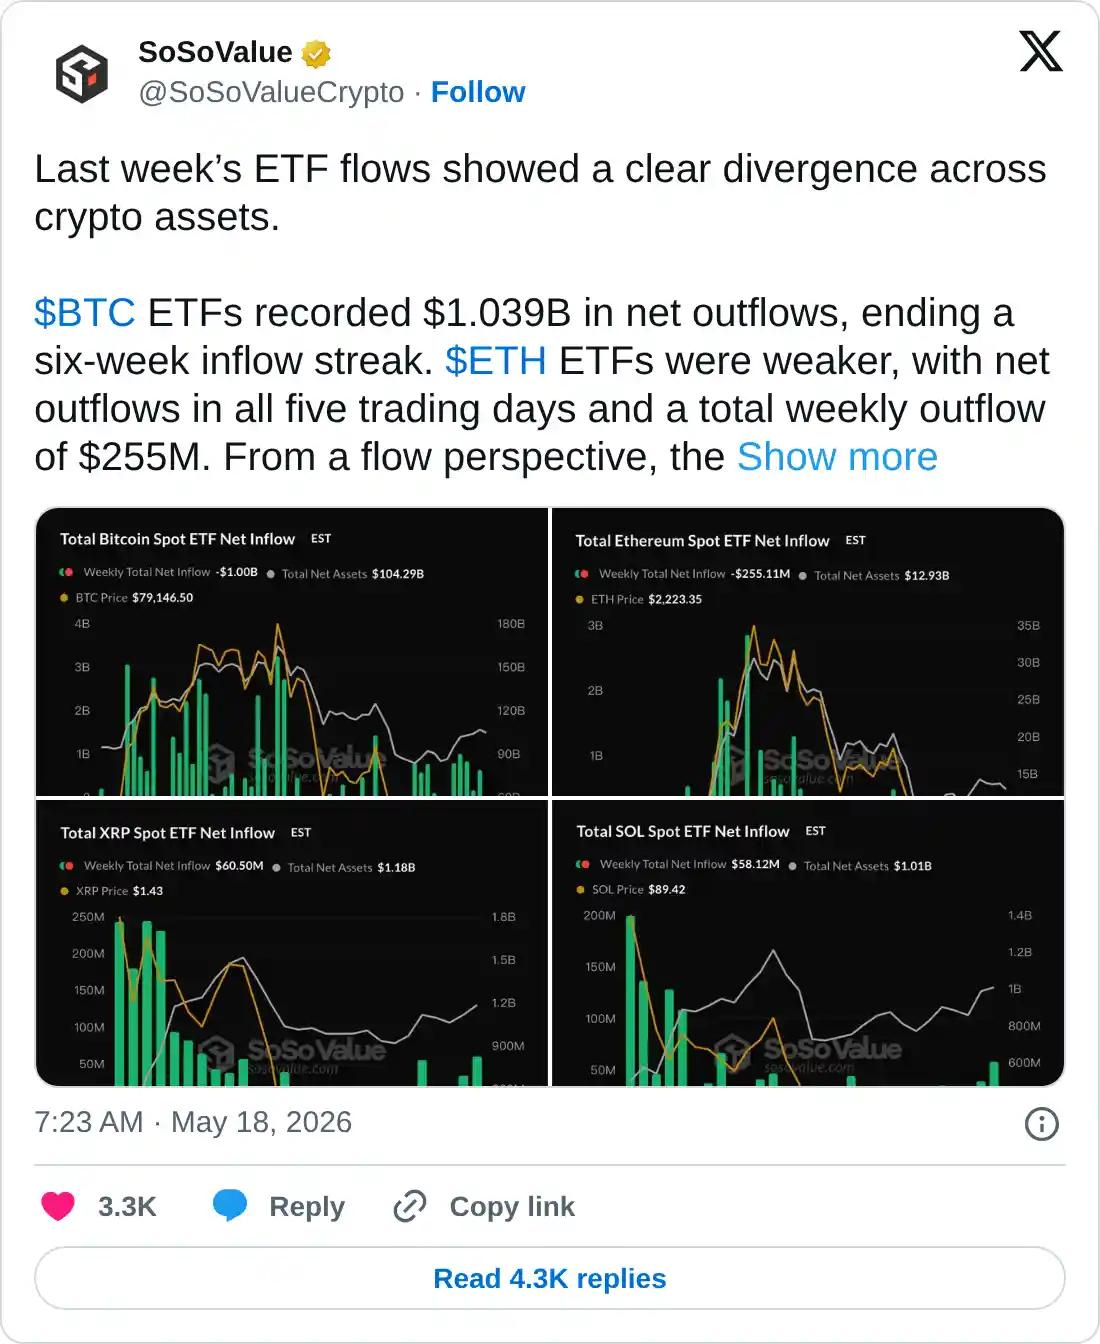
Institutional investors show mixed feelings about the increased volatility in the crypto market. Bitcoin and Ethereum-focused spot Exchange Traded Funds (ETFs) recorded over $1 billion and $255 million in outflows, respectively, last week. Meanwhile, SOL and XRP pulled in $58.12 million and $60.50 million in ETF inflows, reflecting mild institutional confidence.
Still, the intense outflows from BTC-focused ETFs led to a steep decline across major altcoins, which had been priced in over the last three days.
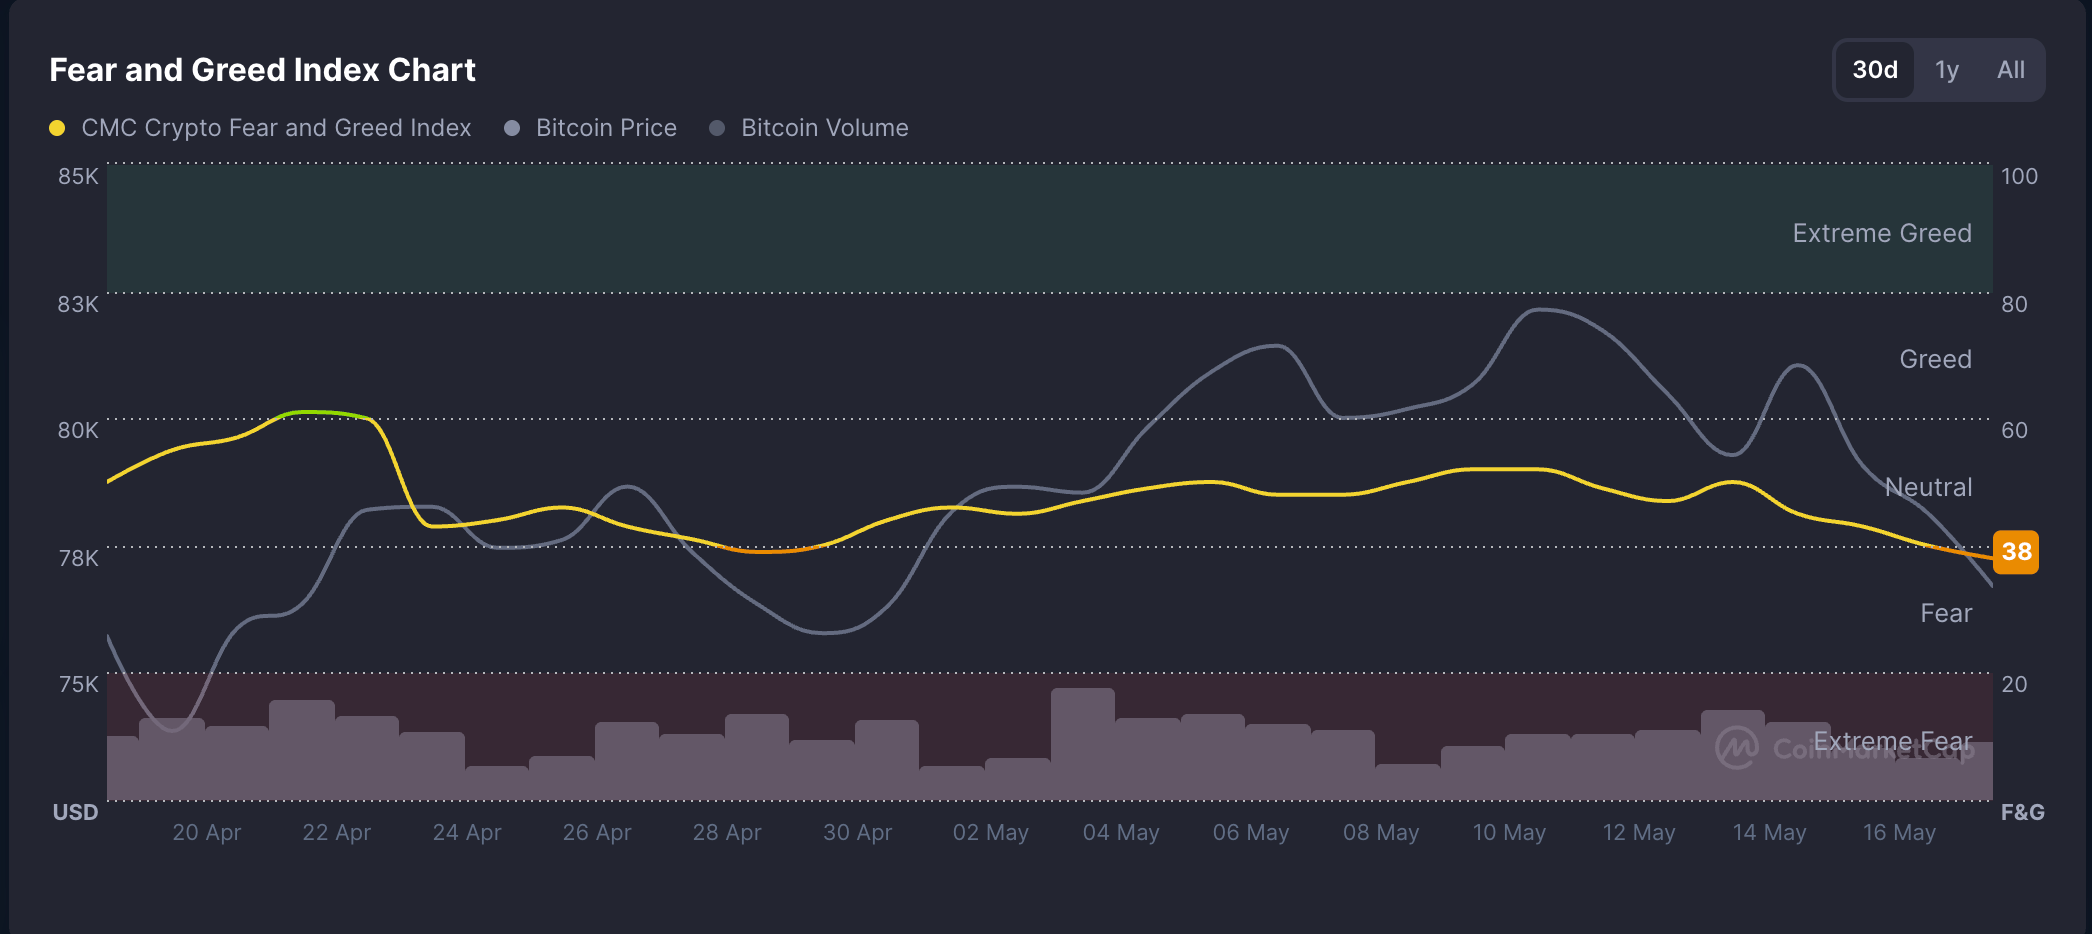
The risk appetite in the crypto market has also reduced, as is typical during Bitcoin pullbacks. CoinMarketCap’s Fear and Greed Index is down to 38 on Monday, entering the “Fear” zone that signals a risk-off mood.
On the other hand, 24-hour liquidation data crossed $657 million earlier in the day, led by $587 million in long liquidations, reflecting short-term volatility wiping out bullish positions.
The growing downside pressure in the crypto market mirrors Bitcoin’s reversal on Friday, which erased gains after the Senate Banking Committee on Thursday advanced the Digital Asset Market Clarity Act to full Senate voting.
Bitcoin risks extending a free-fall toward $74,000
Bitcoin maintains a capped tone as it fluctuates close to the 50-day Exponential Moving Average (EMA) at $76,730 and the 100-day EMA at $77,087. A clear daily close below these moving averages could test the rising support trendline near the April 12 low at $70,505.
Momentum indicators align with this softening bias as the Relative Strength Index (RSI) has eased to around 45 and the Moving Average Convergence Divergence (MACD) has turned more negative, hinting that buying pressure is fading even as an underlying rising trendline continues to offer technical support.
-1779103445314.png)
Looking up, the 200-day EMA around $83,263 remains a key resistance for a potential rebound from the supporting 50-day and 100-day EMAs.
Token unlocks mean altcoins under pressure
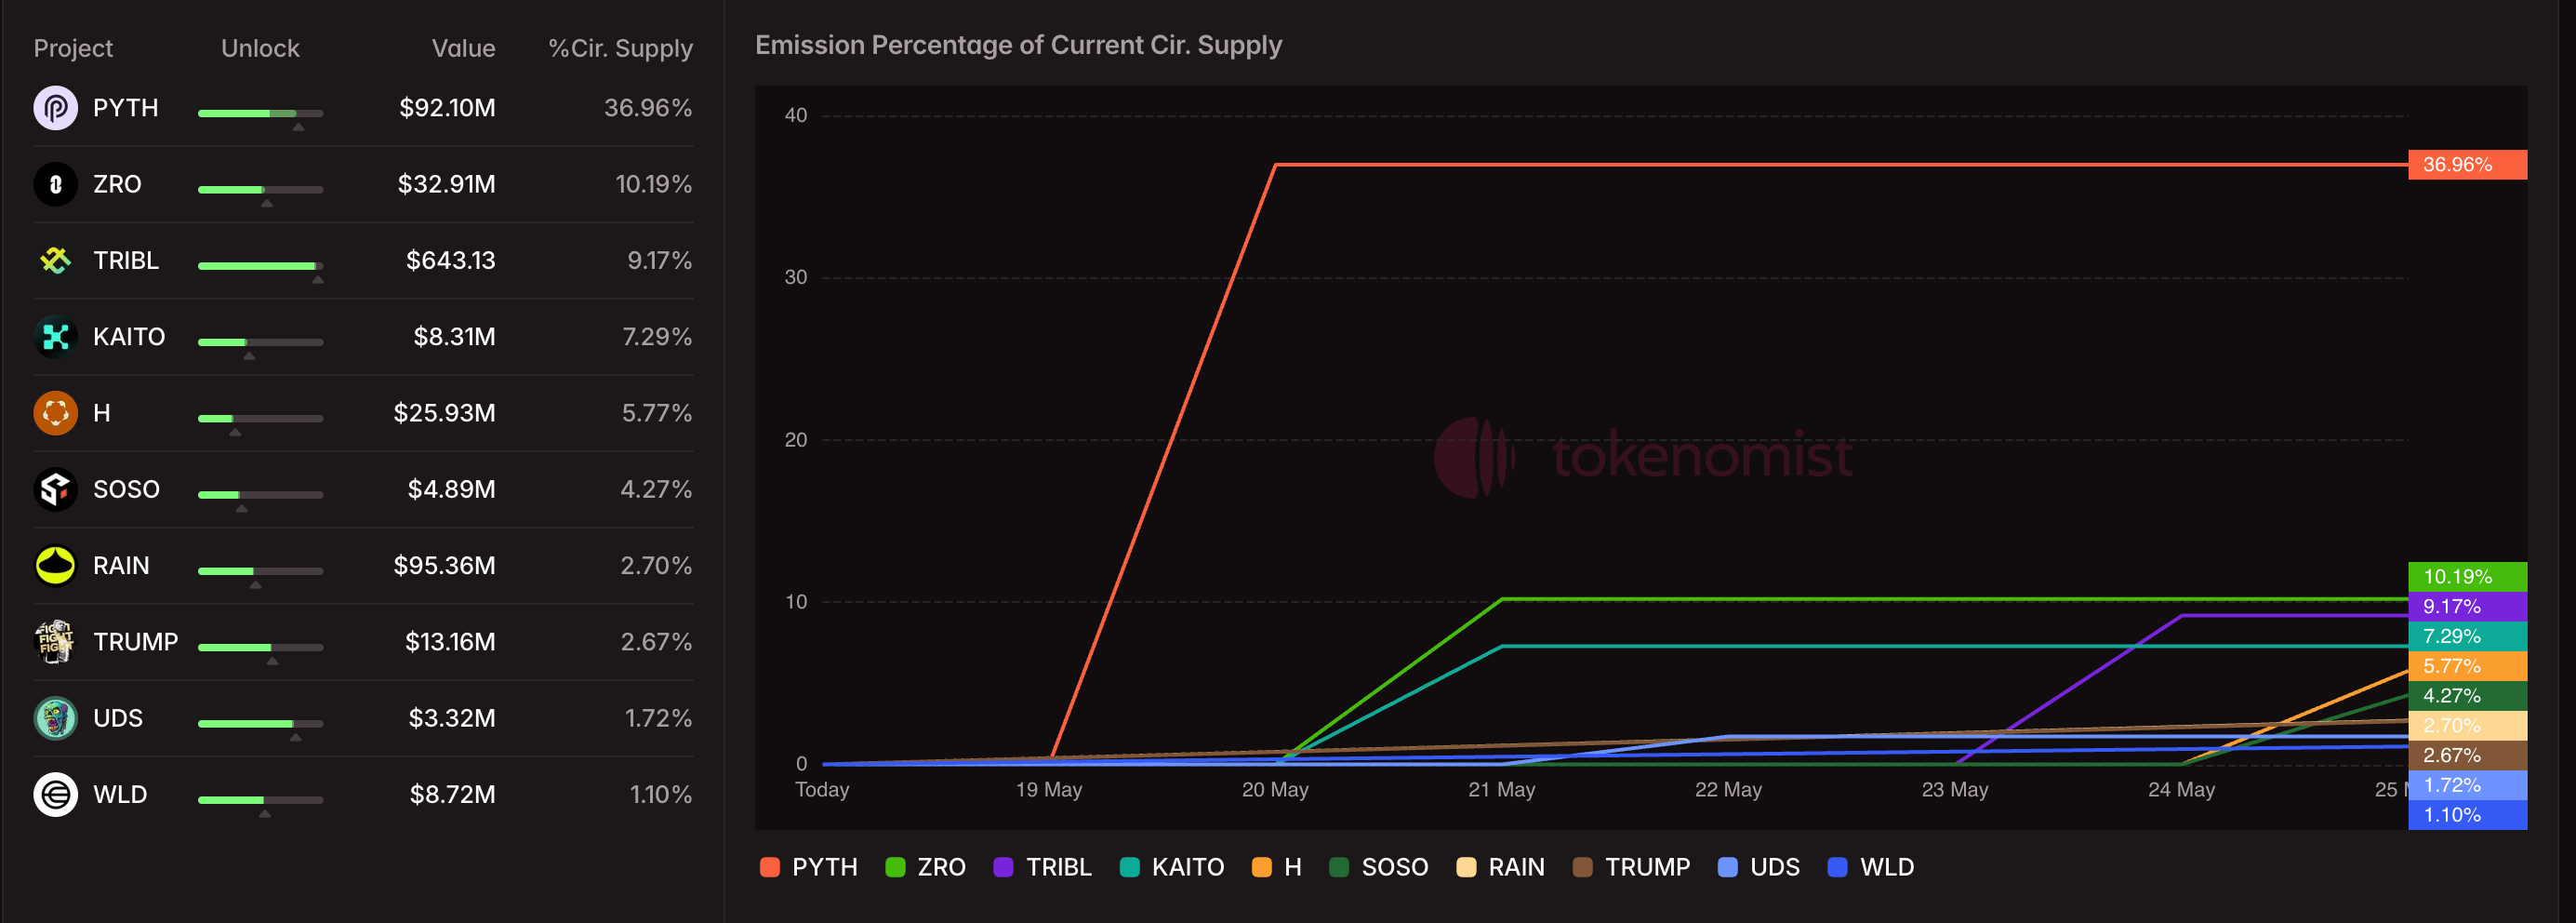
The release of vested tokens, or token unlocks, often adds selling pressure when market sentiment is down. Tokenomist data shows Pyth Network (PYTH), LayerZero (ZRO), Official Trump (TRUMP), Worldcoin (WLD), and some other altcoins are poised for token unlocks this week. These unlocks will include 2.12 billion PYTH, 25.70 million ZRO, 50 million TRUMP, and 500 million WLD tokens.
ETH, XRP, SOL and DOGE risk further decline
Ethereum maintains a bearish near-term bias as it sits beneath the 50-day, 100-day, and 200-day EMAs at roughly $2,258, $2,339, and $2,597, respectively, on Monday. The pair is clinging just above an upward support trendline that was broken around $2,113.39, hinting at fragile demand after the recent slide. A potential rebound could target the 50-day EMA at $2,258.
Momentum metrics reinforce the weak tone, with the RSI hovering near oversold territory at 37 and the MACD line crossing below the zero line, suggesting persistent downside pressure despite the proximity of structural support.
-1779106430178.png)
On the topside, initial resistance is located at the 50-day EMA near $2,257.90, where any rebound is likely to face selling interest, followed by a stronger cap at the 100-day EMA around $2,330.51 and then the 200-day EMA close to $2,523.90.
Similarly, Ripple keeps a bearish near-term bias with its fourth consecutive bearish day, crossing below the 50-day EMA at $1.4159. This short-term moving average remains fairly below the 100-day and 200-day EMAs at $1.4930 and $1.7236, respectively, suggesting the broader trend remains pressured and serves as overhead resistance.
Ripple's trend momentum also leans to the downside, with the RSI at about 44 and the MACD histogram bars expanding in negative territory, suggesting that sellers retain control for now.
-1779106216978.png)
The path of least resistance for XRP targets the $1.2700-$1.2543 support zone.
Solana trades below at $85.00 at press time on Monday, maintaining a bearish near-term bias as price remains capped beneath the 50-day EMA at $87.89 and well below the 100-day and 200-day EMAs at $93.80 and $110.26, respectively.
The prior descending resistance trendline now offers a reclaimed shelf around $83.74, but a soft RSI at 41 and negative MACD histogram bars on the rise hint that sellers still control momentum despite this tentative base.
-1779106359290.png)
Looking down, the sub-$80 levels around $77.60 and $75.63 could provide support areas for buyers to regain trend control.
Finally, Dogecoin remains afloat above the $0.1000 psychological threshold, hovering just above its 50-day EMA at $0.1039 but still capped well below the 100-day EMA at $0.1072, which keeps the broader tone neutral-to-bearish.
The recent rollover of the MACD line below its signal line reflects renewed selling pressure, while the RSI at 45 reaffirms the fading bullish momentum.
On the downside, immediate support is provided by the 50-day EMA at $0.1039; a daily close below this level would expose a deeper pullback, while holding above it would allow the pair to consolidate as it builds energy for a potential retest of the $0.1072 barrier.
-1779106203548.png)
On the topside, initial resistance is defined by the 100-day EMA at $0.1072, with a stronger hurdle emerging at the 200-day EMA near $0.1250, where medium-term sellers are likely to reassert control.
(The technical analysis of this story was written with the help of an AI tool.)
Bài viết đề xuất


