

Crypto Today: Bitcoin, Ethereum, XRP extend decline as weak sentiment, ETF outflows weigh
- Bitcoin erases early May gains, tests the 50 EMA support below $77,000 on Monday amid ETF outflows.
- Ethereum slides for the fourth consecutive day, testing the demand at $2,100 as sentiment in the broader crypto market deteriorates.
- XRP remains below the pivotal $1.40 level as sellers tighten their grip, further weakening momentum indicators.
Cryptocurrency prices are broadly edging lower on Monday, with Bitcoin (BTC) trading below $77,000. This downturn represents a 7% pullback from Bitcoin’s May high of $82,850, underscoring a broad shift toward risk-off sentiment across crypto markets.
Altcoins are following Bitcoin’s downward trajectory, with Ethereum (ETH) retesting key support at $2,100 and XRP consolidating near the $1.38 demand zone as bearish sentiment persists.
Crypto market sentiment cools amid capital outflows
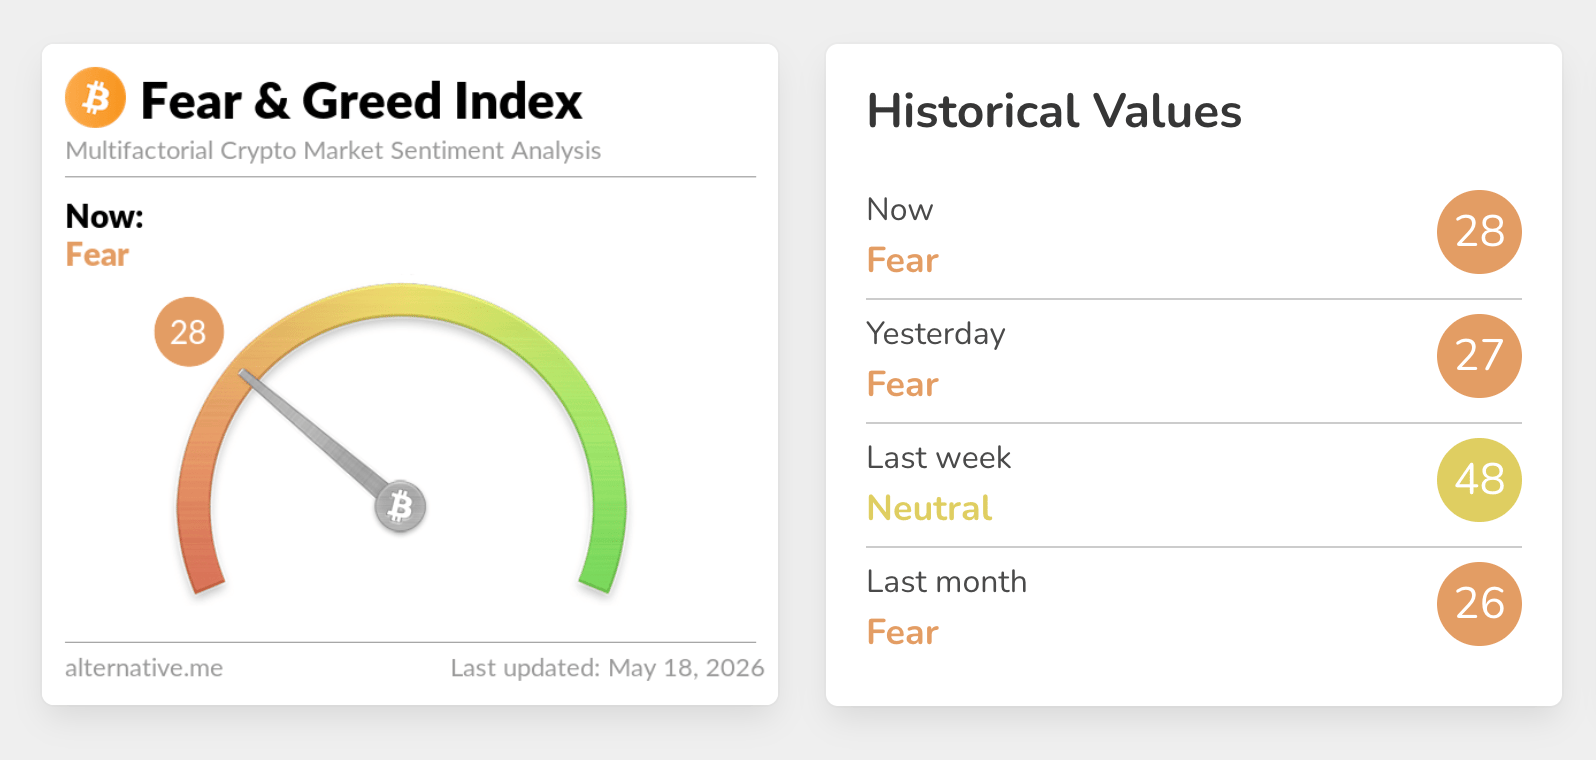
Demand for crypto assets has steadily waned, mirroring sustained selling in the broader markets. This shift is clearly captured by the Crypto Fear & Greed Index, which drops sharply to 28 in the fear territory on Monday, compared to an average of 48 in the neutral territory observed last week. Growing risk-off sentiment could further weaken crypto assets, breaking the structure from neutral to strongly bearish.
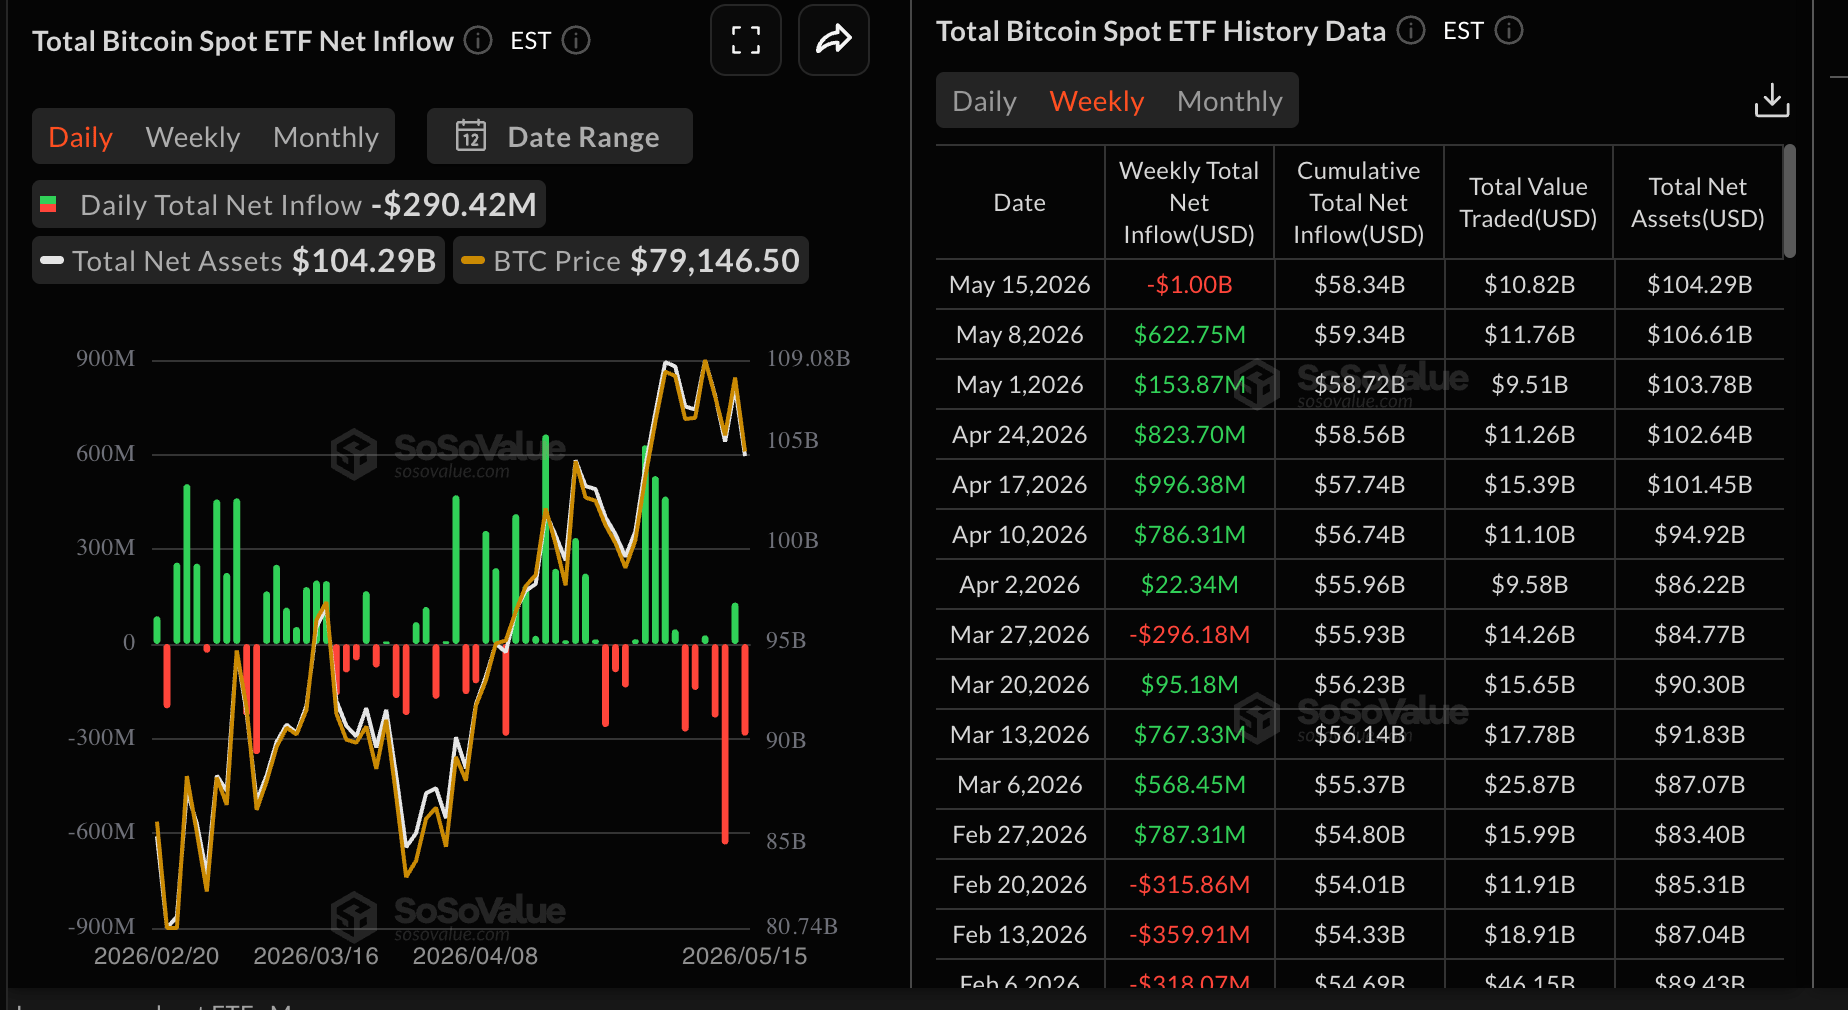
Institutional investors expressed their lack of interest by ramping up withdrawals from spot Exchange-Traded Funds (ETFs). US-listed spot Bitcoin ETFs suffered $1 billion in total outflows last week, the highest since late January.
Despite the outflows, cumulative inflows remain positive at $58.34 billion while net assets average $104.29 billion, according to SoSoValue data. If market sentiment continues to deteriorate and outflows persist, Bitcoin’s reemergence above $100,000 could remain a pipe dream.
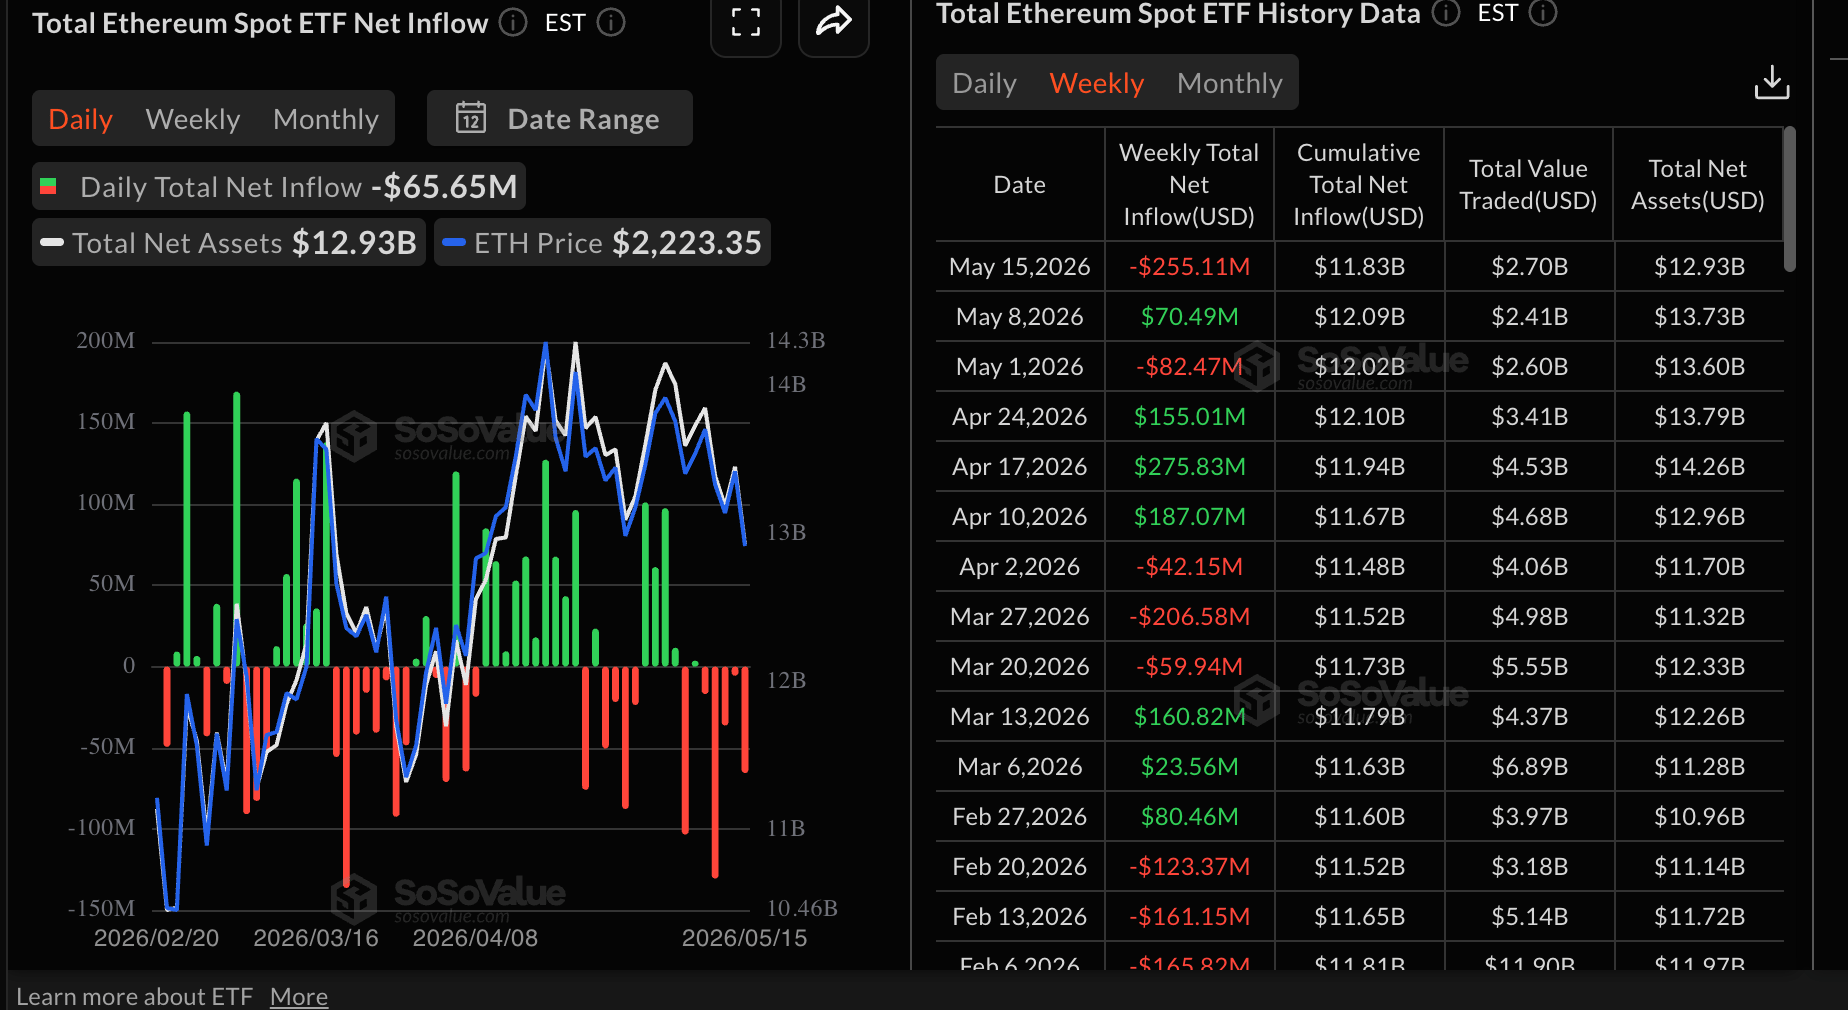
Ethereum continued its corrective stance, with spot ETF outflows totaling $255 million last week, following roughly $70 million in inflows the previous week. Cumulative inflows now stand at $11.83 billion, with net assets under management averaging $12.93 billion.
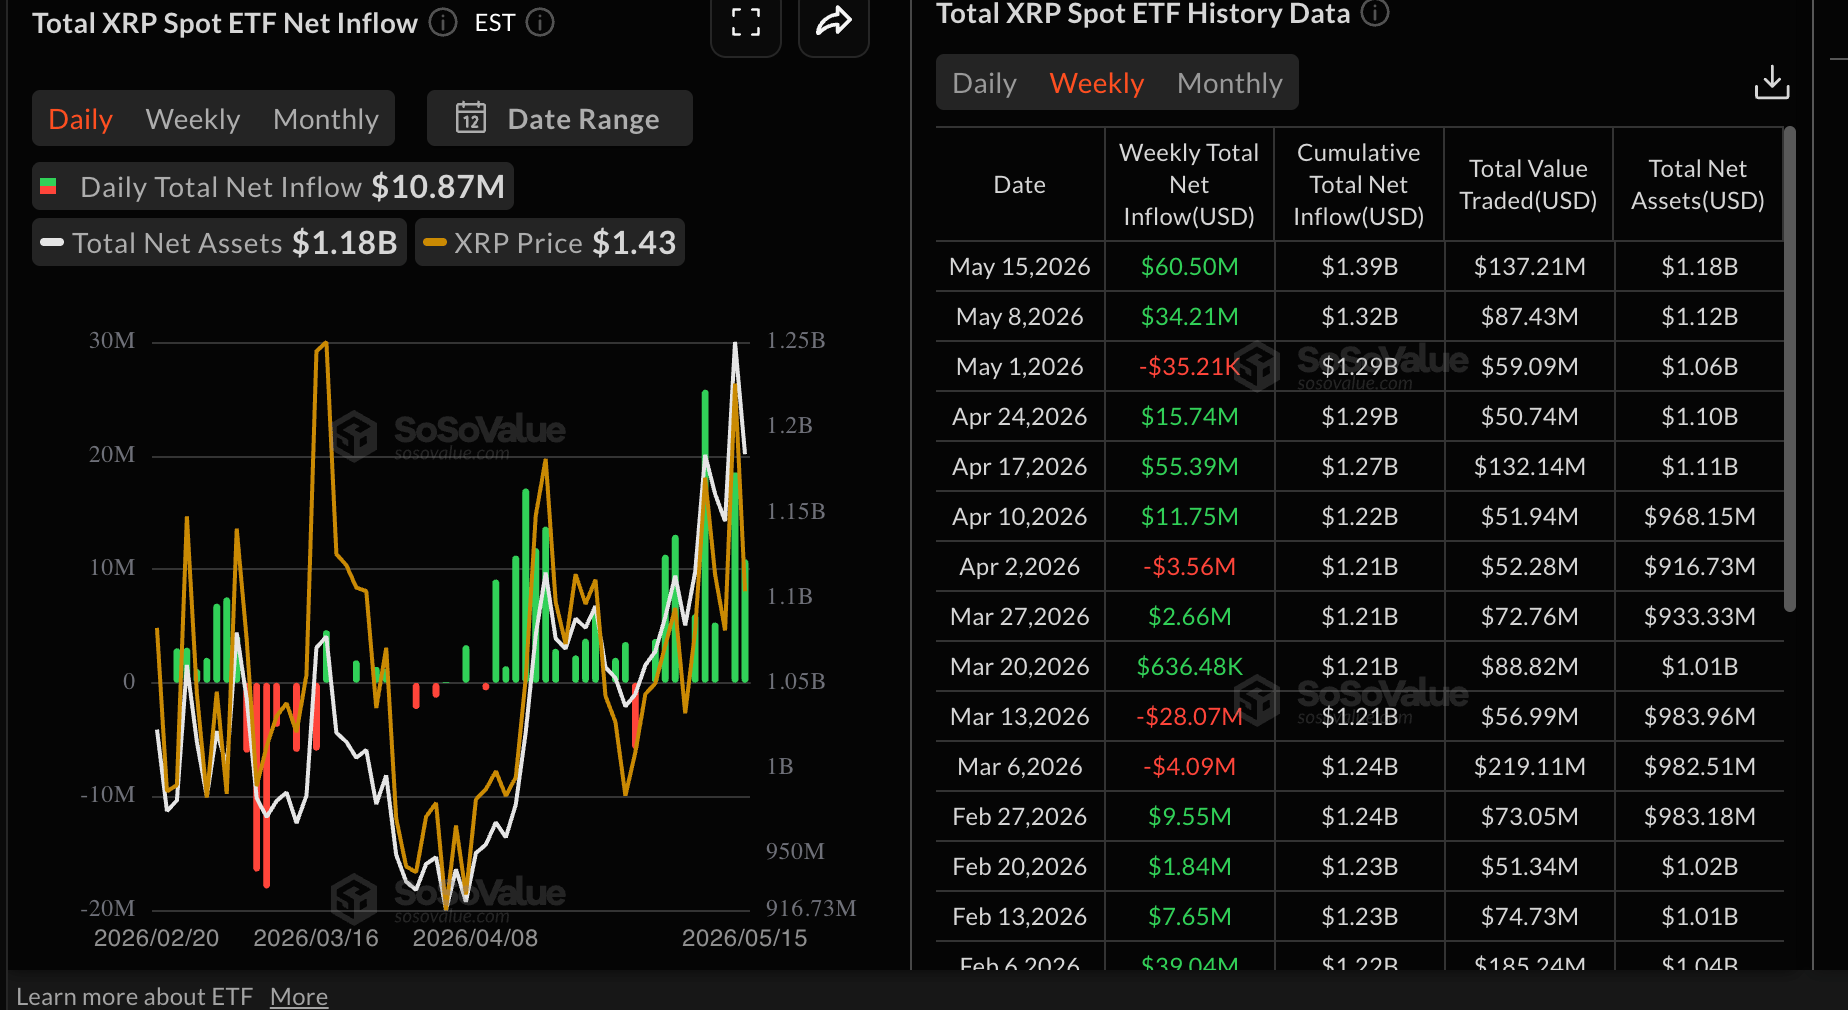
As for XRP spot ETFs, they beat odds with inflows increasing to roughly $61 million last week from $34 million the previous week. Cumulative inflows increased slightly to $1.39 billion on Friday, from $1.32 billion the previous. Total assets under management increased to $1.18 billion, from $1.12 billion during the same period.
Price analysis: Bitcoin slides as selling pressure overwhelms demand
Bitcoin trades around $77,000, holding below the 200-day Exponential Moving Average (EMA) at $81,804 and beneath a broader downward resistance trend line, which together keep the near-term bias bearish despite price clinging to the higher end of its recent range.
The pair is still trading above the 50-day and 100-day EMAs, clustered around $76,736 and $76,868, but the negative Moving Average Convergence Divergence (MACD) histogram on the daily chart and a Relative Strength Index (RSI) near 45 hint that bullish momentum is fading while the broader corrective phase from the highs remains intact.
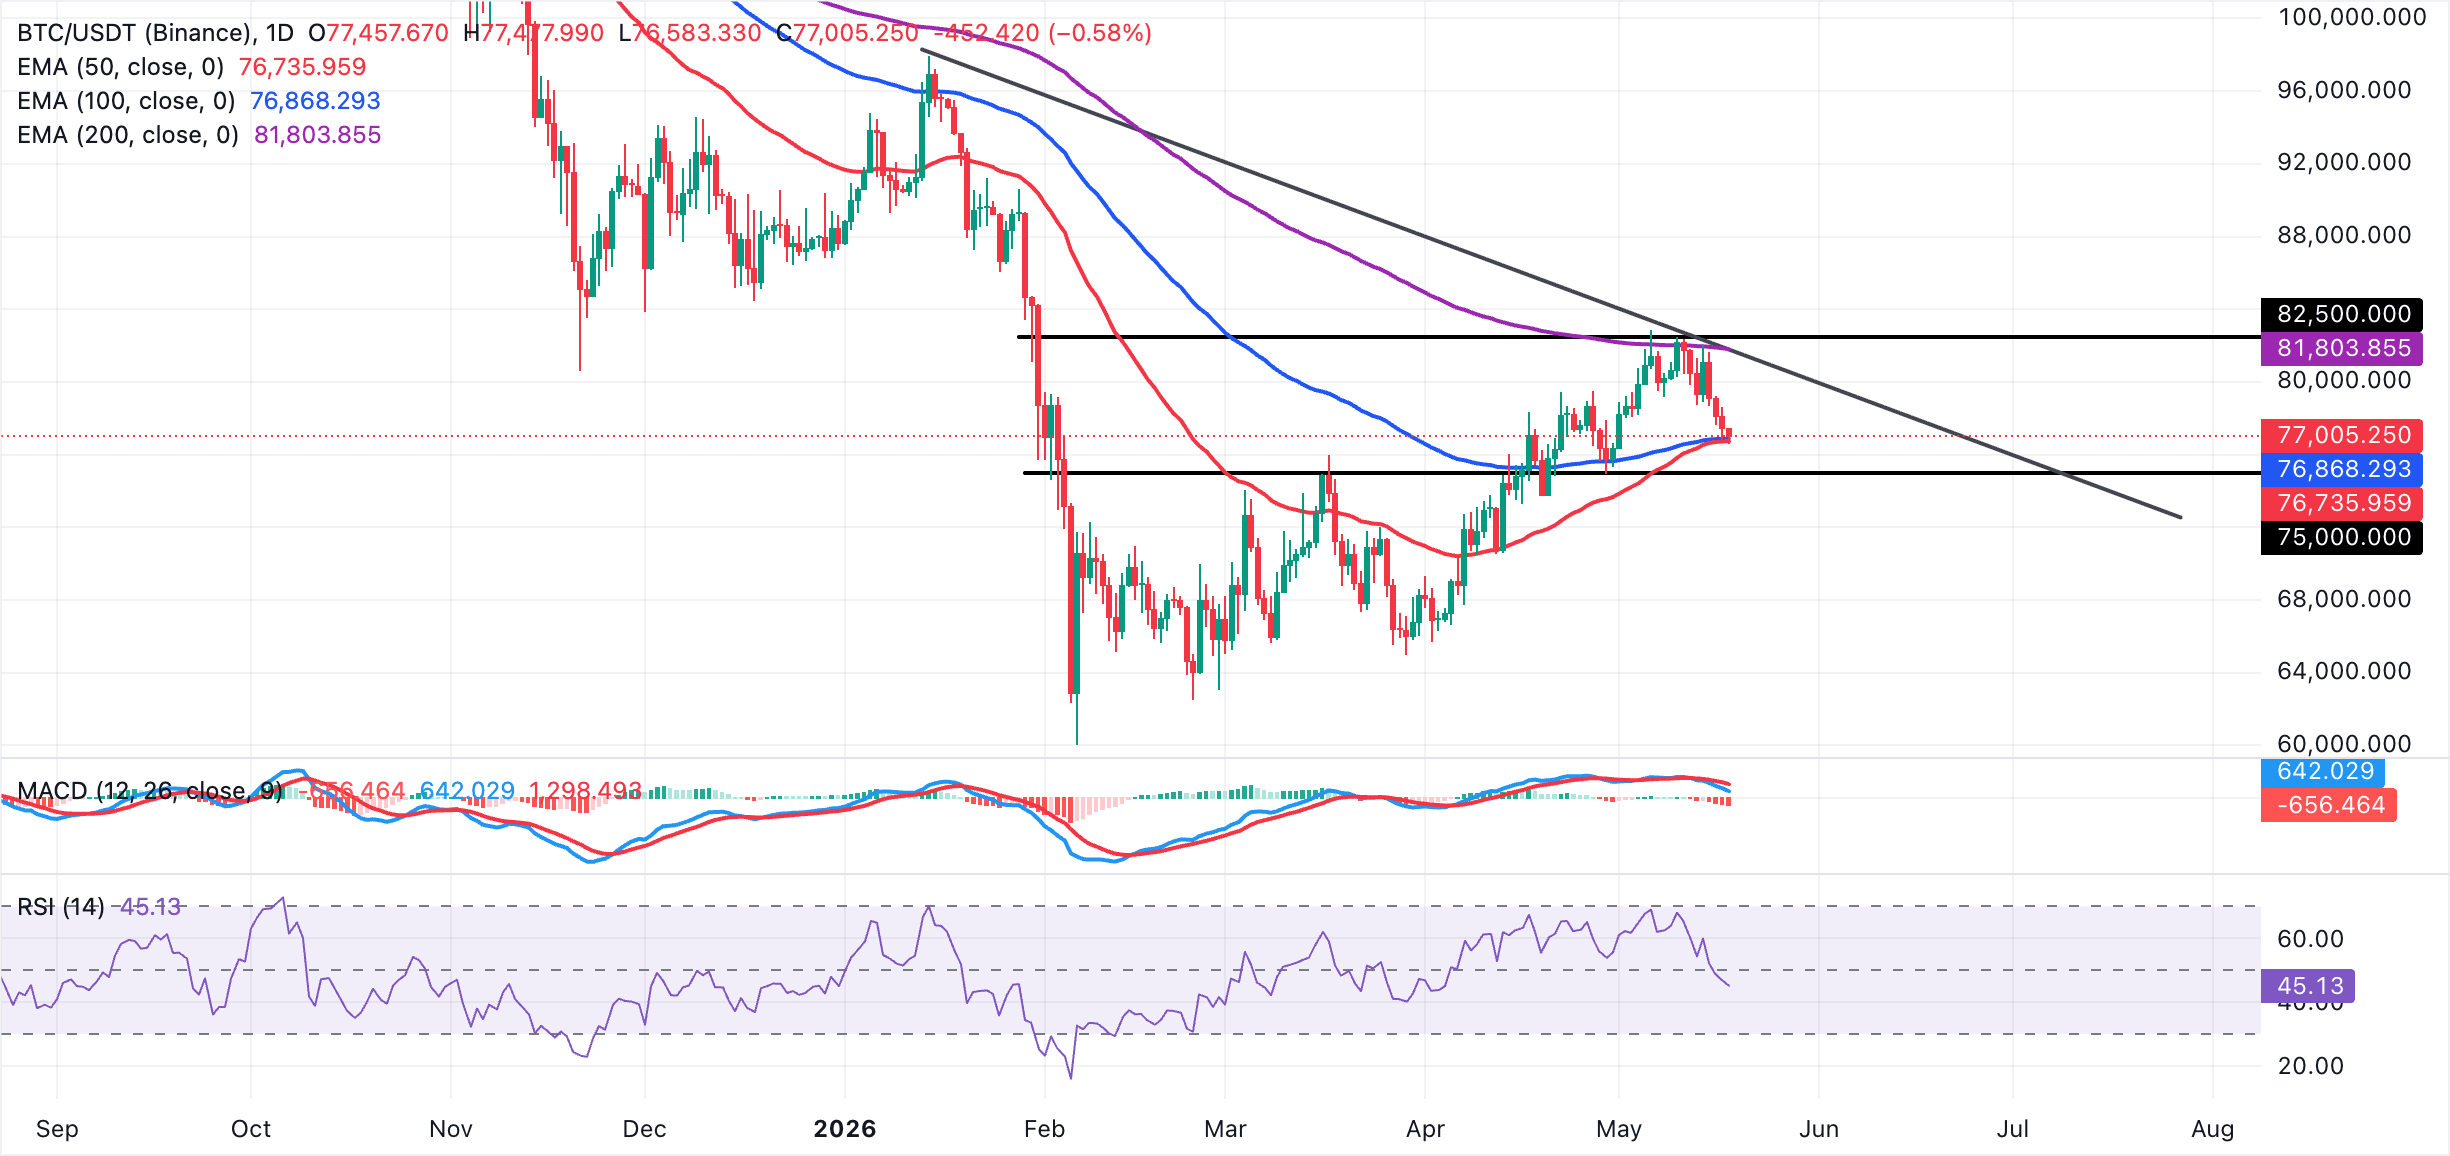
On the topside, initial resistance is defined by the 200-day EMA at $81,804, with the descending trendline reinforcing that broader cap as long as it stays above the market. On the downside, immediate support is seen at the 100-day EMA at $76,868, followed closely by the 50-day EMA near $76,736. A sustained break below this moving-average band would likely open the door to deeper retracement, while a recovery toward the 200-day EMA is needed to ease the current downside pressure.
Altcoins technical outlook: Ethereum and XRP risk extending losses
Ethereum trades at $2,119, maintaining a bearish near‑term bias as price sits below the 50-, 100- and 200-day EMAs. The pair has also slipped back under an upward support trendline, which now acts as resistance near $2,133, reinforcing the idea of a market capped by overhead supply.
Momentum remains weak, with the RSI hovering near 34 on the daily chart, hinting at persistent downside pressure even as conditions edge toward oversold territory, while the MACD histogram remains deeply negative, suggesting bearish momentum is still dominant.
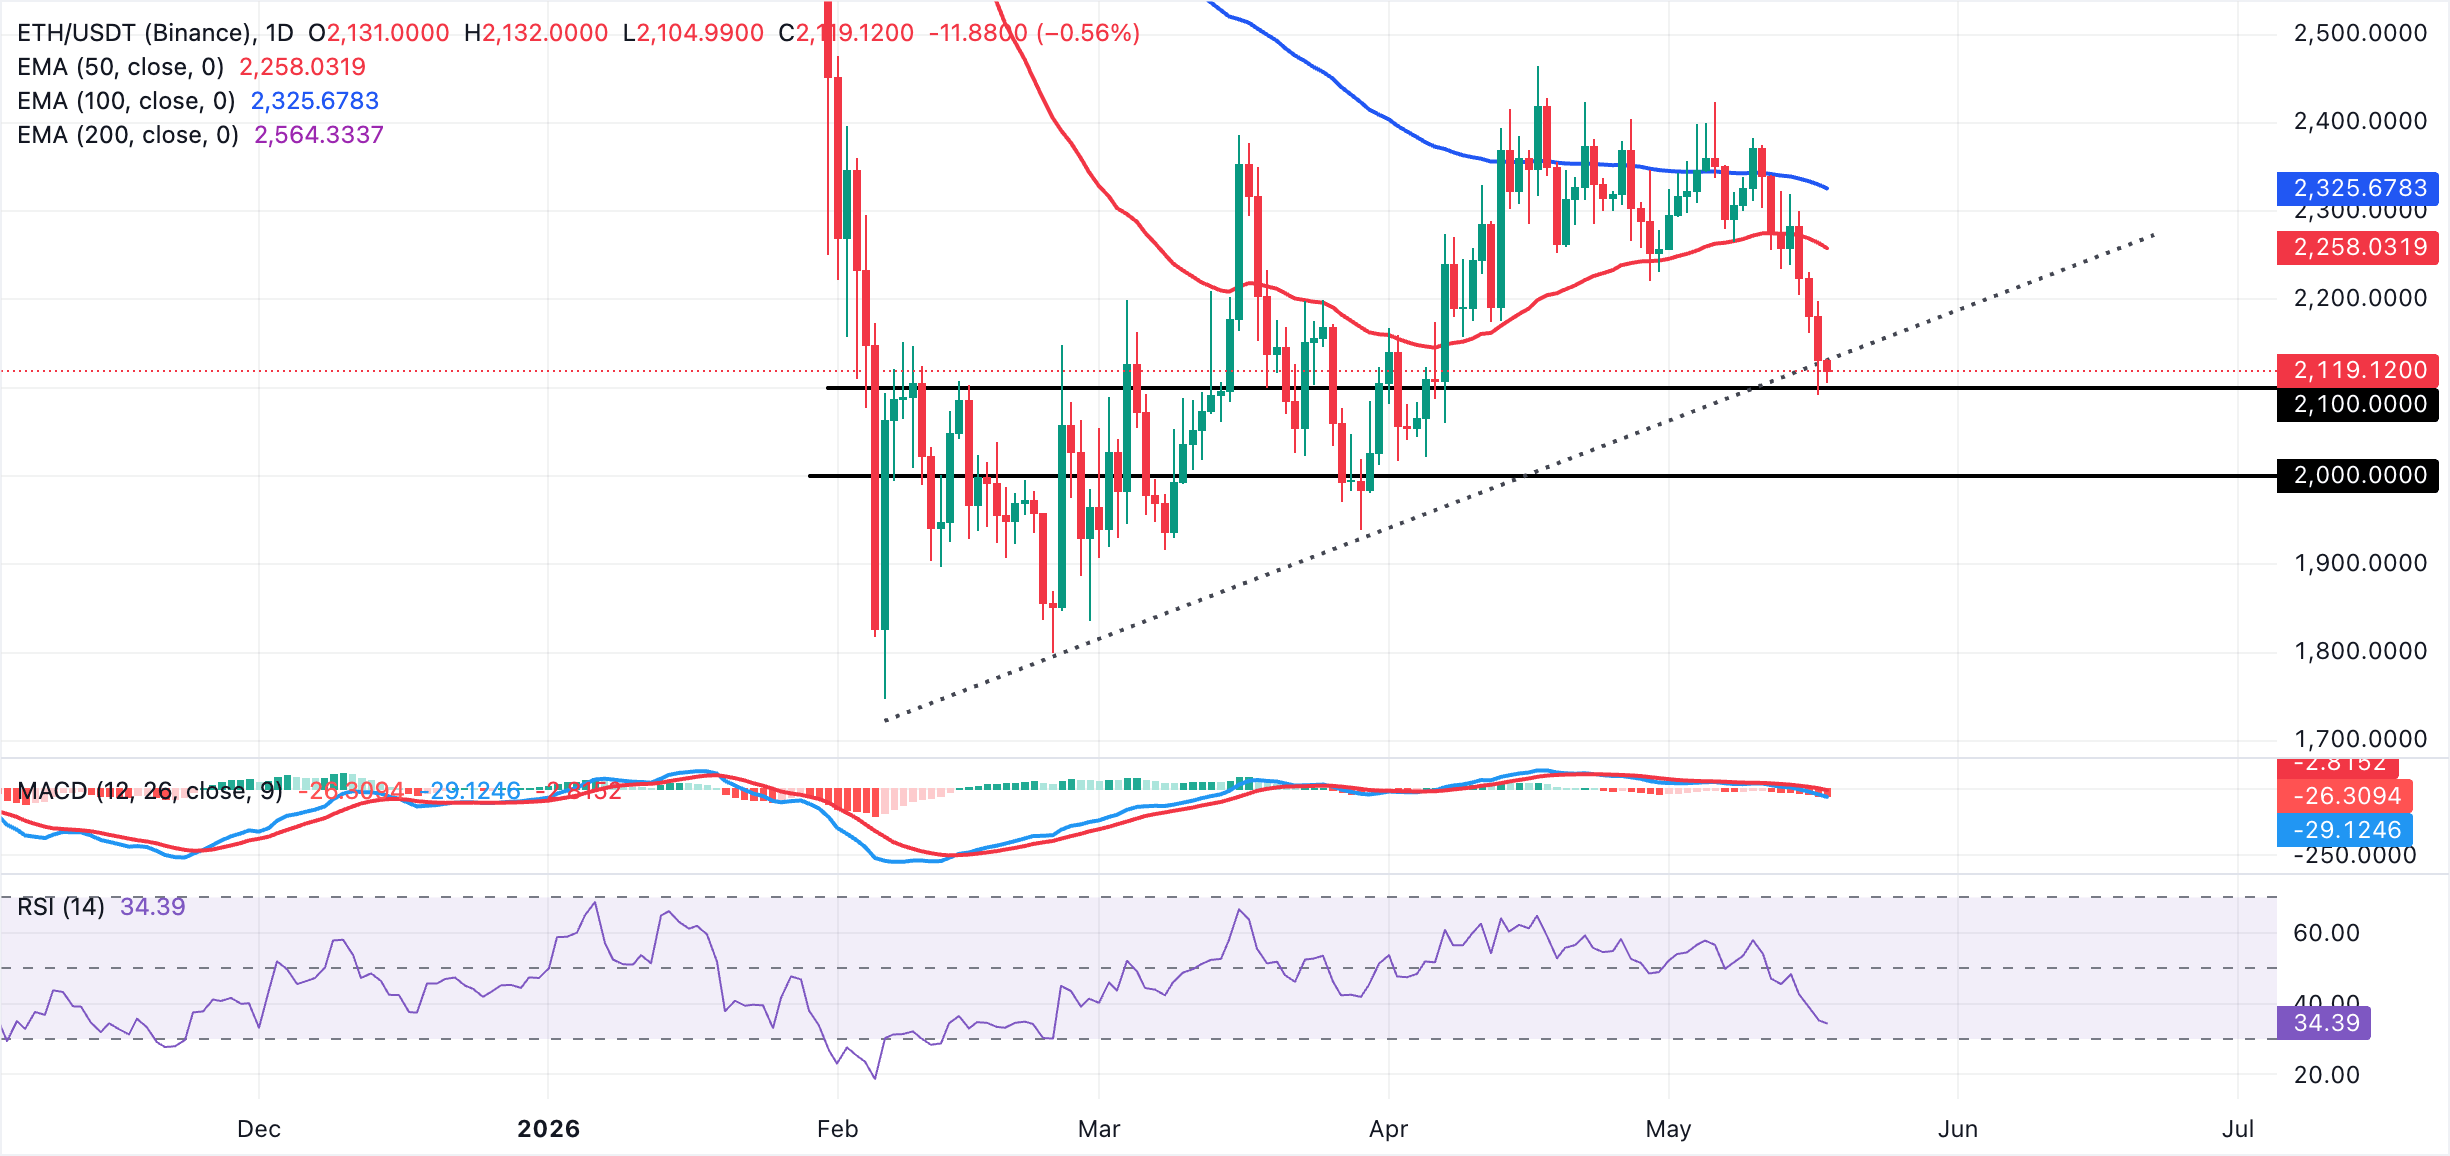
On the topside, initial resistance emerges at the ascending trendline around $2,133, where failure to reclaim it would keep rallies limited. Above that, the 50-day EMA near $2,258 is the next hurdle, followed by the 100-day EMA around $2,326 and the 200-day EMA close to $2,564, which defines a broader bearish structure.
On the downside, initial support lies at $2,100, followed by $2,000, where buy-the-dip demand is likely to build a tailwind, pushing for a trend reversal.
XRP, on the other hand, trades around $1.38. The pair holds a bearish near-term configuration, having slipped back under the rising trendline, which now offers initial resistance around $1.39. All three major EMAs, including the 50-day at $1.42, the 100-day at $1.49, and the 200-day at $1.70, remain stacked above spot. This suggests the market is still capped by a broader downswing.
Momentum also leans to the downside, with the RSI hovering in the mid‑40s on the daily chart and the MACD histogram below zero, hinting that sellers retain the initiative despite intermittent rebounds.
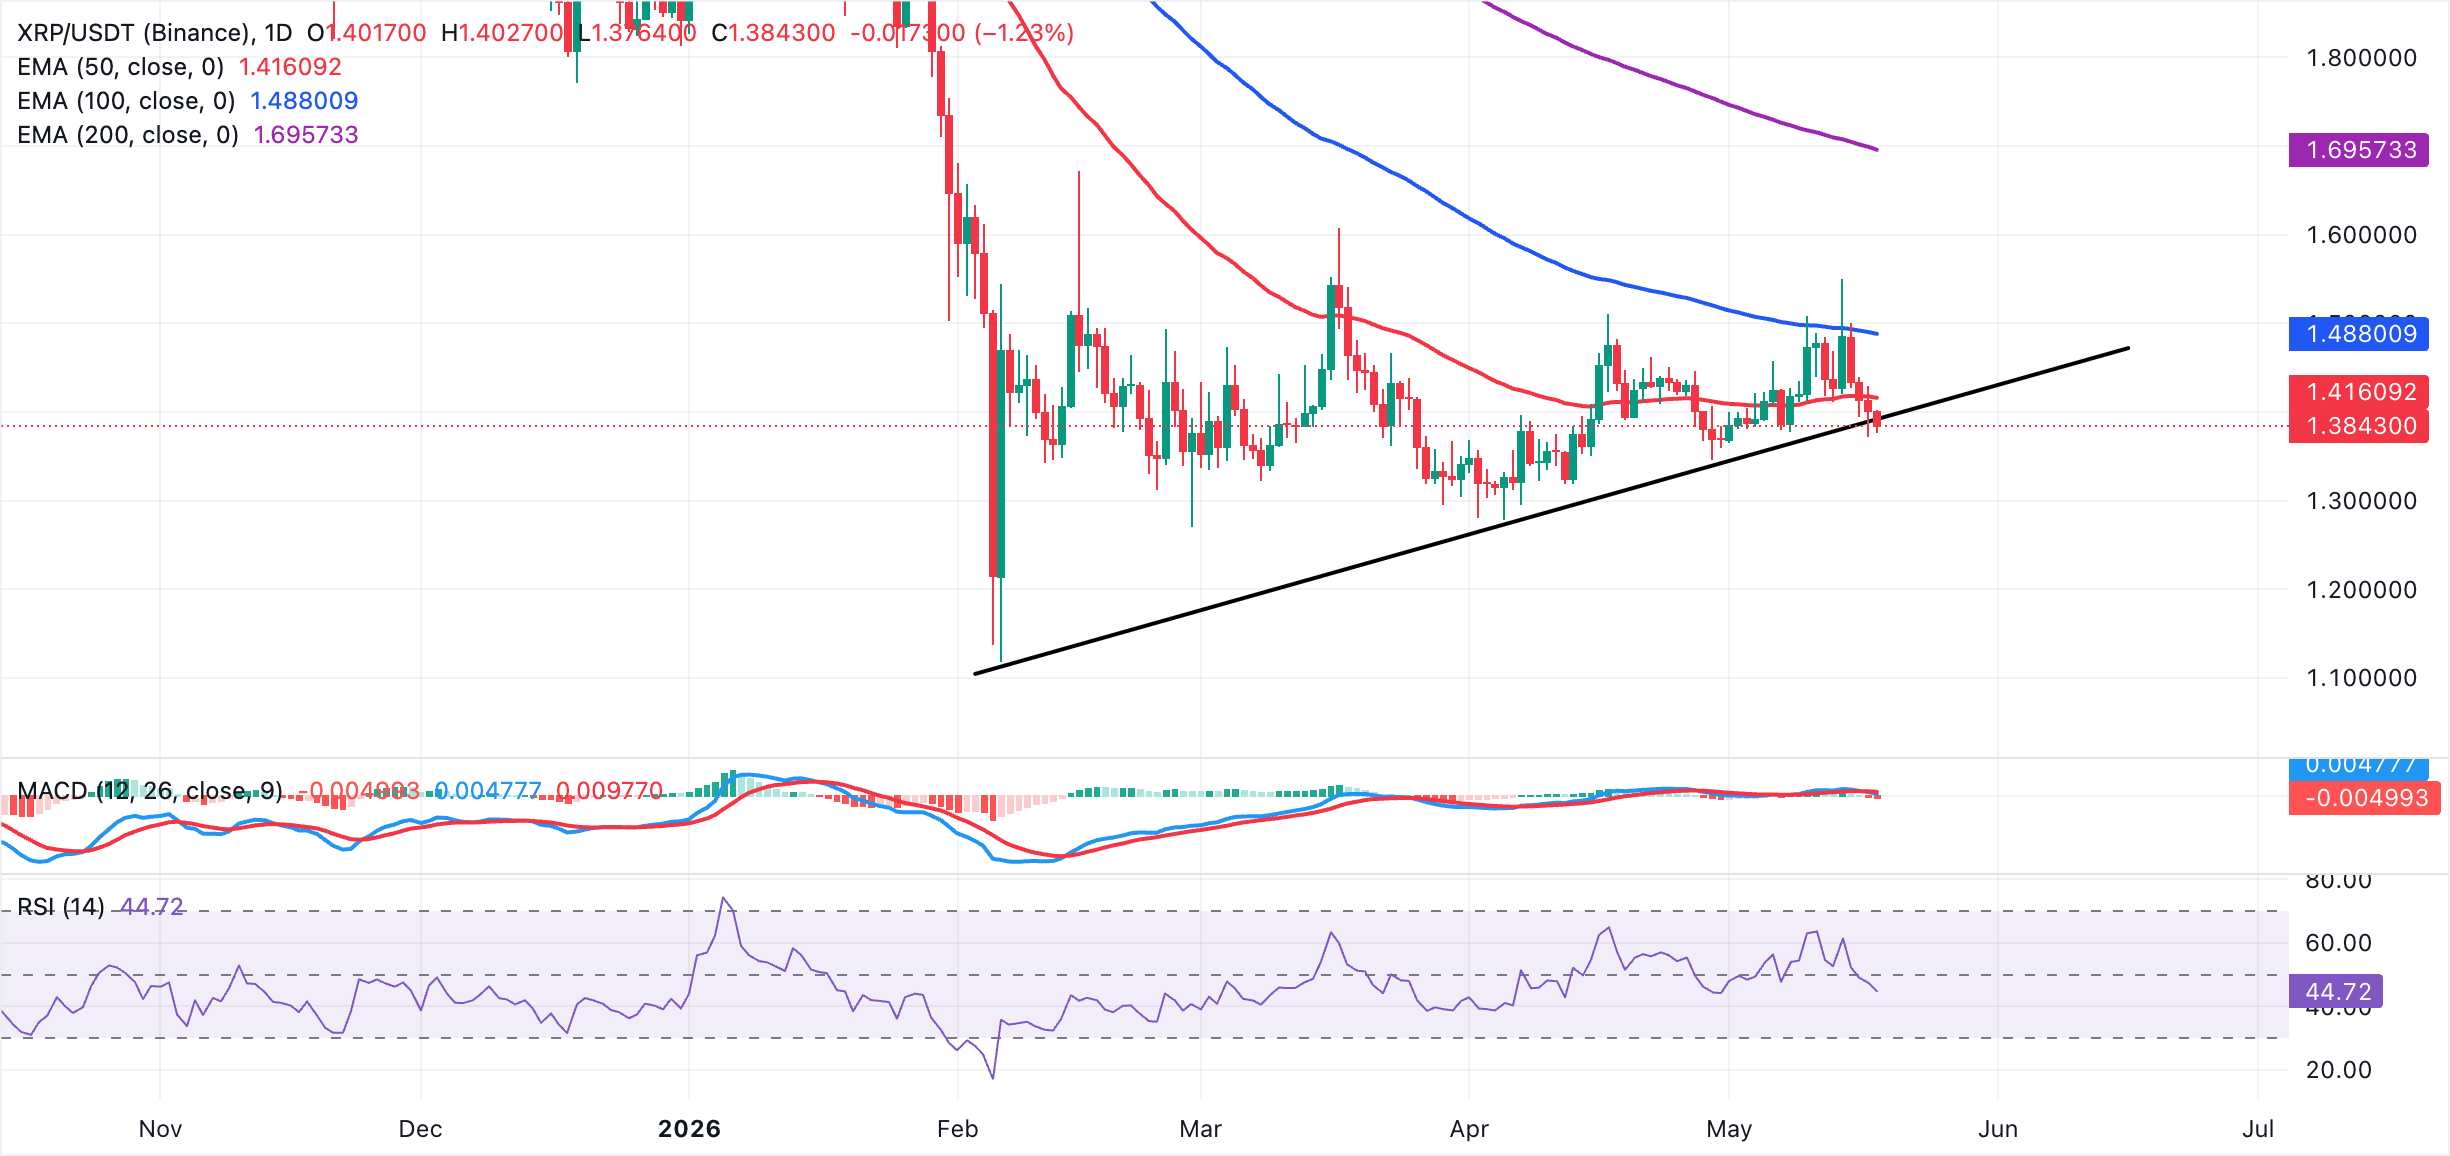
On the topside, immediate resistance lies at the ascending trendline near $1.39, where failure to regain traction would keep the short-term bias under pressure. A sustained move above this pivot would expose the above-mentioned major EMAs. A broader look at the daily chart reveals short-term support at $1.35, followed by $1.30 if the sell-off persists.
(The technical analysis of this story was written with the help of an AI tool.)
Crypto ETF FAQs
An Exchange-Traded Fund (ETF) is an investment vehicle or an index that tracks the price of an underlying asset. ETFs can not only track a single asset, but a group of assets and sectors. For example, a Bitcoin ETF tracks Bitcoin’s price. ETF is a tool used by investors to gain exposure to a certain asset.
Yes. The first Bitcoin futures ETF in the US was approved by the US Securities & Exchange Commission in October 2021. A total of seven Bitcoin futures ETFs have been approved, with more than 20 still waiting for the regulator’s permission. The SEC says that the cryptocurrency industry is new and subject to manipulation, which is why it has been delaying crypto-related futures ETFs for the last few years.
Yes. The SEC approved in January 2024 the listing and trading of several Bitcoin spot Exchange-Traded Funds, opening the door to institutional capital and mainstream investors to trade the main crypto currency. The decision was hailed by the industry as a game changer.
The main advantage of crypto ETFs is the possibility of gaining exposure to a cryptocurrency without ownership, reducing the risk and cost of holding the asset. Other pros are a lower learning curve and higher security for investors since ETFs take charge of securing the underlying asset holdings. As for the main drawbacks, the main one is that as an investor you can’t have direct ownership of the asset, or, as they say in crypto, “not your keys, not your coins.” Other disadvantages are higher costs associated with holding crypto since ETFs charge fees for active management. Finally, even though investing in ETFs reduces the risk of holding an asset, price swings in the underlying cryptocurrency are likely to be reflected in the investment vehicle too.
Bài viết đề xuất


