

Bitcoin Price Forecast: BTC holds at $75,000 as strong ETF inflows offset renewed woes over Hormuz
- Bitcoin edges up to around $75,000 on Monday after losing more that 4% over the weekend.
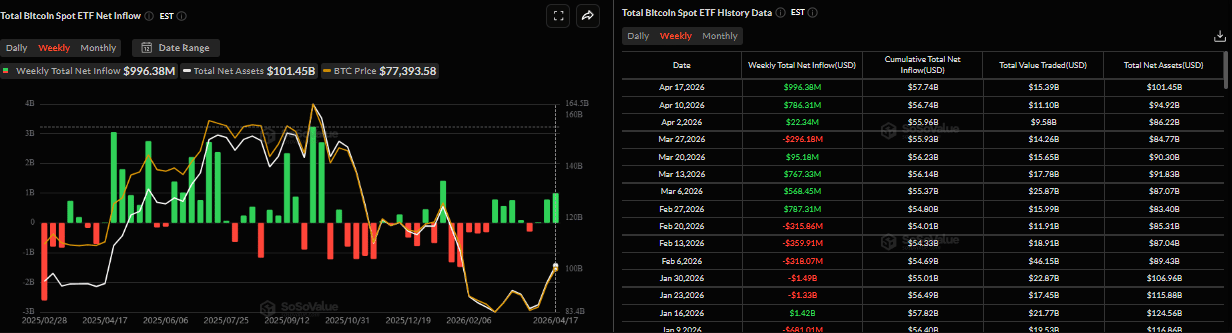
- US-listed spot ETFs recorded inflows of nearly $1 billion last week, the highest level since mid-January.
- Renewed tensions between the US and Iran over the Strait of Hormuz temper hopes for further peace talks, weighing on BTC’s price outlook.
Bitcoin (BTC) edges higher and trades around $75,000 on Monday after losing nearly 4.30% over the weekend, as renewed tensions between the US and Iran over the Strait of Hormuz hampered risk sentiment. Meanwhile, institutional demand remained strong last week, with spot Exchange Traded Funds (ETFs) recording inflows of nearly $1 billion, signaling renewed institutional demand.
US-Iran renewed tension tempered hopes for further peace talks
Bitcoin price starts the week on a cautious note, following the events that led the largest cryptocurrency by market capitalization to correct more than 4% over the weekend.
The US-Iran standoff over the Strait of Hormuz tempered hopes for more peace talks before the current ceasefire ends on April 22. The US Navy intercepted and seized an Iranian-flagged cargo ship in the Gulf of Oman as part of its blockade. Iran viewed this as a breach of the ceasefire agreement and once again closed the strategic waterway after briefly opening it following a 10-day truce between Israel and Lebanon on Friday.
Meanwhile, US President Donald Trump said that the naval blockade of Iranian ports would continue until a peace deal was agreed between the two countries.
These renewed tensions in the Middle East have dampened risk sentiment, with West Texas Intermediate (WTI), the US crude oil benchmark, trading above $88 during European trading hours, up nearly 5% on Monday. Bitcoin saw a slight pullback on Sunday, but it is now trading around $75,000 as of writing on Monday.
Institutional demand records strong inflow
Institutional demand supported BTC’s price last week. SoSoValue data showed that spot Bitcoin ETFs recorded inflows of $996.38 million last week, marking the third consecutive week of positive flows and the highest weekly inflow since mid-January. If these inflows continue and intensify, BTC could see a price rally ahead.
Some other signs of optimism
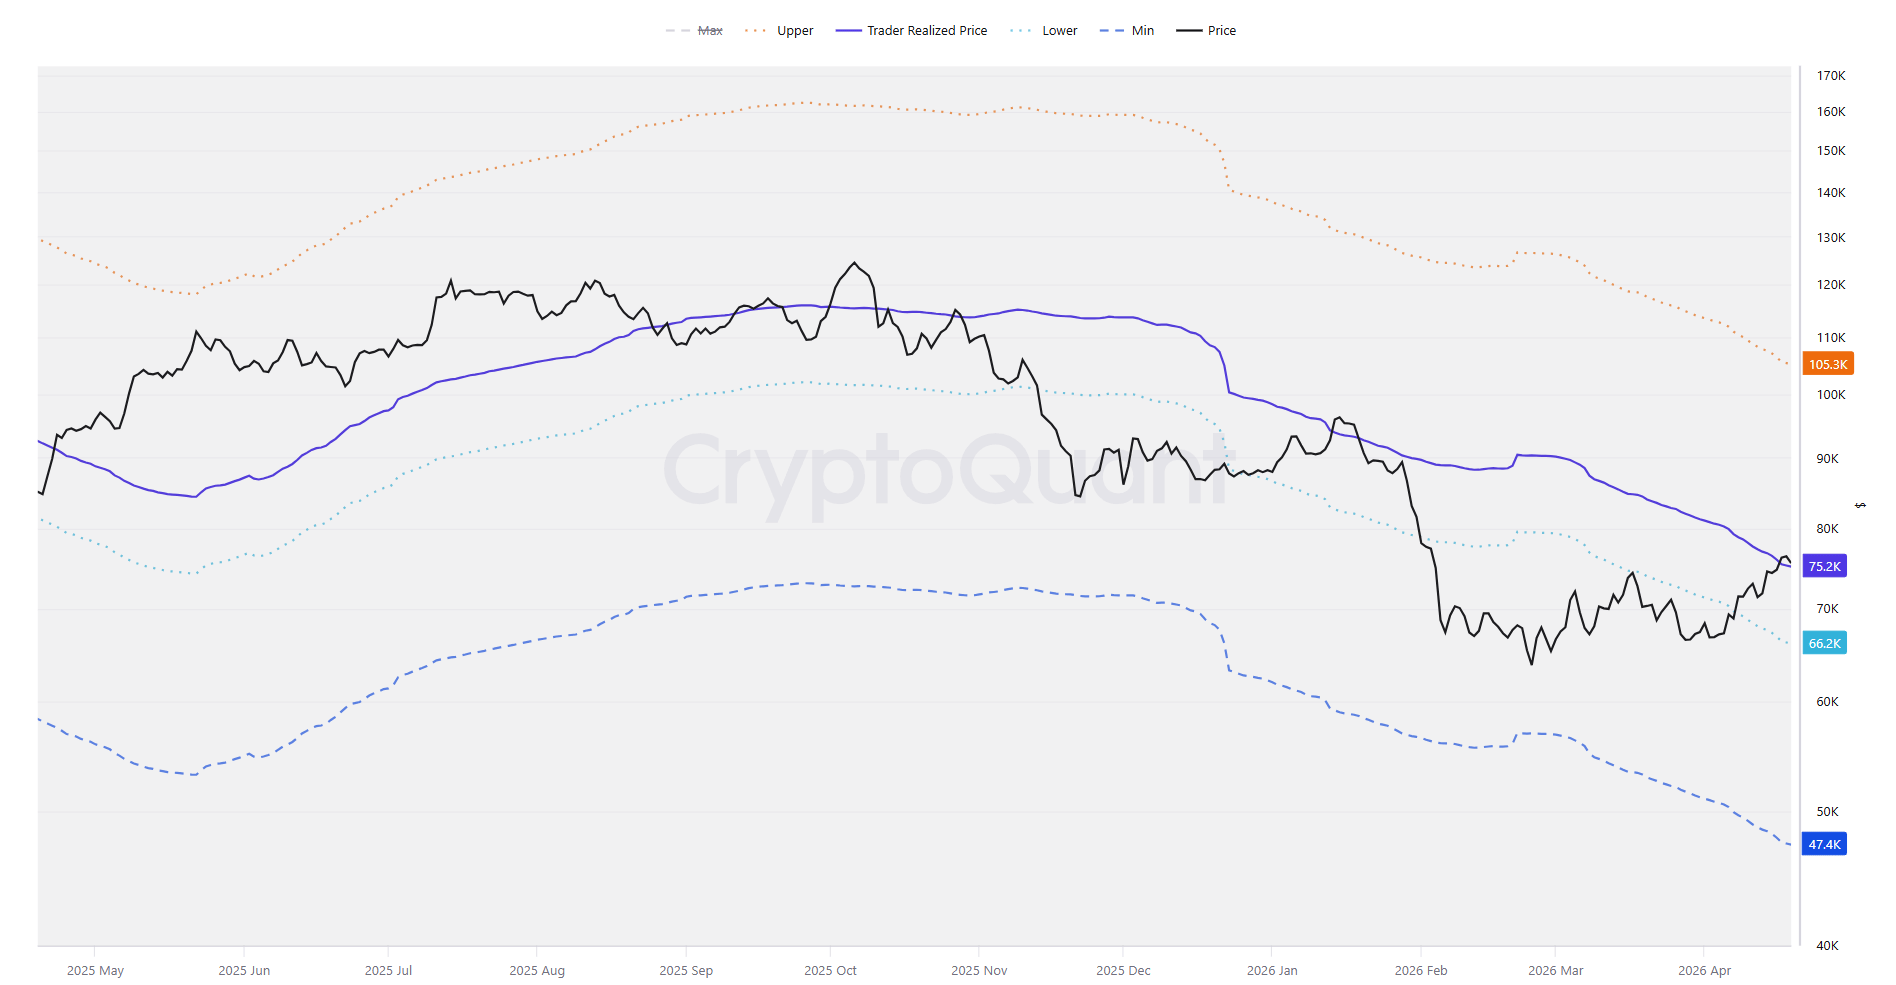
As explained in the previous Bitcoin weekly forecast report, BTC closed above the Trader Realized Price (around $75,200), which has historically capped relief rallies. If the BTC price holds above this level, it could extend its rally in the coming days.
Bitcoin Price Forecast: BTC’s price action looks promising
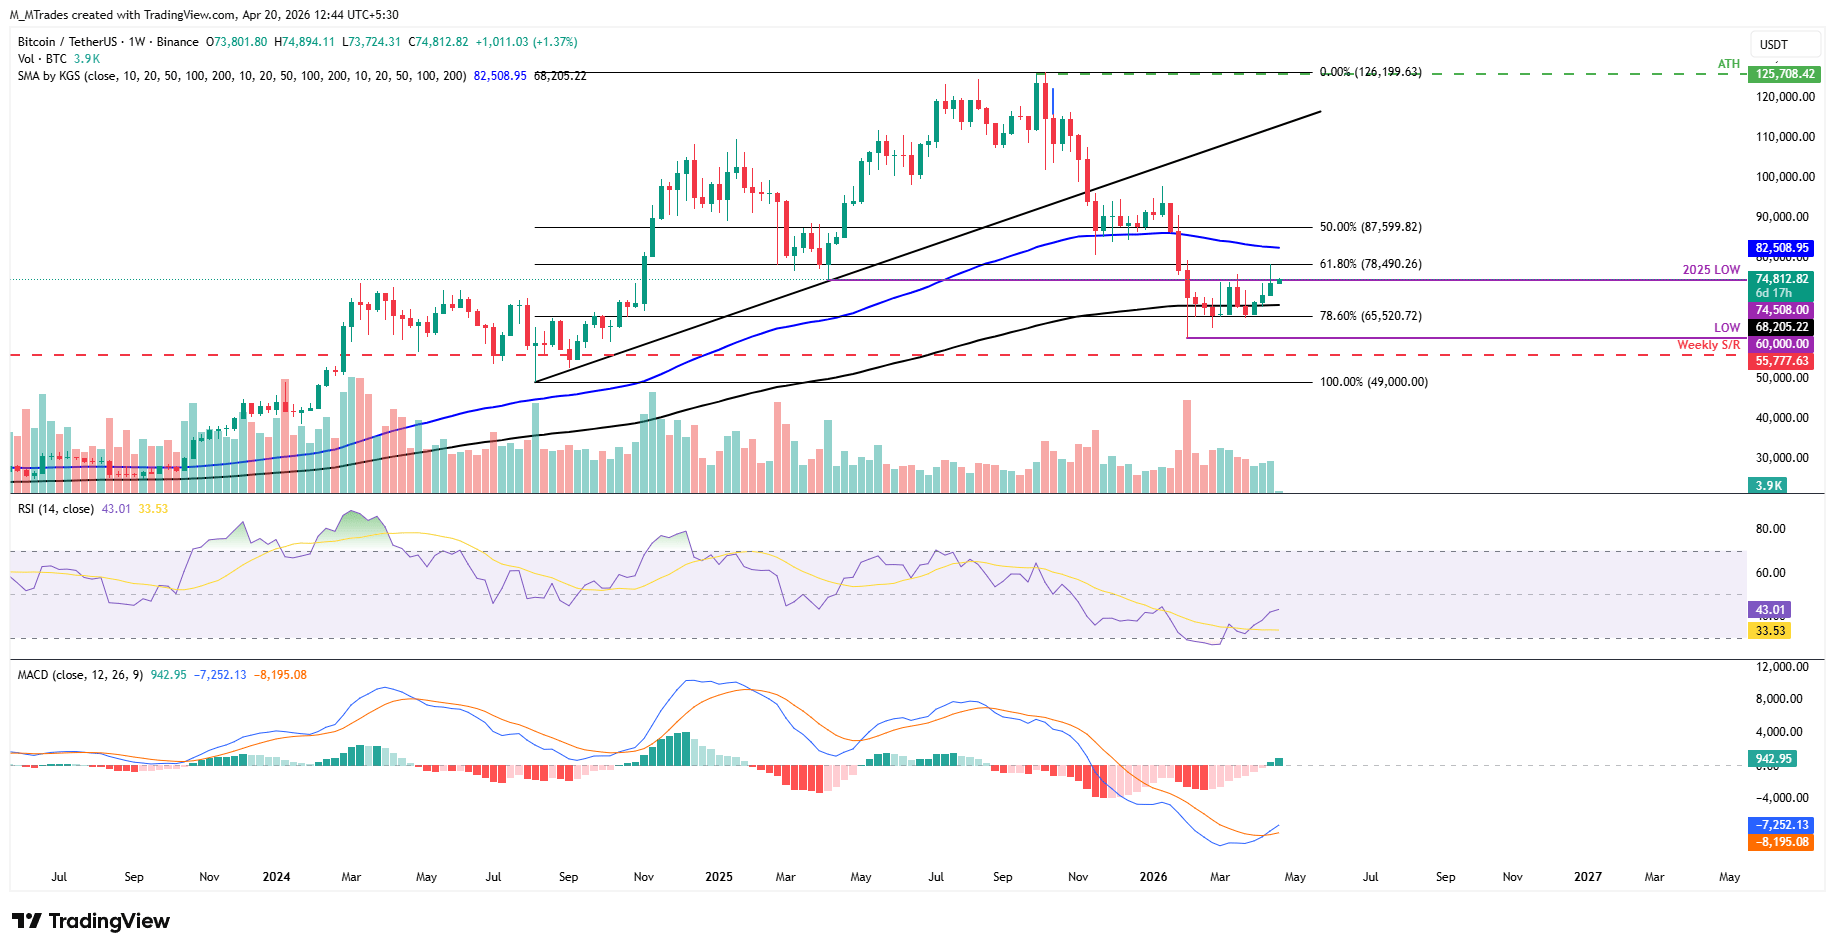
The Crypto King rose 4.33% and reached its 11-week high of $78,333 last week before correcting lower over the weekend. As of Monday, BTC is trading near $75,000.
If BTC continues its upward move, it could extend the rally toward the 61.8% Fibonacci retracement level at $78,490 (drawn from the August 2024 low of $49,000 to the October 2025 all-time high of $126,199).
The Relative Strength Index (RSI) reads 43 on the weekly chart, pointing upward toward the neutral level of 50 after recovering from oversold territory, indicating fading bearish momentum. The Moving Average Convergence Divergence (MACD) indicator on the same chart showed a bullish crossover last week, with a positive histogram supporting the bullish thesis.
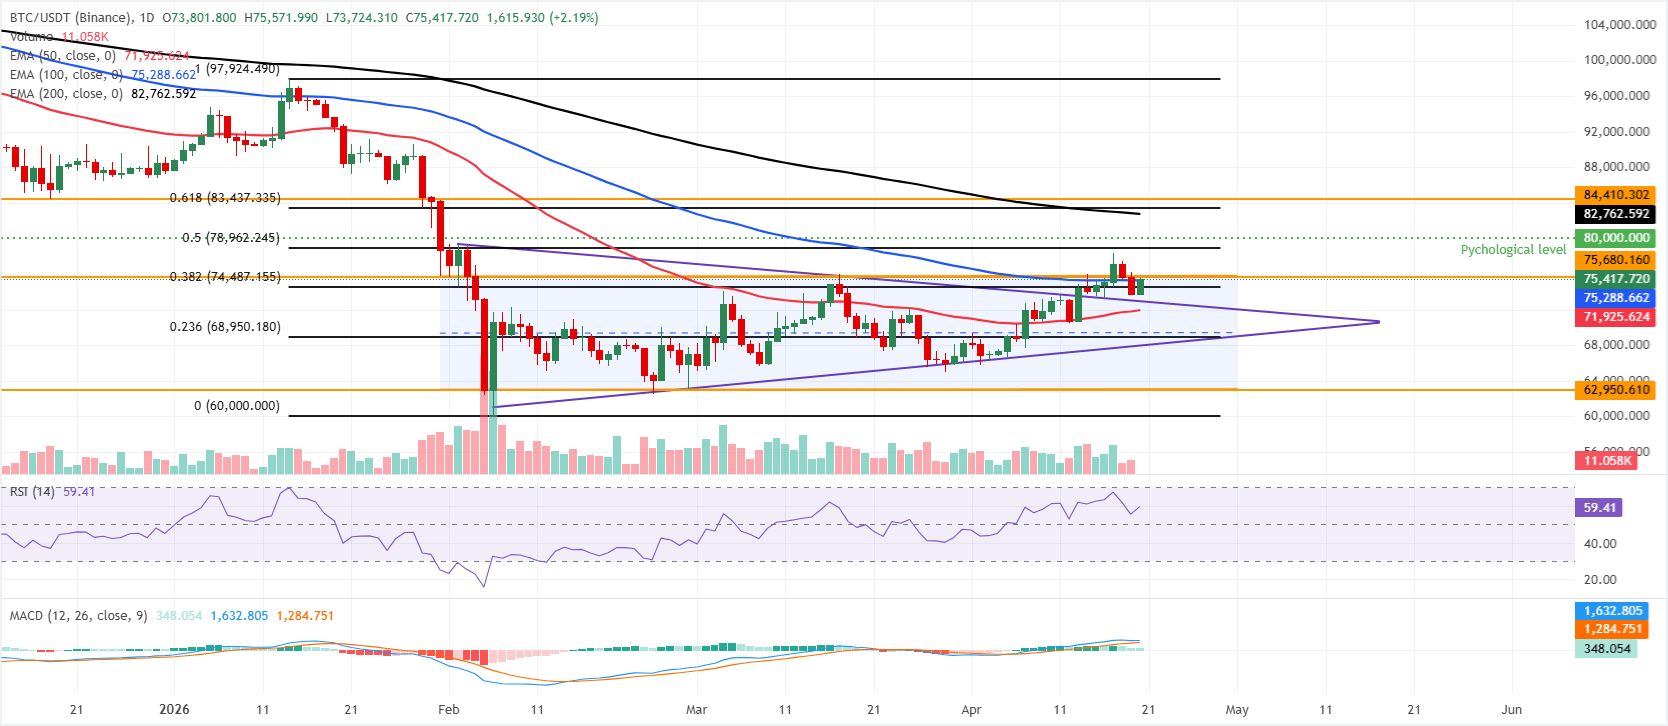
On the daily chart, the previously broken ascending triangle pattern (drawn by connecting highs and lows with two trendlines since early February) near $73,400, continues to show a constructive outlook.
The RSI on the daily chart hovers near 59, and the MACD histogram remains positive, both suggesting firm bullish momentum as long as BTC holds above the breakout point near $73,400.
On the downside, initial support is seen at the 50-day Exponential Moving Average (EMA) at $71,925. A deeper pullback would expose the 23.6% Fibonacci retracement at $68,950 (drawn from the January 14 high to the February 6 low), the rising trendline support (triangle pattern) near $67,412, and ultimately the more distant horizontal floor around $62,950.
On the topside, a sustained close above the 100-day EMA around $75,288 and the nearby $75,680 horizontal resistance would open the door toward the 50% retracement at $78,962 and the psychological $80,000 mark.
(The technical analysis of this story was written with the help of an AI tool.)
Bitcoin, altcoins, stablecoins FAQs
Bitcoin is the largest cryptocurrency by market capitalization, a virtual currency designed to serve as money. This form of payment cannot be controlled by any one person, group, or entity, which eliminates the need for third-party participation during financial transactions.
Altcoins are any cryptocurrency apart from Bitcoin, but some also regard Ethereum as a non-altcoin because it is from these two cryptocurrencies that forking happens. If this is true, then Litecoin is the first altcoin, forked from the Bitcoin protocol and, therefore, an “improved” version of it.
Stablecoins are cryptocurrencies designed to have a stable price, with their value backed by a reserve of the asset it represents. To achieve this, the value of any one stablecoin is pegged to a commodity or financial instrument, such as the US Dollar (USD), with its supply regulated by an algorithm or demand. The main goal of stablecoins is to provide an on/off-ramp for investors willing to trade and invest in cryptocurrencies. Stablecoins also allow investors to store value since cryptocurrencies, in general, are subject to volatility.
Bitcoin dominance is the ratio of Bitcoin's market capitalization to the total market capitalization of all cryptocurrencies combined. It provides a clear picture of Bitcoin’s interest among investors. A high BTC dominance typically happens before and during a bull run, in which investors resort to investing in relatively stable and high market capitalization cryptocurrency like Bitcoin. A drop in BTC dominance usually means that investors are moving their capital and/or profits to altcoins in a quest for higher returns, which usually triggers an explosion of altcoin rallies.
Bài viết đề xuất


