

Ripple Price Forecast: XRP holds modest gains as open interest hits one-year low
- XRP edges higher above $1.43 as the broader crypto market generally rebounds.
- Investor risk appetite appears limited, with inflows into US-listed XRP spot ETFs steady at $3 million on Wednesday.
- XRP derivatives remain weak, with futures open interest at its lowest level since January 2025.
Ripple (XRP) rises alongside major crypto assets to trade above $1.43 at the time of writing on Thursday. The slow but steady recovery comes after the remittance token declined to a weekly low of $1.31 on Tuesday, as investors navigated key changes in the United States (US) tariff policy.
However, the short-term bullish outlook warrants a cautious approach as institutional interest remains relatively low amid a significant decline in retail demand.
XRP trades amid mixed signals, mild institutional interest and muted retail demand
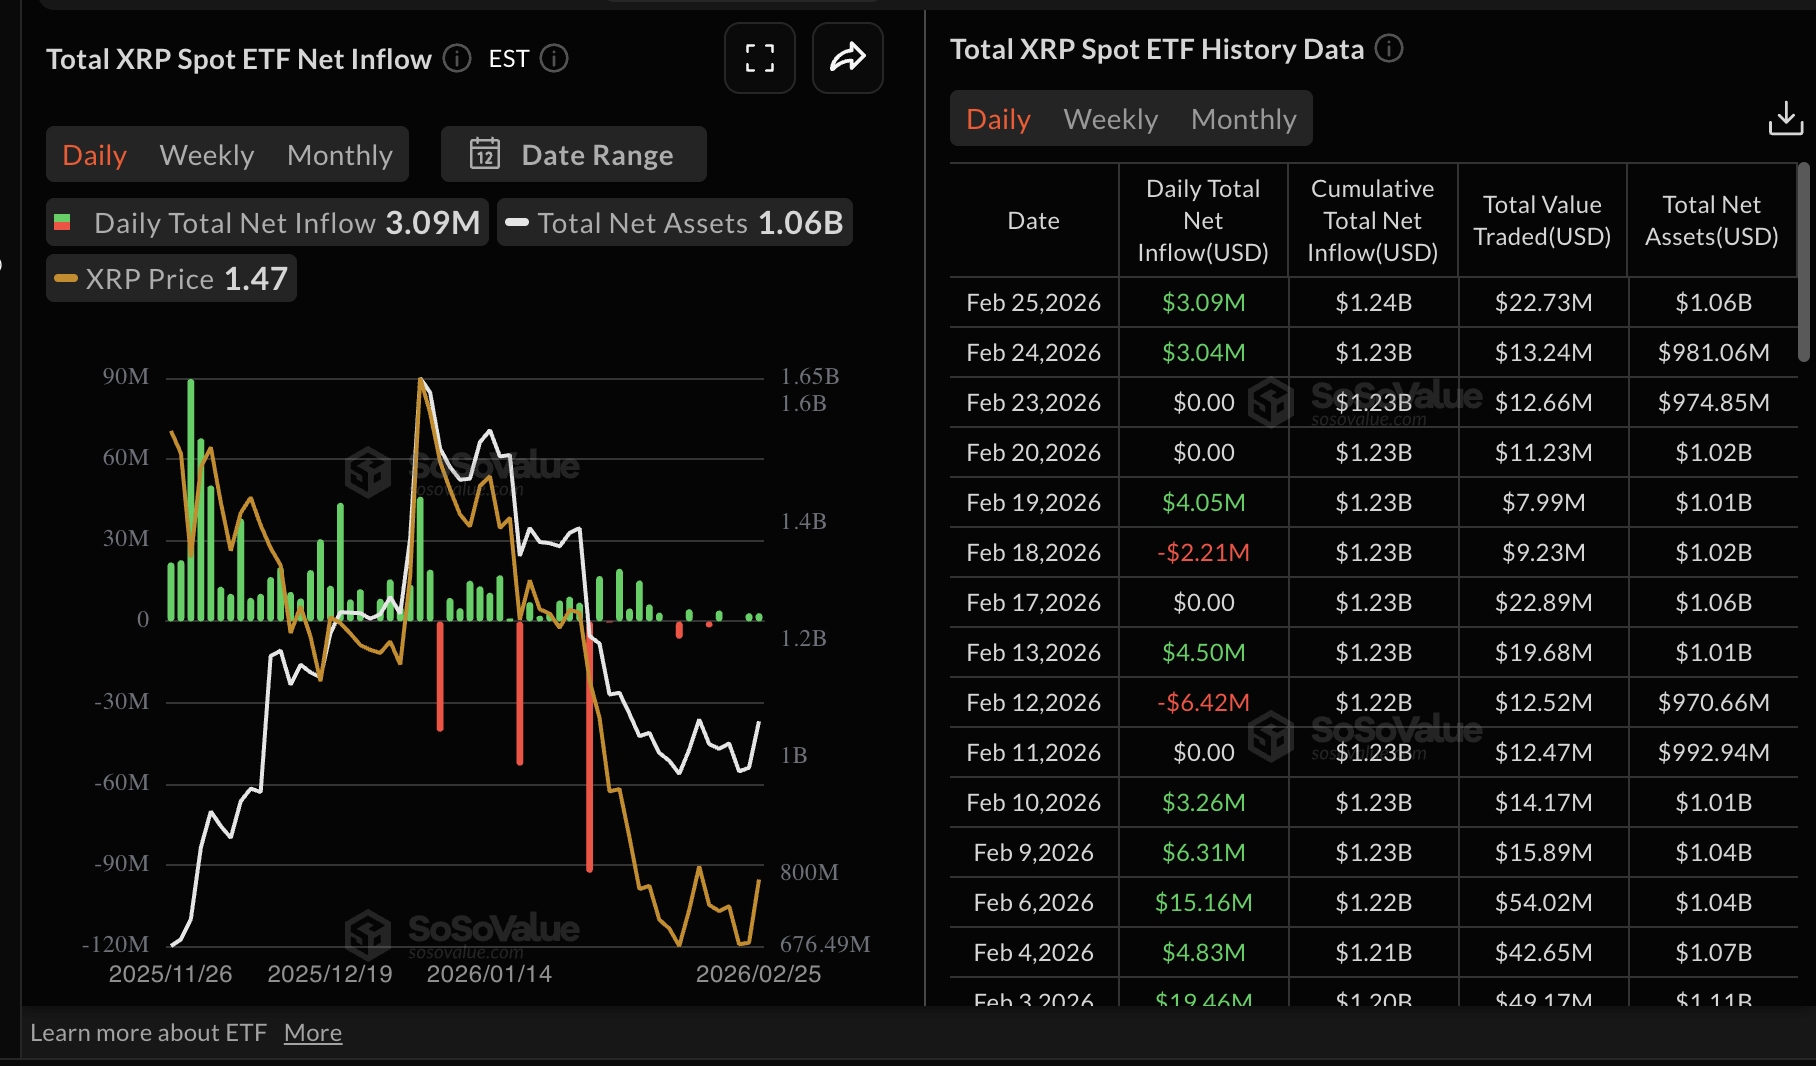
XRP spot Exchange-Traded Funds (ETFs) sustained a second consecutive day of inflows totaling $3.09 million on Wednesday from $3.04 million the previous day. According to SoSoValue data, Bitwise XRP ETF led with $2.3 million in inflows, followed by Franklin Templeton’s XRPZ with approximately $796,000. The rest of the ETFs remained quiet with no activity recorded.
Cumulative inflows stand at $1.24 billion, with net assets under management at $1.06 billion. Despite the minor increase, net assets remain significantly below the record $1.65 billion seen in January.
A steady increase in ETF inflows is required to spur risk appetite and improve sentiment surrounding XRP.
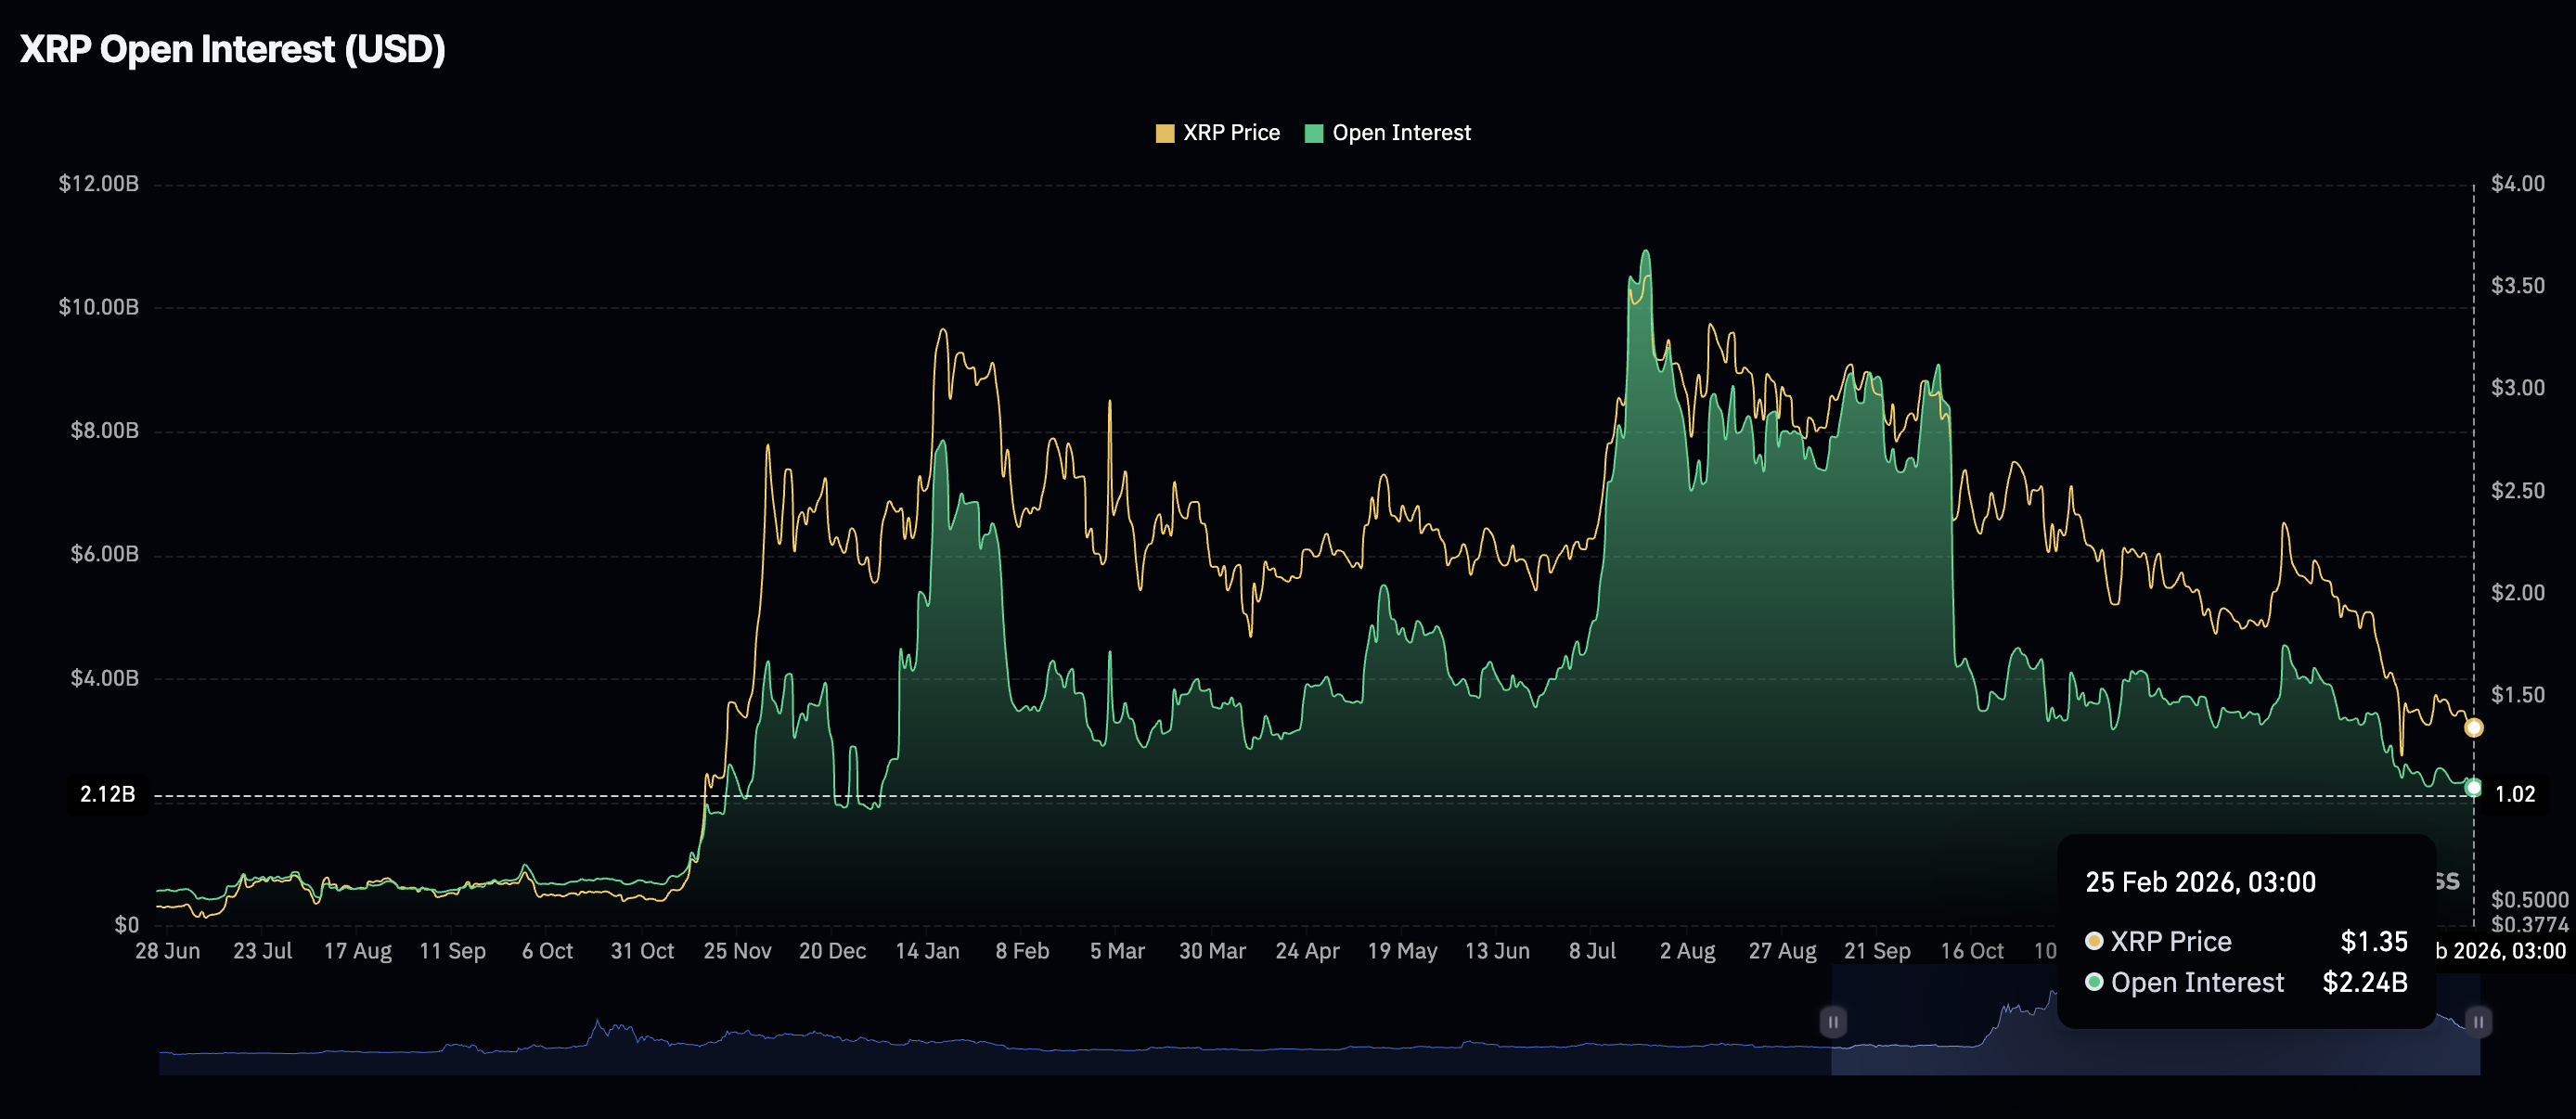
Meanwhile, retail interest in XRP is at the back foot, with futures Open Interest (OI) persistently falling to $2.24 billion on Thursday. This is the lowest level since January 2025, when XRP traded between $1.40 and $1.50.
In contrast, OI hit a record $10.94 billion in July, coinciding with the current all-time high of $3.66. A further decline in OI could limit XRP’s short to medium-term outlook.
Technical outlook: Where does XRP go from here?
XRP is trading above $1.43 as bulls tighten their grip following early week volatility. Rising modestly for the second consecutive day, the remittance token is eyeing a short-term breakout above $1.54, where recovery attempts were contained on February 6.
The Moving Average Convergence Divergence (MACD) indicator is above its signal line but below the zero line on the daily chart, suggesting improving but still fragile momentum.
At the same time, the Relative Strength Index (RSI) at 44 remains below the midline, reinforcing the idea of subdued buying pressure within a broader downtrend.
-1772107478919-1772107478921.png)
Immediate resistance emerges at the recent reaction high near $1.54, with further upside capped by the 50-day Exponential Moving Average (EMA) around $1.63 and the descending trend-line from the record high of $3.66.
A daily close above $1.54 would weaken the current bearish bias and potentially expose the first initial moving average supply zone at $1.63. On the downside, initial support lies at $1.40, followed by this week’s trough near $1.31 and then the October 10 low at $1.25.
Open Interest, funding rate FAQs
Higher Open Interest is associated with higher liquidity and new capital inflow to the market. This is considered the equivalent of increase in efficiency and the ongoing trend continues. When Open Interest decreases, it is considered a sign of liquidation in the market, investors are leaving and the overall demand for an asset is on a decline, fueling a bearish sentiment among investors.
Funding fees bridge the difference between spot prices and prices of futures contracts of an asset by increasing liquidation risks faced by traders. A consistently high and positive funding rate implies there is a bullish sentiment among market participants and there is an expectation of a price hike. A consistently negative funding rate for an asset implies a bearish sentiment, indicating that traders expect the cryptocurrency’s price to fall and a bearish trend reversal is likely to occur.
(The technical analysis of this story was written with the help of an AI tool.)
Bài viết đề xuất


