


Cardano Price Forecast: ADA slips below $0.36 as geopolitical tensions pressure risk assets
- Cardano price extends correction on Thursday, building on losses from the previous day.
- Rising geopolitical tensions between the US and Iran continue to weigh on risk appetite.
- Technical outlook warns of further downside, with ADA potentially retesting the December 31 low near $0.32.
Cardano (ADA) price extends losses, trading below $0.36 on Thursday after a correction on the previous day. Risk sentiment continues to weaken with rising geopolitical tensions between the US and Iran, pressuring risk assets such as ADA. On the technical side, the ongoing pullback raises the risk of further downside, with ADA potentially revisiting its December 31 low around $0.32 if selling pressure persists.
Rising US-Iran tensions weigh on risk appetite
Reuters reported on Thursday that US President Donald Trump is weighing options against Iran that include targeted strikes on security forces and leaders to inspire protesters.
“The arrival of a US aircraft carrier and supporting warships in the Middle East this week has expanded Trump’s capabilities to potentially take military action, after he repeatedly threatened intervention over Iran’s crackdown,” said the report.
On Wednesday, Trump urged Iran to come to the table and make a deal on nuclear weapons, warning that any future US attack would be more severe than a June bombing campaign. Iran responded with a threat to strike back against the US, Israel and those who support them.
These growing geopolitical tensions have triggered a risk-off sentiment among investors, which does not bode well for risky assets, such as Cardano, which has remained under pressure since midweek.
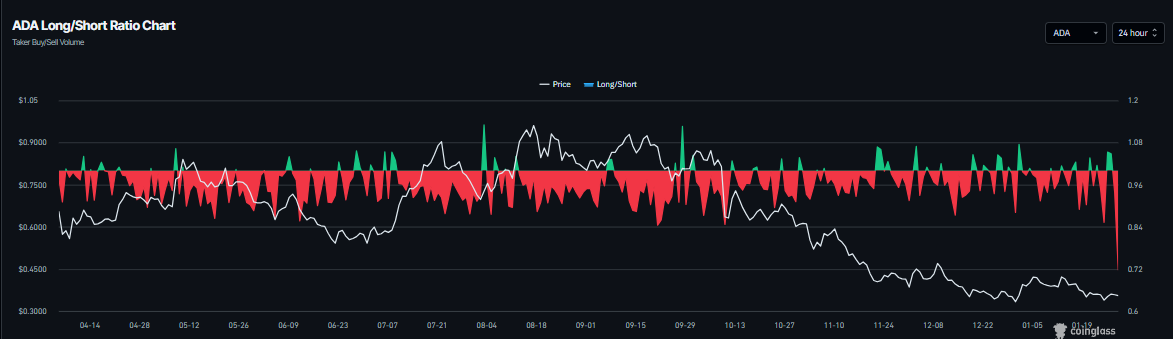
Moreover, the derivatives data also supports a bearish outlook for Cardano in the near term. CoinGlass long-to-short ratio for ADA reads 0.71 on Thursday, the highest short bets in over a month. The ratio below one indicates that traders are betting on the asset’s price to fall.
Cardano Price Forecast: Why ADA could face a deeper correction?
Cardano price started the week on a positive note, recovering nearly 6% by Tuesday after a 9.77% correction the previous week. However, ADA failed to sustain the recovery and declined slightly midweek, resuming its downward trend. As of Thursday, ADA is continuing its pullback, trading at $0.35.
If ADA continues its downward trend, it could extend the decline toward the December 31 low of $0.32. A close below this level could extend a deeper correction toward the October 10 low of $0.27.
The Relative Strength Index (RSI) on the daily chart reads 43, pointing downward after falling to close above the neutral level of 50, indicating bearish momentum gaining traction. However, the Moving Average Convergence Divergence (MACD) lines are converging, with fading red histogram bars below the neutral value, signaling a slight fading bearish strength.
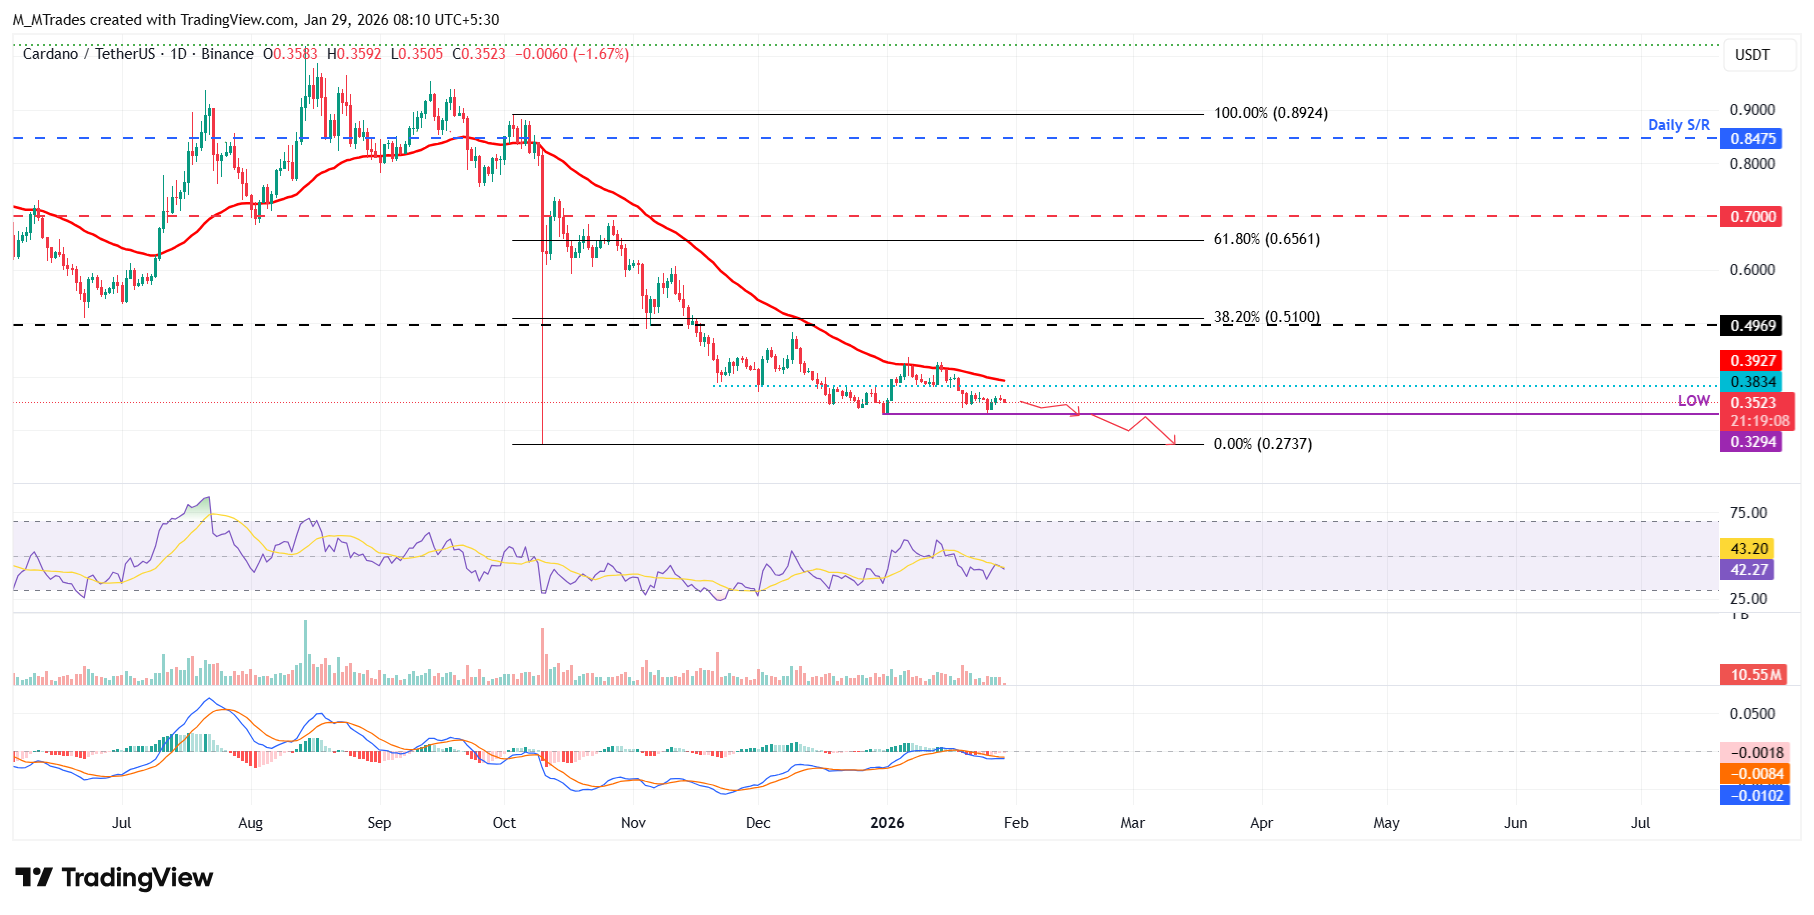
On the other hand, if ADA recovers, it could extend the advance toward the next daily resistance at $0.38.
Bài viết đề xuất


