

Bitcoin price dips seven days to BTC halving, whiplashes nearly $1 billion in positions
- Bitcoin price has reverted to the depths of $65,000, levels last seen on April 5.
- Altcoins dipped with BTC to record double-digit losses as Ethereum lost 10%.
- Over $880 million position were liquidated seven days to Bitcoin halving.
Bitcoin (BTC) price shocked markets on Friday during the early hours of the US session. BTC shorts and longs alike were caught off guard in a move that whiplashed cryptocurrency market players from both biases in the millions. Of interest is that it happened only seven days to the much-anticipated BTC halving.
Also Read: Bitcoin dramatic downward shift sends altcoins into double-digit losses
Nearly $1 billion in liquidations as Bitcoin price dips
Bitcoin price reverted back to levels as low as $65,086 during the opening hours of the New York session, in a move that caught many traders by surprise. Data according to information center Coinglass indicates over $881 million in total liquidations, composed$784 million in long positions against $96 million in short positions.
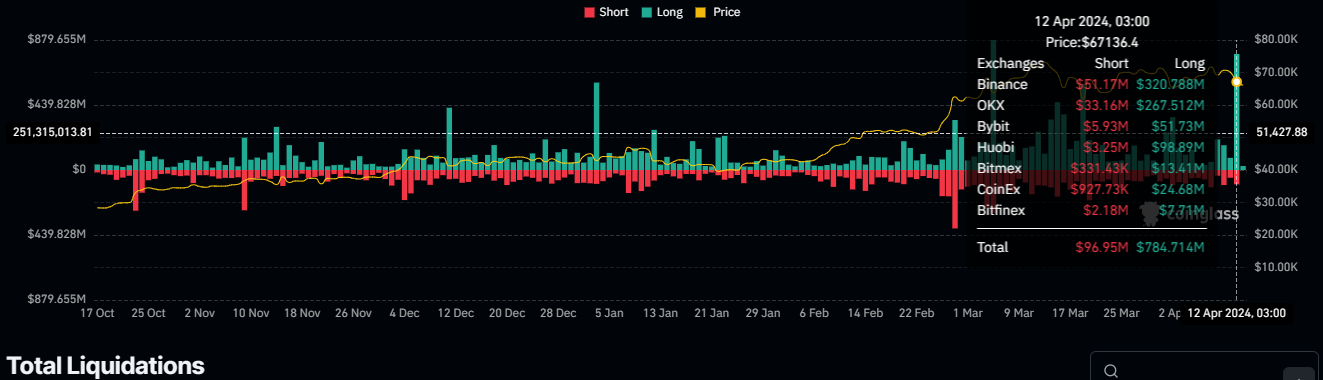
Total liquidations
More closely, over $126 million BTC long positions were blown out of the water against $41 million in shorts.
As bad as it was, however, the steady hands who resisted FOMO even when Bitcoin price reclaimed the $72,700 levels on Monday have had their patience rewarded. Coming only a week to the halving, the downswing could be a good buy opportunity for the late bulls as well as those who had otherwise written themselves off as sidelined as BTC ascended past the $69,000 threshold.
Judging from the BTC/USDT 1-day chart, Bitcoin price may not be due for a recovery soon, at least not this weekend as multiple technical indicators lean in favor of the bears. For starters, the Relative Strength Index (RSI) remains below the ‘50’ mean level. It is also flanked with the Awesome Oscillator (AO) and the Moving Average Convergence Divergence (MACD), which are thinly holding above the mean level to their respective negative territories.
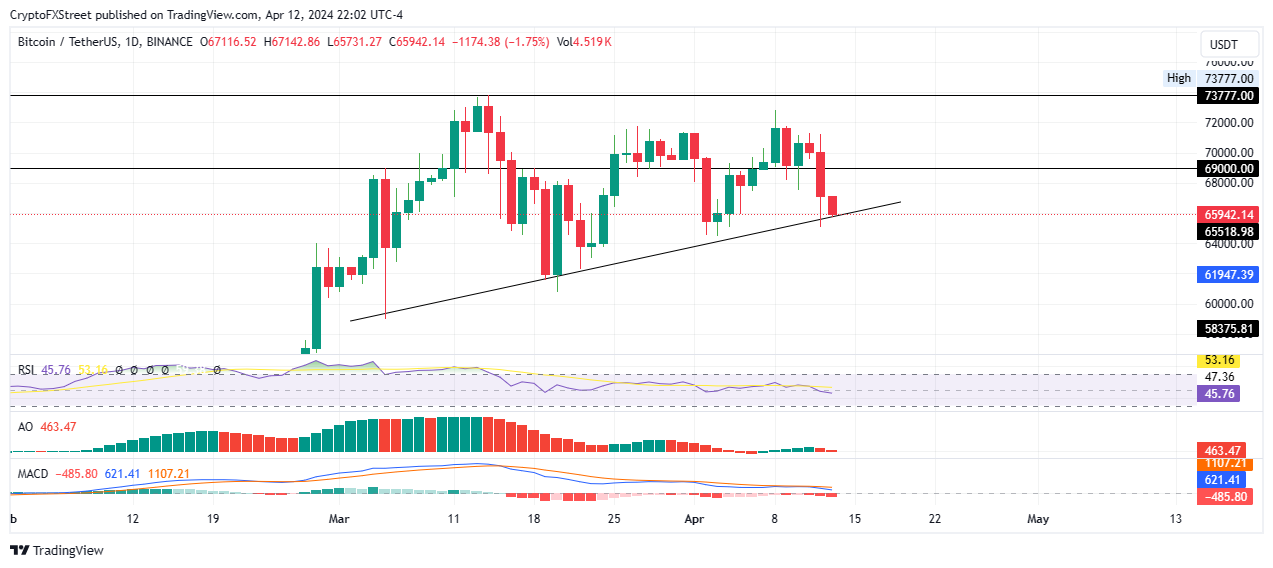
BTC/USDT 1-day chart
Meanwhile, one analysts on X, @DaanCrypto, observes that Bitcoin price is building up a pretty large liquidity zone at the $72,000 region. With positions building on both sides, the recent move is unsurprising and may have set the tone for yet another to come with markets preparing for the BTC halving in a week.
Bitcoin, altcoins, stablecoins FAQs
Bitcoin is the largest cryptocurrency by market capitalization, a virtual currency designed to serve as money. This form of payment cannot be controlled by any one person, group, or entity, which eliminates the need for third-party participation during financial transactions.
Altcoins are any cryptocurrency apart from Bitcoin, but some also regard Ethereum as a non-altcoin because it is from these two cryptocurrencies that forking happens. If this is true, then Litecoin is the first altcoin, forked from the Bitcoin protocol and, therefore, an “improved” version of it.
Stablecoins are cryptocurrencies designed to have a stable price, with their value backed by a reserve of the asset it represents. To achieve this, the value of any one stablecoin is pegged to a commodity or financial instrument, such as the US Dollar (USD), with its supply regulated by an algorithm or demand. The main goal of stablecoins is to provide an on/off-ramp for investors willing to trade and invest in cryptocurrencies. Stablecoins also allow investors to store value since cryptocurrencies, in general, are subject to volatility.
Bitcoin dominance is the ratio of Bitcoin's market capitalization to the total market capitalization of all cryptocurrencies combined. It provides a clear picture of Bitcoin’s interest among investors. A high BTC dominance typically happens before and during a bull run, in which investors resort to investing in relatively stable and high market capitalization cryptocurrency like Bitcoin. A drop in BTC dominance usually means that investors are moving their capital and/or profits to altcoins in a quest for higher returns, which usually triggers an explosion of altcoin rallies.
Bài viết đề xuất


