


Ripple and Stellar outlook: Key breakouts could fuel the next rally
- XRP nears the key resistance at $1.52 on Tuesday, where a close above suggests further gains.
- XLM extends gains after holding strong above the 200-day EMA at $0.190, keeping the upside bias intact.
- Mixed on-chain signals with a mild bearish bias keep traders cautious for both altcoins.
Ripple (XRP) and Stellar (XLM) are showing signs of renewed strength after rallying over 53% and 27% in the previous week. Meanwhile, both altcoins are approaching key technical levels on Tuesday that could determine their next move. However, mixed on-chain signals with a slight bearish tilt suggest traders remain cautious amid the recent price gains.
On-chain data shows mixed bias
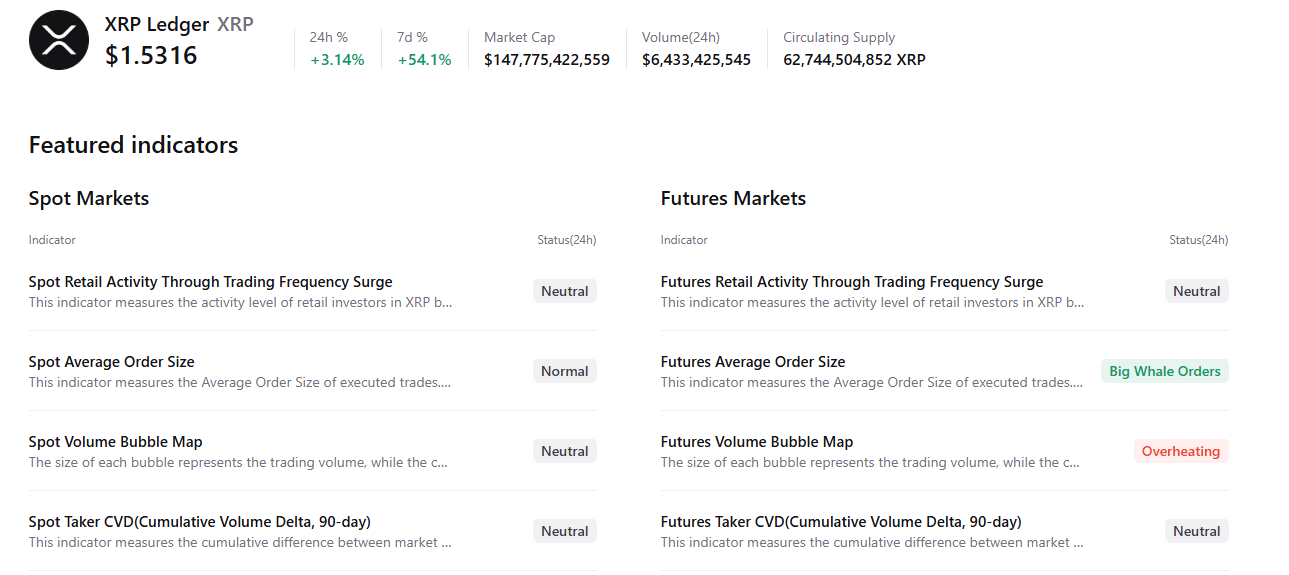
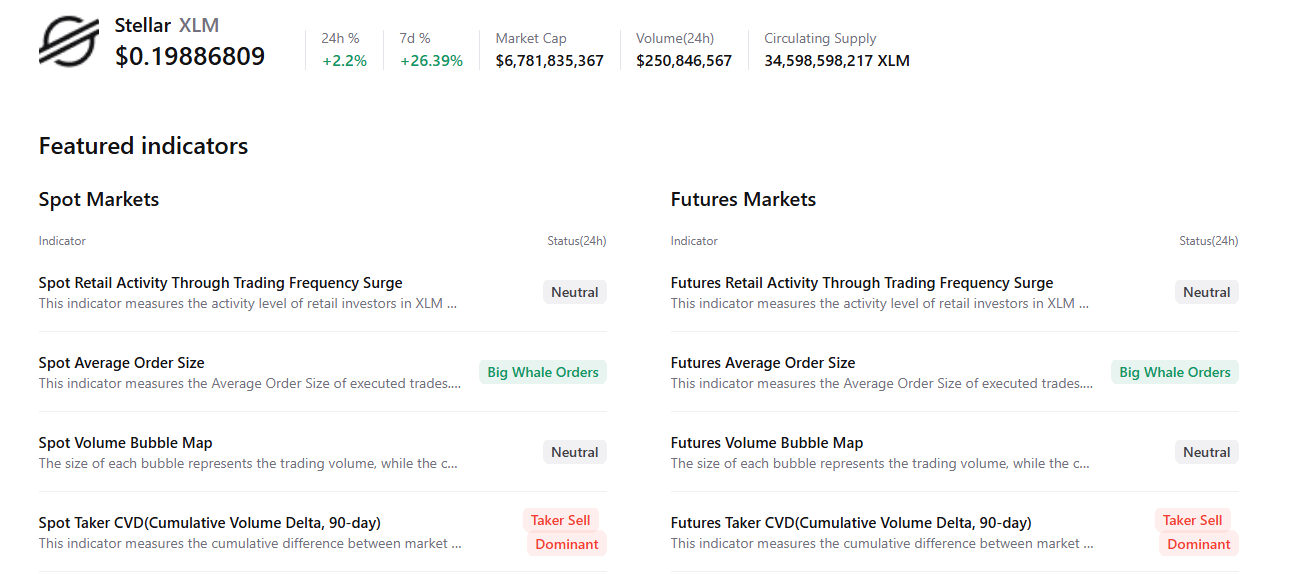
CryptoQuant’s summary data shows cautious optimism. XRP’s futures markets show large whale orders but overheating conditions after the recent price surge. Other metrics remain neutral, highlighting a mixed sentiment among traders.
Meanwhile, XLM shows selling-side dominance in both markets and large whale orders, hinting at cautious sentiment among traders.
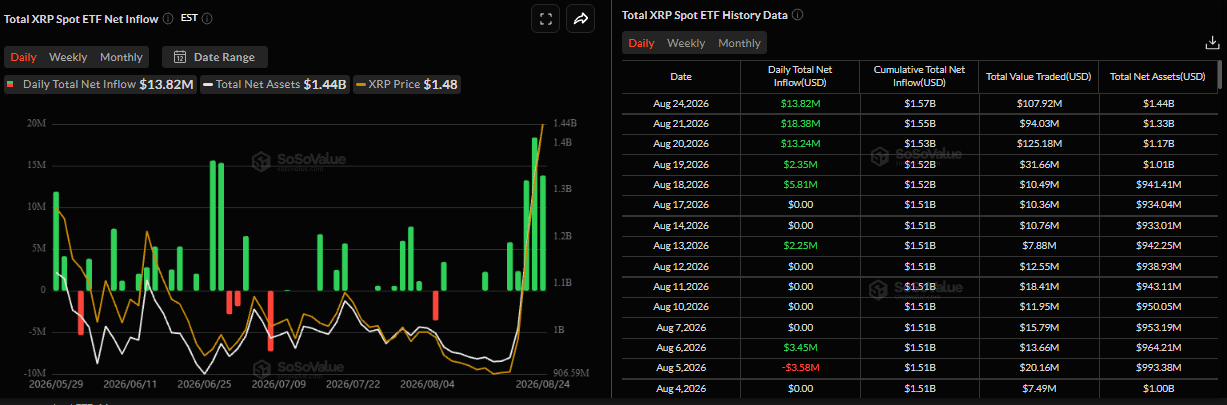
Despite this mixed outlook, institutional demand for XRP remained robust. SoSoValue data showed spot Exchange Traded Funds (ETFs) recorded a $13.82 million inflow on Monday, marking the fifth consecutive day of inflows since last week. If this trend continues and intensifies throughout the week, XRP could extend its rally.
XRP technical outlook: Nears key resistance zone
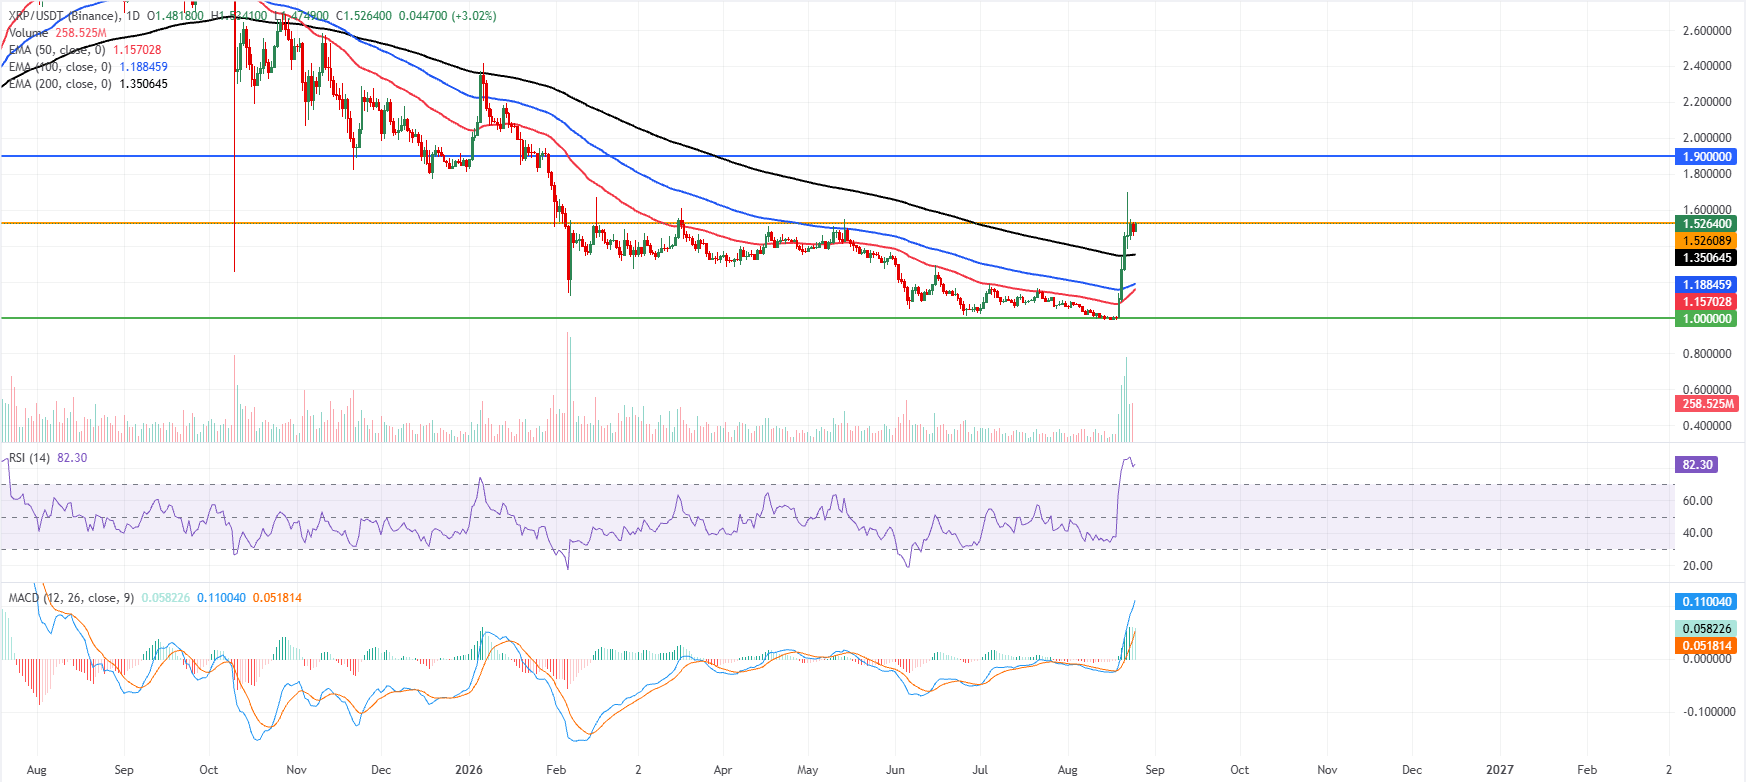
XRP price trades at $1.526 on Tuesday after surging over 53% in the previous week. XRP maintains a clear bullish near-term bias, holding well above the 50-day, 100-day and 200-day Exponential Moving Averages (EMAs) clustered between roughly $1.157 and $1.350, which now underpin the uptrend.
The Relative Strength Index (RSI) around 82 signals overbought conditions, while the Moving Average Convergence Divergence (MACD) stays positive with the line above its signal and a still-broadening histogram, suggesting strong but stretched upside momentum.
On the topside, immediate resistance emerges at $1.526, the nearby horizontal cap just beyond the current price, with a higher resistance at $1.900.
On the downside, the rising EMA cluster provides initial support, led by the 200-day EMA at $1.350 and the 100-day and 50-day EMAs at $1.188 and $1.157, respectively. At the same time, a deeper pullback could revisit the horizontal floor near $1.000 if profit-taking accelerates from overbought territory.
XLM technical outlook: 200-day EMA holds strong
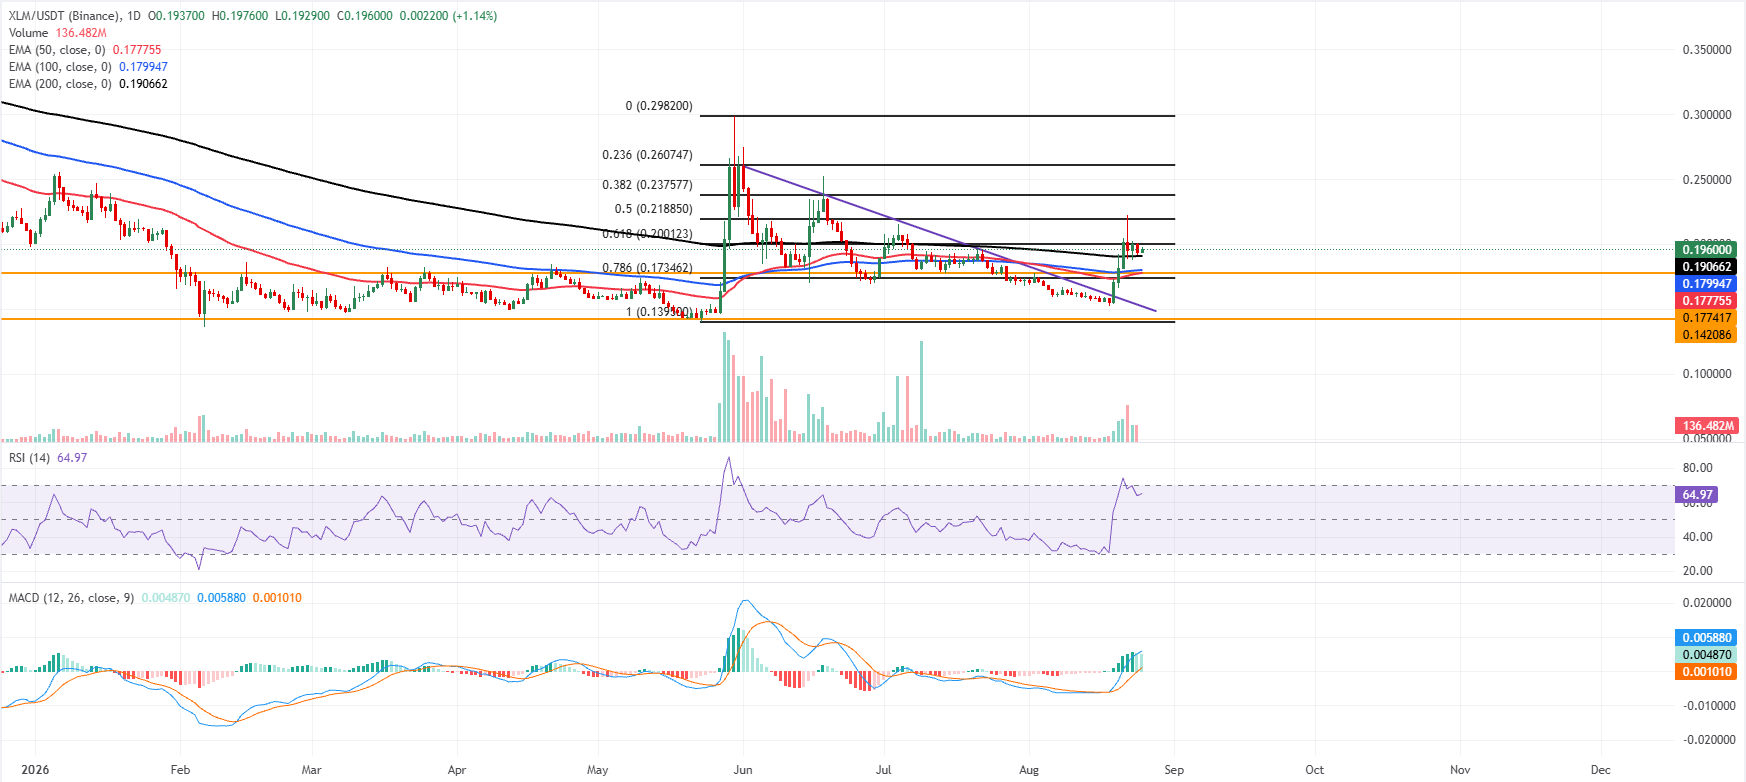
Stellar price trades at $0.196 on Tuesday after rallying over 27% last week. The near-term tone is bullish as price holds above the 50-day, 100-day and 200-day EMAs clustered between roughly $0.180 and $0.190, suggesting a constructive base after the recent breakout.
The RSI hovers near 65, pointing to firm yet not extreme upside momentum, while the Moving Average Convergence Divergence (MACD) remains positive with the MACD line above its signal line and a still‑positive histogram, hinting that buyers retain control despite the broader downtrend resistance line still looming overhead.
On the topside, initial resistance is seen at the 61.8% Fibonacci retracement near $0.200, with further barriers at the 50% retracement around $0.218 and the 38.2% Fibonacci retracement level near $0.237.
On the downside, immediate support emerges at the 200-day EMA around $0.190, followed by a dense demand zone formed by the 100-day and 50-day EMAs at $0.179 and $0.177, and the nearby horizontal support at $0.177.
(The technical analysis of this story was written with the help of an AI tool. Know more.)
Bài viết đề xuất


