


Bitcoin Weekly Forecast: Can bulls weather the market uncertainty?
- Bitcoin trades near $64,100 on Friday, remaining firmly above the 200-week SMA with modest weekly gains.
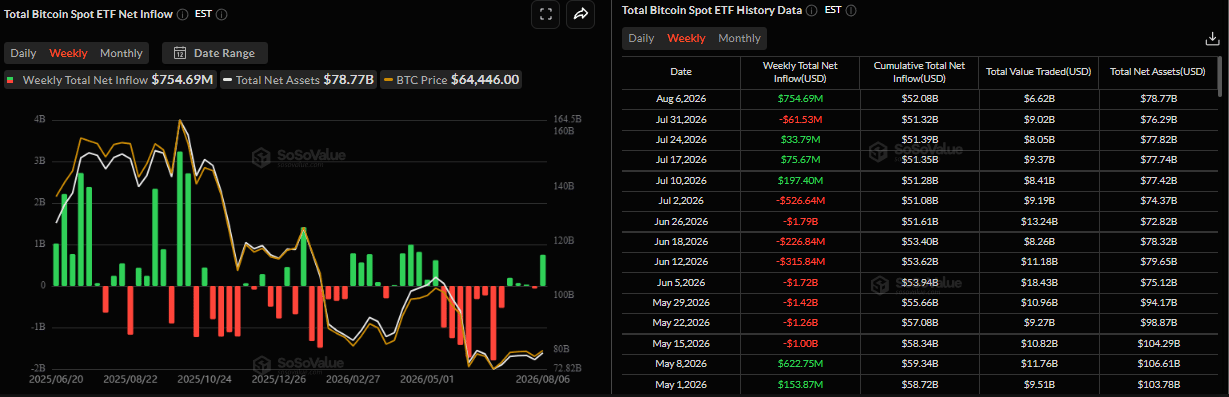
- US-listed BTC spot ETFs attracted $754.69 million in inflows through Thursday, signaling renewed institutional demand.
- Market participants remain cautious ahead of the closely watched US Nonfarm Payrolls report, which could drive volatility in BTC.
Bitcoin (BTC) remains resilient, trading near $64,100 on Friday, with bulls defending key support despite cautious market sentiment. US-listed spot Bitcoin Exchange-Traded Funds (ETFs) showed strong inflows through Thursday, pointing to renewed institutional demand. Traders should watch the upcoming US Nonfarm Payrolls (NFP) report later on the day, which could trigger increased volatility for the Crypto King.
Institutional demand shows signs of improvement
Institutional demand shows signs of strength so far this week. SoSoValue data show that spot BTC ETFs recorded an inflow of $754.69 million through Thursday.
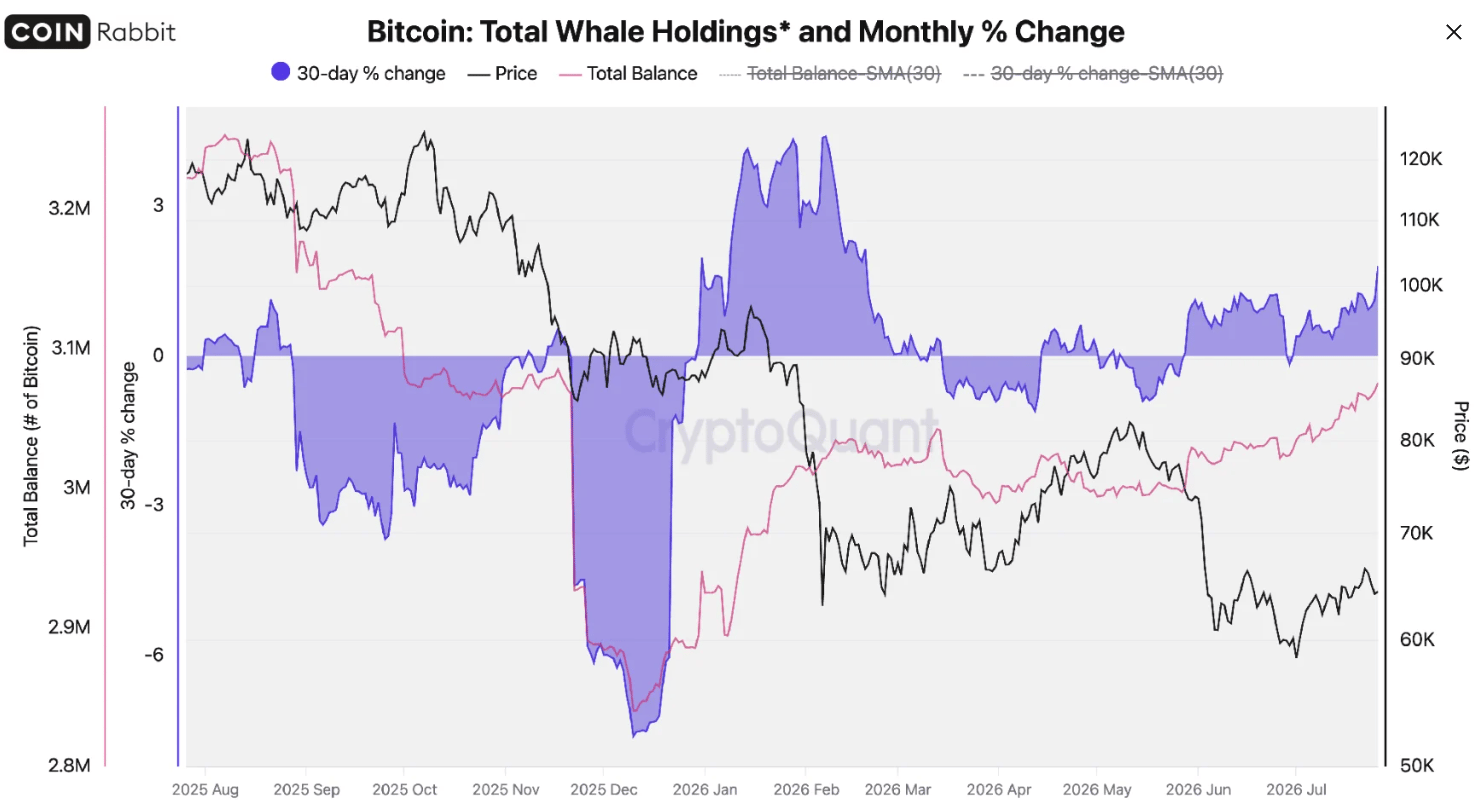
CryptoQuant’s report shows that Bitcoin whale holdings have risen through this year, with large holders buying dips below $60,000. Whale balances (excluding exchange and mining-pool addresses) bottomed near 2.87 million BTC in December 2025 and have climbed steadily to roughly 3.06 million on Wednesday.
"Accumulation accelerated precisely as price fell below $60,000 in June, a textbook buy-the-dip footprint from large holders. Balances remain below the 2025 bull-cycle peak near 3.23 million, leaving room for further accumulation,” reports CryptoQuant’s analyst.
Strait of Hormuz tensions cap BTC's upside
Risk sentiment remains subdued early Friday, with renewed tensions surrounding the Strait of Hormuz casting doubt on a potential US-Iran peace deal and weighing on risk assets such as BTC.
US President Donald Trump said on Thursday that he believed the war with Iran would end soon. However, developments on the ground suggest the risk of further escalation remains.
Iran’s semi-official Fars news agency reported, citing a lawmaker, that an Iranian parliamentary committee is reviewing a preliminary bill that would bar US, Israeli and other “hostile” vessels from transiting the Strait of Hormuz. The draft bill would impose fines of up to 20% of a ship's cargo value for violations of the proposed restrictions, raising concerns over supply route disruptions.
Meanwhile, a Saudi official said that some Iraqi militia factions, in coordination with Yemen's Iran-backed Houthis, are planning to attack the kingdom in the very near future. This raises the risk of a wider regional conflict, which further dampened the risk appetite and kept pressure on BTC.
US NFP takes center stage
On the macroeconomic front, traders are awaiting the US Nonfarm Payrolls (NFP) report, which will be published at 12:30 GMT on Friday.
Ahead of the NFP release, the CME FedWatch Tool shows a 54.7% probability of a 25 basis point (bps) rate hike in September, down from 67% a week earlier. The data on Friday could trigger fresh volatility in Bitcoin as traders reassess the Fed’s policy outlook.
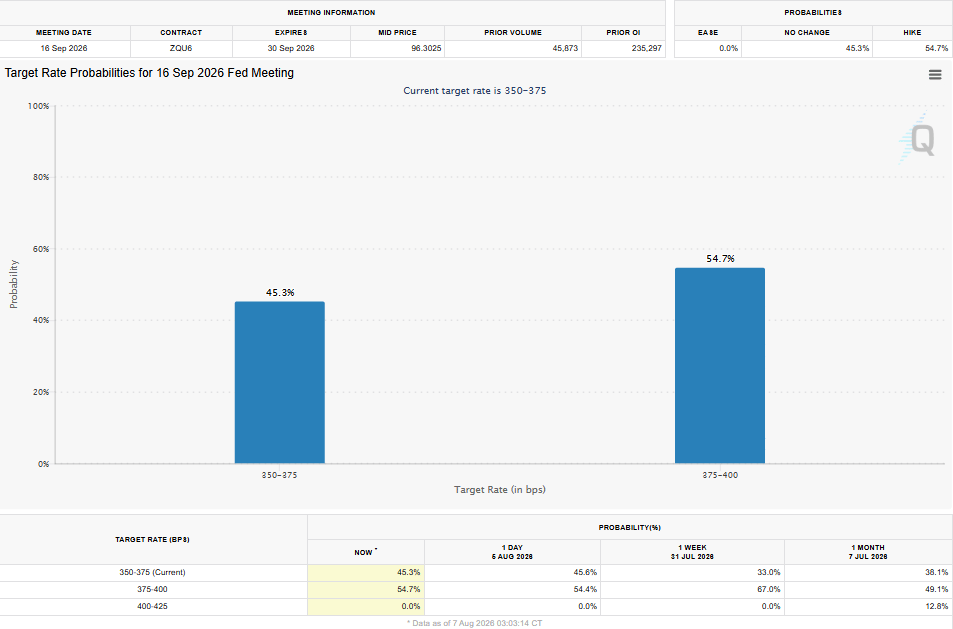
If the data comes in stronger than expected, it would signal a resilient labor market, reduce expectations for Fed easing and push investors toward safer assets such as Treasury yields and the US Dollar (USD) higher, while weighing on BTC. Conversely, a weaker-than-expected report could ease rate-hike expectations, which could pressure yields and the USD, and support BTC.
Beyond US payrolls, traders should closely monitor developments in the Middle East, with US-Iran peace talks and Oil prices likely to influence broader risk sentiment and Bitcoin’s near-term direction.
Clarity Act floor vote delayed to September
On the regulatory front, the US Senate has delayed a floor vote on the Digital Asset Market Clarity Act until September, according to an X post by Eleanor Terrett on Friday.
Terrett added, confirming an earlier Politico report, that US Senate leadership would not bring the bill to the floor before the August recess. The US Senate is expected to return to Washington around September 14, when lawmakers could consider the bill. A floor vote would require 60 votes to invoke cloture, adding another hurdle to the legislation’s passage.
Bitcoin technical outlook: Holds the key line of defense
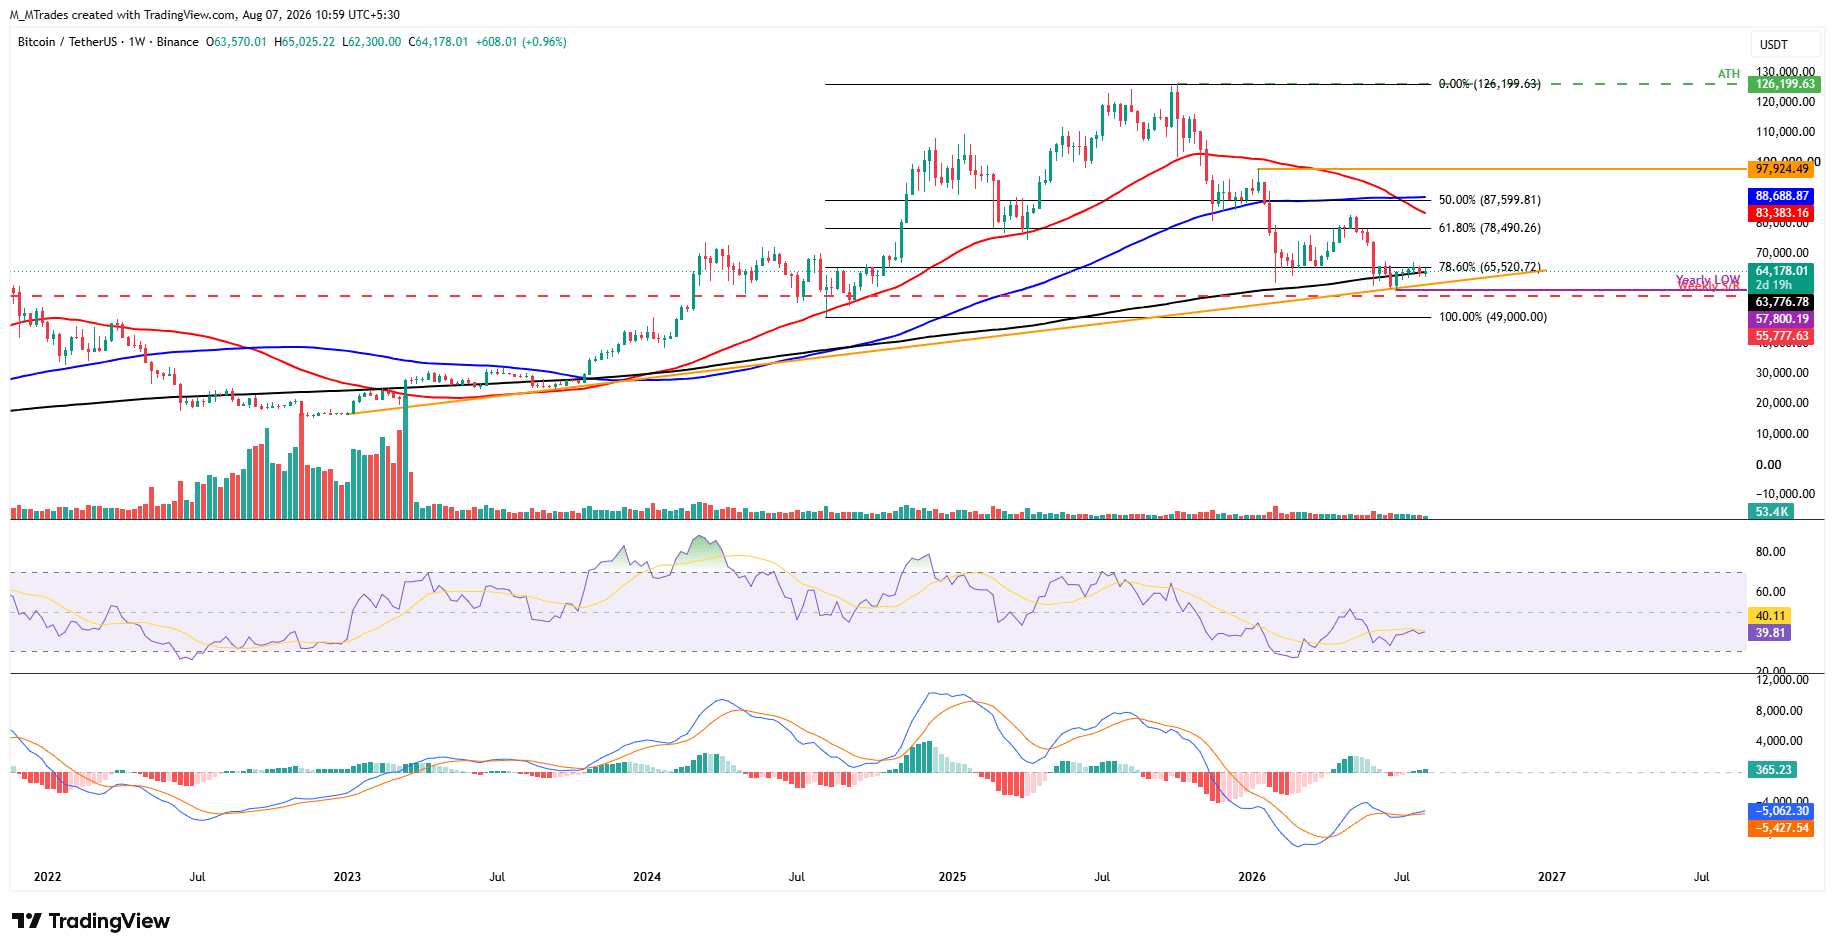
Bitcoin price trades slightly up so far this week, trading just below $64,200 at the time of writing on Friday after a mild correction of 2.80% in the previous week. BTC is finding support around the 200-week Simple Moving Average (SMA) at $63,776.
If the Crypto King holds above the 200-week SMA at $63,776 and closes above the immediate resistance at the 78.6% Fibonacci retracement level at $65,520 (drawn from the August 2024 low of $49,000 to the October 2025 record high at $126,199), then BTC could extend the recovery toward the 61.8% Fibonacci retracement level at $78,490.
Momentum indicators on the weekly chart show mild signs of easing bearish sentiment. The Relative Strength Index (RSI) is trending higher toward the neutral 50 level, with a reading of 39 on Friday. Meanwhile, the Moving Average Convergence Divergence (MACD) flipped to a bullish crossover in mid-July and remains intact, with rising green histogram bars, supporting a positive outlook.
However, if BTC fails to find support around the 200-week SMA at $63,776 and closes below it on a weekly basis, it could extend the losses toward the ascending trendline (drawn by connecting multiple lows since January 2023) around $60,000.
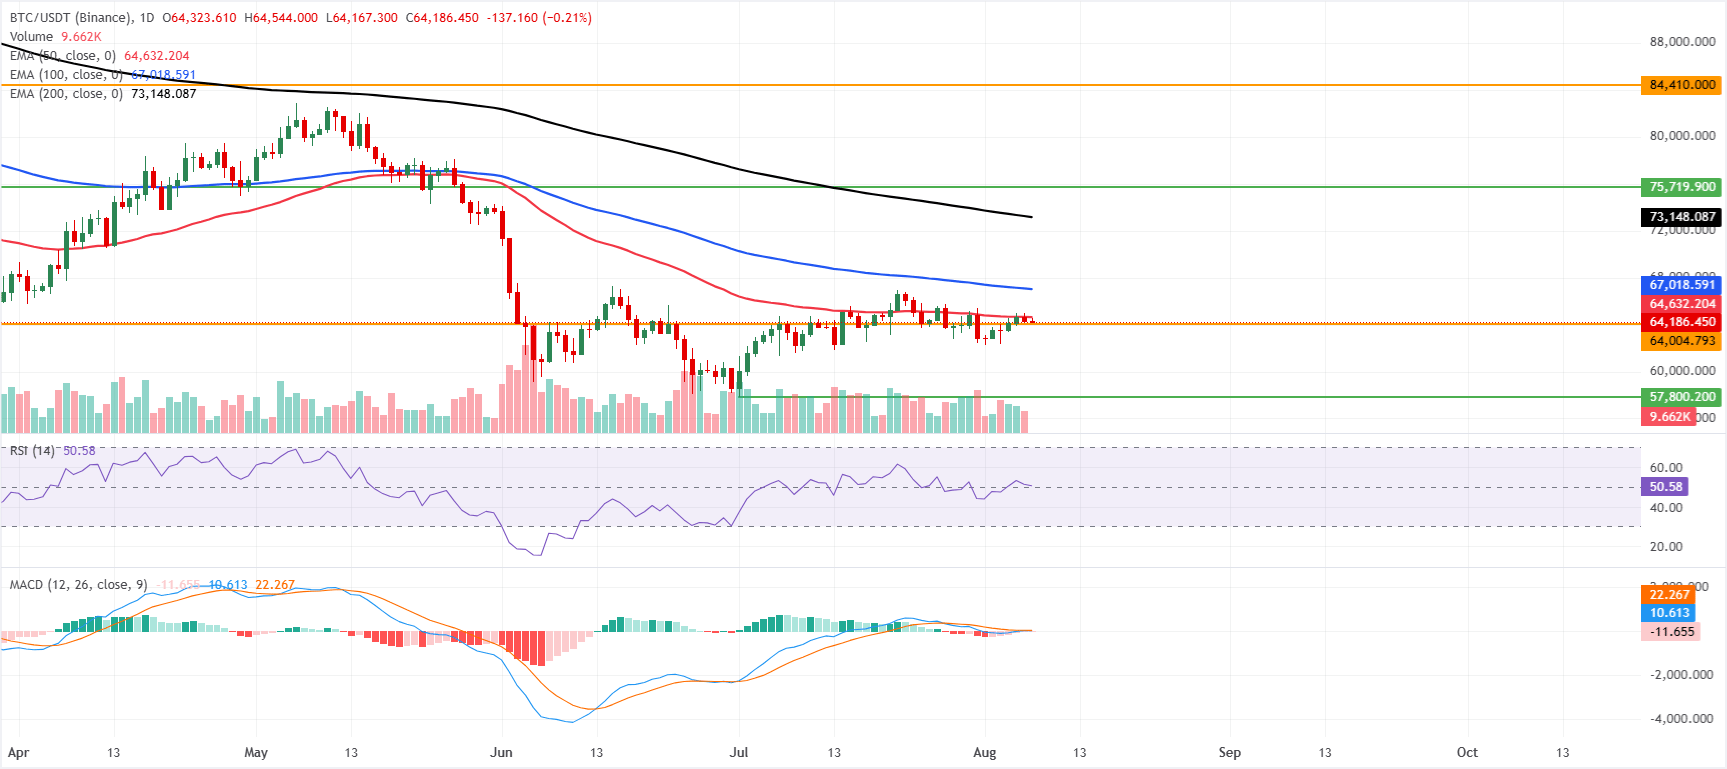
On the daily chart, the Crypto King is maintaining a mildly bearish near-term bias as price holds beneath the 50-day Exponential Moving Average (EMA) at $64,632, as well as the 100-day EMA at $67,018 and the 200-day EMA at $73,148.
The RSI on the daily chart at 50 sits neutral, while the MACD hovers just below the zero line with a slightly negative reading, hinting at subdued bullish momentum and a market that remains capped by overhead trend filters.
On the topside, initial resistance is defined by the 50-day EMA at $64,632, with further hurdles at the 100-day EMA near $67,018 and the longer-term 200-day EMA at $73,148, before a higher horizontal barrier emerges at $84,410.
On the downside, immediate support is seen at the horizontal level around $64,004, where a daily close below this floor would likely open the way to a deeper corrective phase, while holding above it keeps BTC in a consolidative posture beneath the clustered moving-average resistance.
(The technical analysis of this story was written with the help of an AI tool. Know more.)
Nonfarm Payrolls FAQs
Nonfarm Payrolls (NFP) are part of the US Bureau of Labor Statistics monthly jobs report. The Nonfarm Payrolls component specifically measures the change in the number of people employed in the US during the previous month, excluding the farming industry.
The Nonfarm Payrolls figure can influence the decisions of the Federal Reserve by providing a measure of how successfully the Fed is meeting its mandate of fostering full employment and 2% inflation. A relatively high NFP figure means more people are in employment, earning more money and therefore probably spending more. A relatively low Nonfarm Payrolls’ result, on the either hand, could mean people are struggling to find work. The Fed will typically raise interest rates to combat high inflation triggered by low unemployment, and lower them to stimulate a stagnant labor market.
Nonfarm Payrolls generally have a positive correlation with the US Dollar. This means when payrolls’ figures come out higher-than-expected the USD tends to rally and vice versa when they are lower. NFPs influence the US Dollar by virtue of their impact on inflation, monetary policy expectations and interest rates. A higher NFP usually means the Federal Reserve will be more tight in its monetary policy, supporting the USD.
Nonfarm Payrolls are generally negatively-correlated with the price of Gold. This means a higher-than-expected payrolls’ figure will have a depressing effect on the Gold price and vice versa. Higher NFP generally has a positive effect on the value of the USD, and like most major commodities Gold is priced in US Dollars. If the USD gains in value, therefore, it requires less Dollars to buy an ounce of Gold. Also, higher interest rates (typically helped higher NFPs) also lessen the attractiveness of Gold as an investment compared to staying in cash, where the money will at least earn interest.
Nonfarm Payrolls is only one component within a bigger jobs report and it can be overshadowed by the other components. At times, when NFP come out higher-than-forecast, but the Average Weekly Earnings is lower than expected, the market has ignored the potentially inflationary effect of the headline result and interpreted the fall in earnings as deflationary. The Participation Rate and the Average Weekly Hours components can also influence the market reaction, but only in seldom events like the “Great Resignation” or the Global Financial Crisis.
Bài viết đề xuất


