


Crypto Today: Bitcoin, Ethereum hold steady, XRP decline nears $1.00 amid easing geopolitical tensions
- Bitcoin holds steady above $64,000 as Iran and Oman reportedly near a deal to reopen the Strait of Hormuz for commercial shipping.
- Ethereum bulls defend the immediate $1,900 support, raising the odds of a breakout above $2,000.
- XRP’s path of least resistance remains downward as the price falls for a fifth consecutive day, approaching $1.00.
Cryptocurrency prices are relatively stable on Friday, with Bitcoin (BTC) edging higher above the immediate $64,000 support. Ethereum (ETH) holds fairly above the short-term $1,900 demand area, as bulls target a potential breakout. Meanwhile, Ripple (XRP) maintains a dominant bearish outlook, edging lower toward the crucial $1.00 support.
Iran-Oman eye a potential Strait of Hormuz deal
Iran and Oman are reportedly closing in on an agreement that would reopen the Strait of Hormuz for commercial shipping. A CNN report indicates that the agreement will not mean an automatic reopening of the crucial waterway. Iran’s deputy foreign minister has also denied any direct negotiations with the United States (US).
Despite geopolitical tensions easing between the US and Iran, Saudi Arabia is anticipating a series of coordinated attacks on critical port and airport infrastructure by Iraqi militias in collaboration with Iran-backed Houthi rebels.
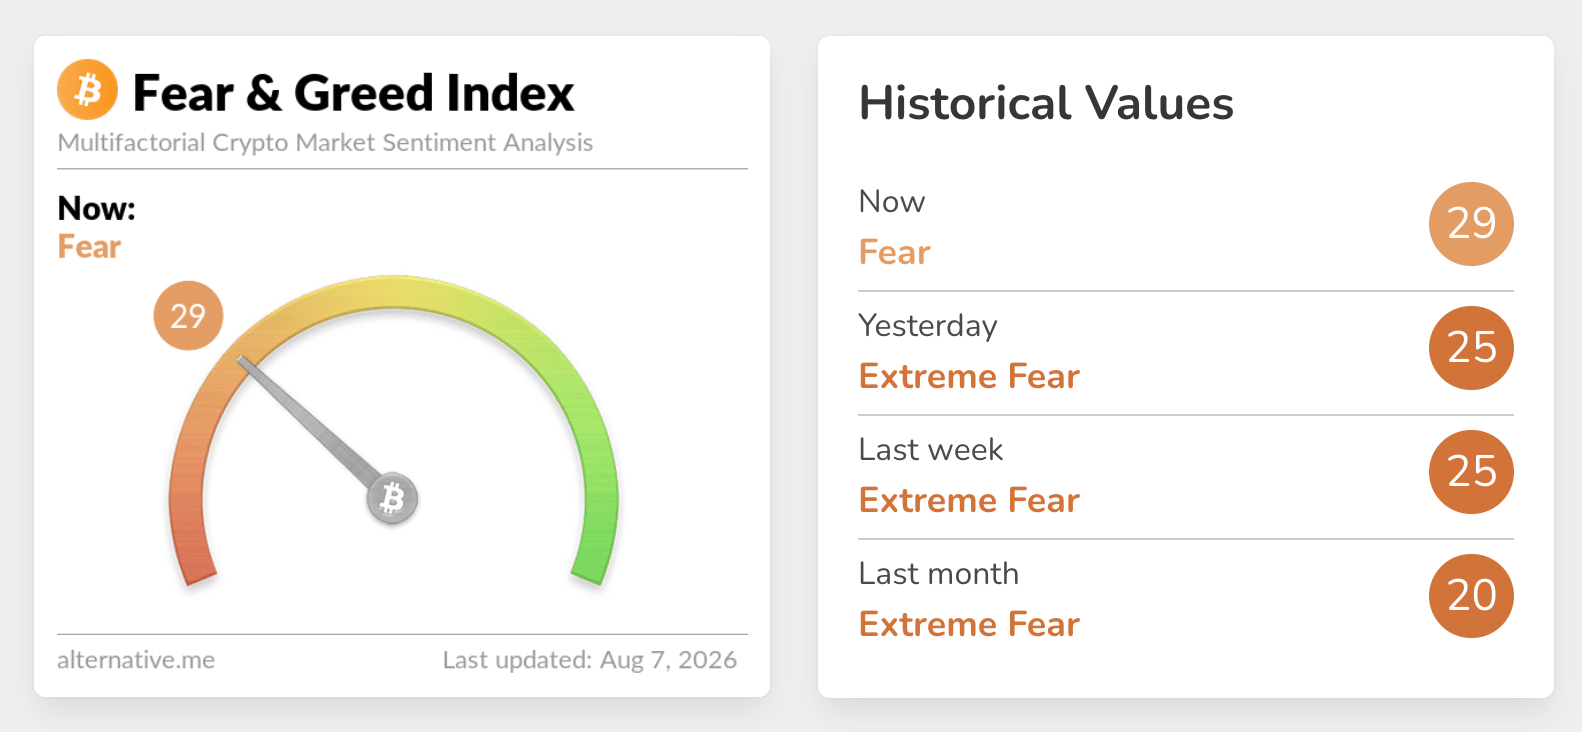
Appetite for risk assets has improved only marginally, with sentiment currently in the Fear territory at 29, up from 25 in the Extreme Fear territory on Thursday, according to the Fear & Greed Index. If sustained, strong sentiment would mean risk assets are attractive to investors, thus raising the odds of a sustained recovery.
Technical analysis: Bitcoin holds above key support
Bitcoin hovers at $64,480, maintaining a bearish near-term bias as price holds below the 50-day, 100-day, and 200-day Exponential Moving Averages (EMAs) at $64,644, $66,995, and $72,678, respectively. The pair is still supported by the SuperTrend line near $61,034 and an underlying rising trendline whose latest key reaction level comes in around $62,887, suggesting that while upside is capped by overhead averages, the broader structure has not yet flipped into outright breakdown.
The Relative Strength Index (RSI) at 52 sits slightly above neutral, while the Moving Average Convergence Divergence (MACD) has just turned marginally positive, hinting at fading downside momentum but not yet enough to negate the prevailing overhead pressure.
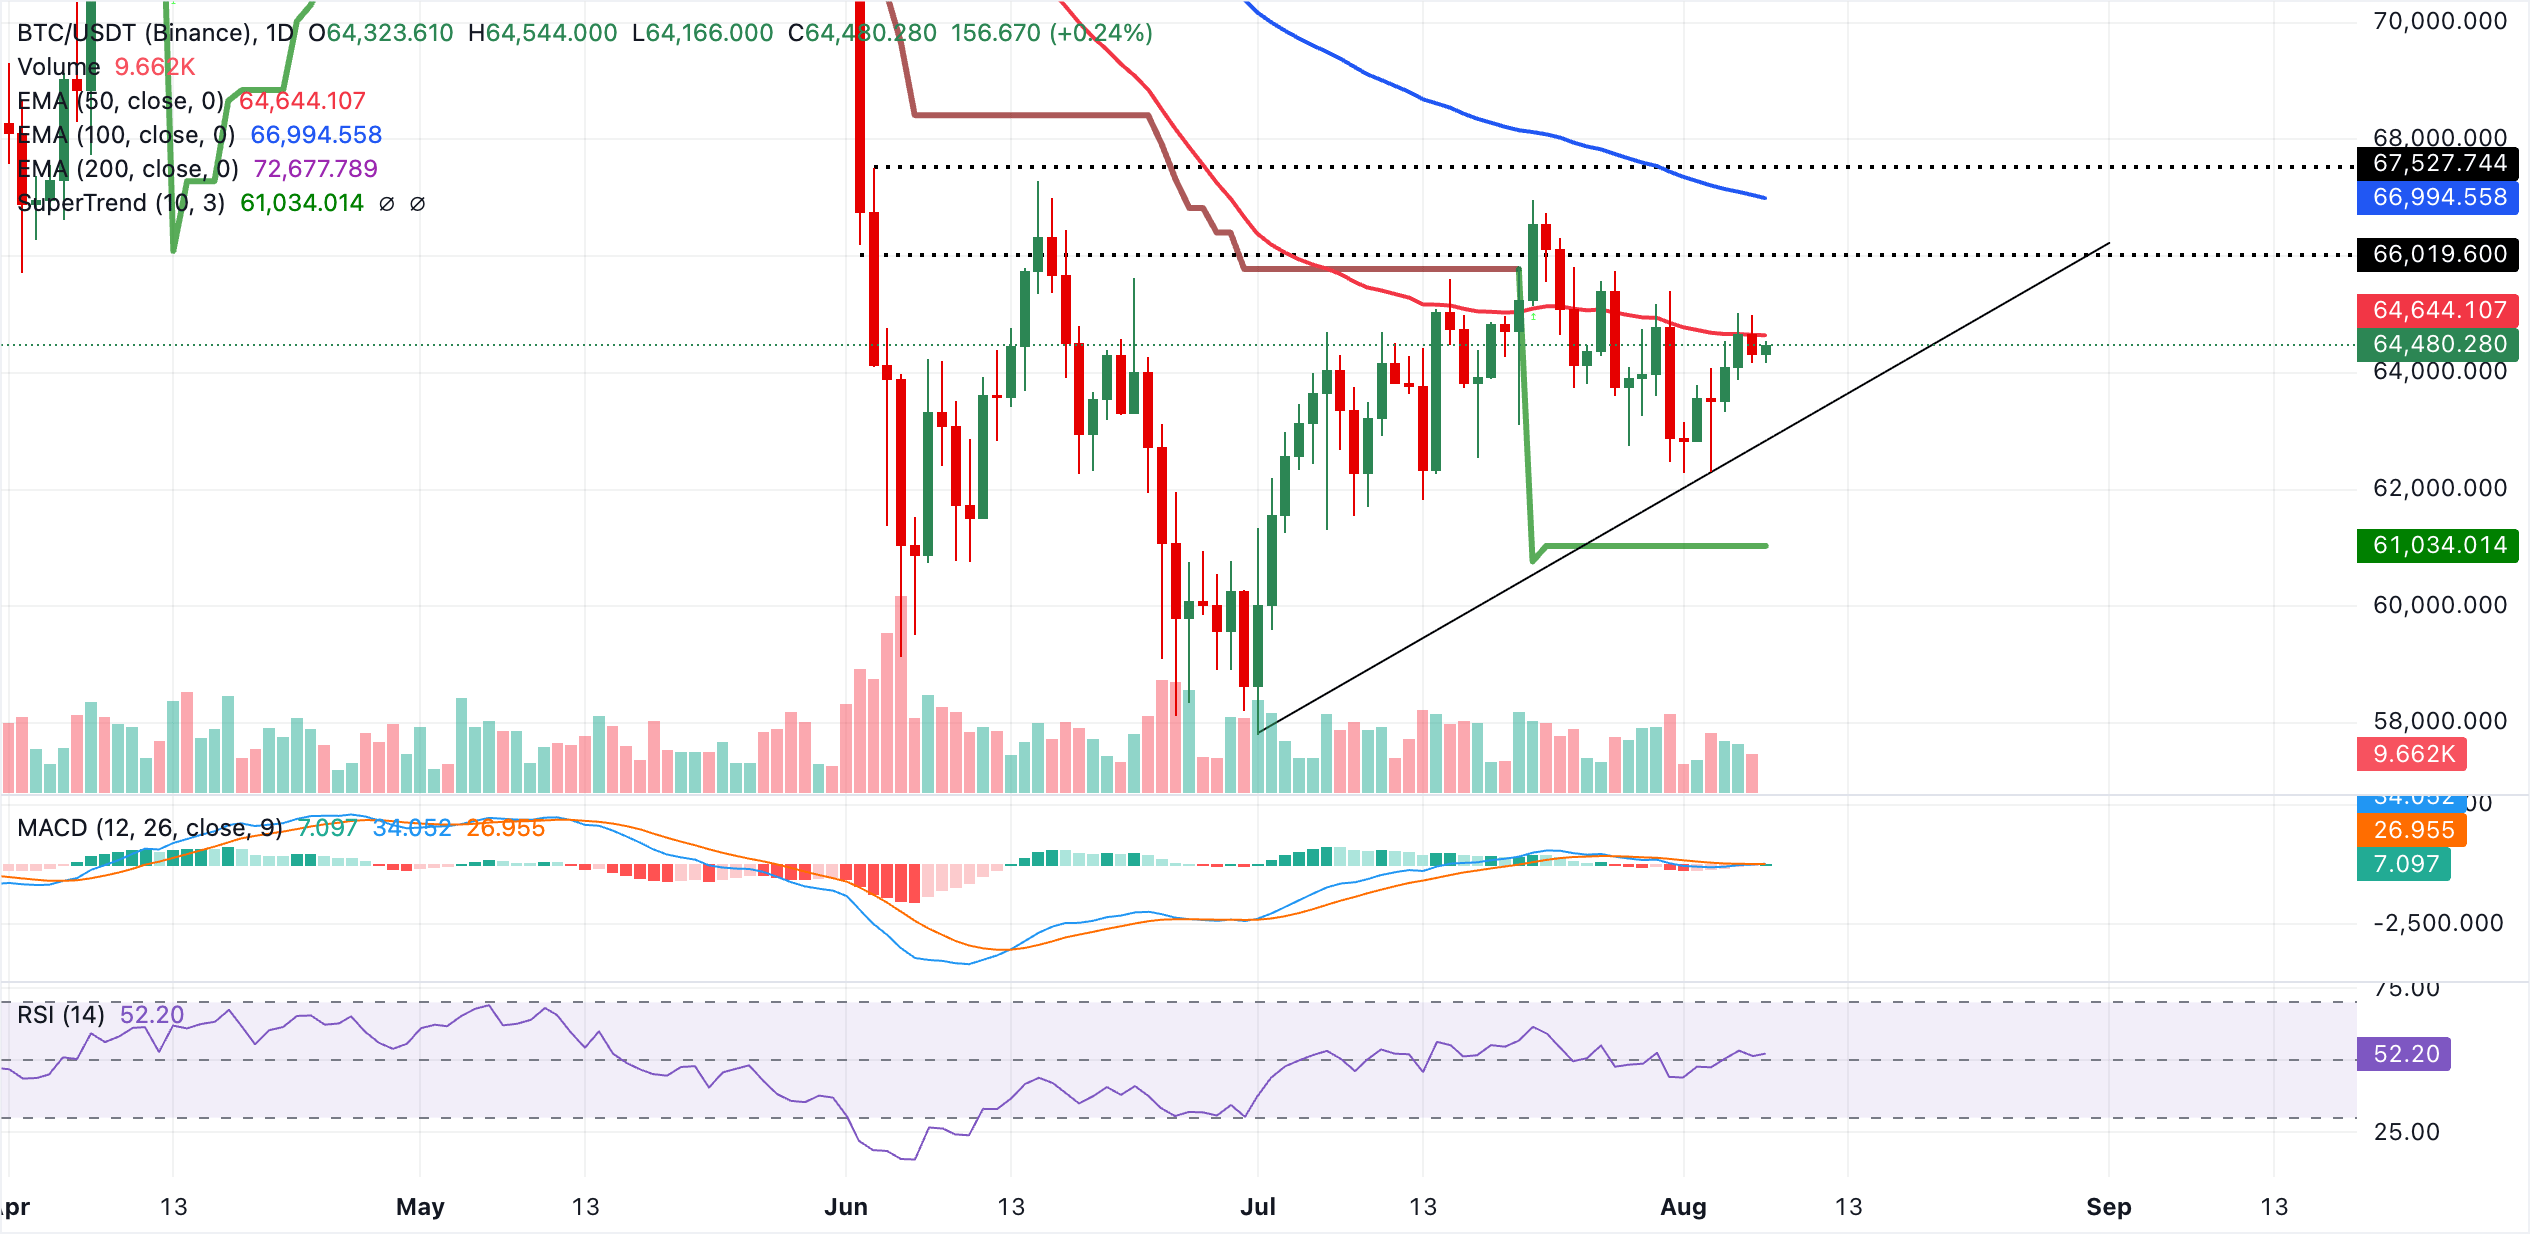
On the topside, immediate resistance is provided by the 50-day EMA around $64,644, with further barriers at the 100-day EMA near $66,995 and then the 200-day EMA close to $72,678, where a denser supply zone is likely to emerge if the bounce extends. On the downside, initial support lies at the rising trendline reference around $62,887, ahead of the SuperTrend level at $61,034.
A daily close below these layers would open the door to a deeper corrective phase, whereas holding above them would keep the current consolidation within the broader uptrend intact despite the short-term bearish bias.
Altcoins technical outlook: Ethereum eyes short-term breakout as XRP weakens
Ethereum trades at $1,906, holding a neutral-to-slightly bullish near-term tone as price stays above the 50-day EMA at $1,858 and the SuperTrend support near $1,741, but remains capped by the 100-day EMA at $1,928 overhead. The RSI at 55 suggests modest bullish momentum, though the Moving Average Convergence Divergence (MACD) indicator has slipped below zero with a negative reading, hinting that upside traction is softening while the broader structure consolidates between nearby support and resistance.
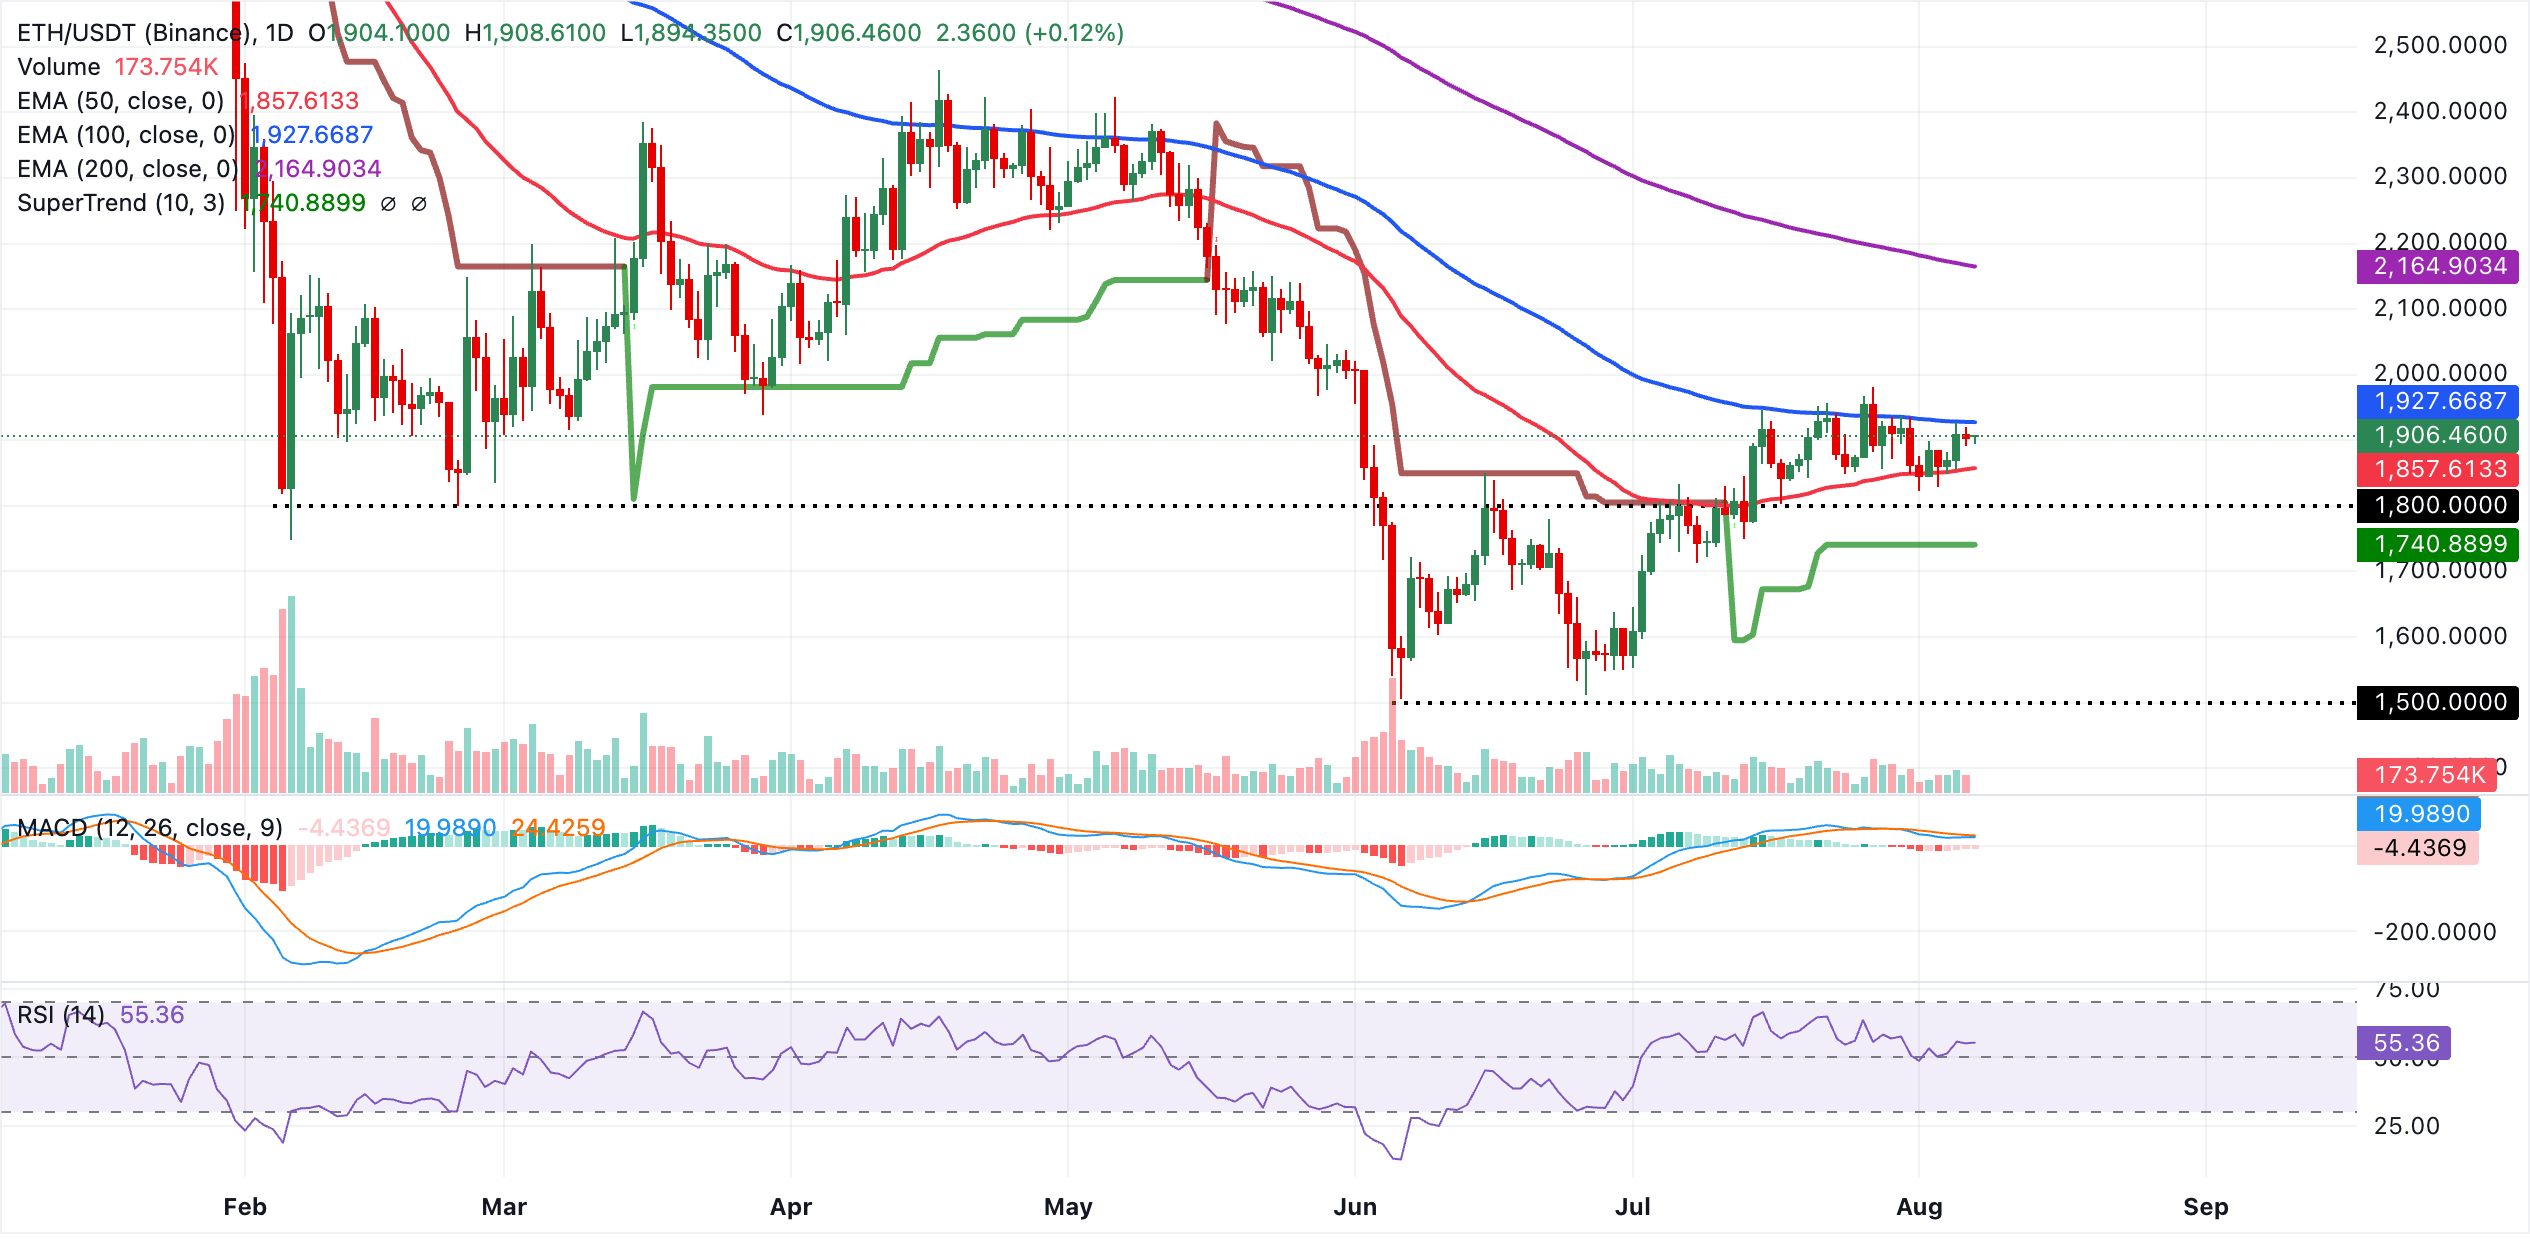
On the topside, immediate resistance lies at the 100-day EMA at $1,928, and a sustained break above this barrier would expose the next key hurdle at the 200-day EMA around $2,165. On the downside, initial support appears at the 50-day EMA at $1,858, with a deeper pullback likely finding additional underlying demand near the SuperTrend line clustered around $1,741, where buyers would be expected to defend the broader constructive structure.
XRP, on the other hand, trades at $1.03, extending a bearish near-term bias as price remains decisively below the 50-day, 100-day and 200-day EMAs at $1.11, $1.19 and $1.39 respectively, as well as under the SuperTrend line at $1.11.
The MACD indicator sits below zero with a negative latest reading, while the RSI at 37 holds in weak territory, which together suggests ongoing downside pressure rather than an imminent bullish reversal.
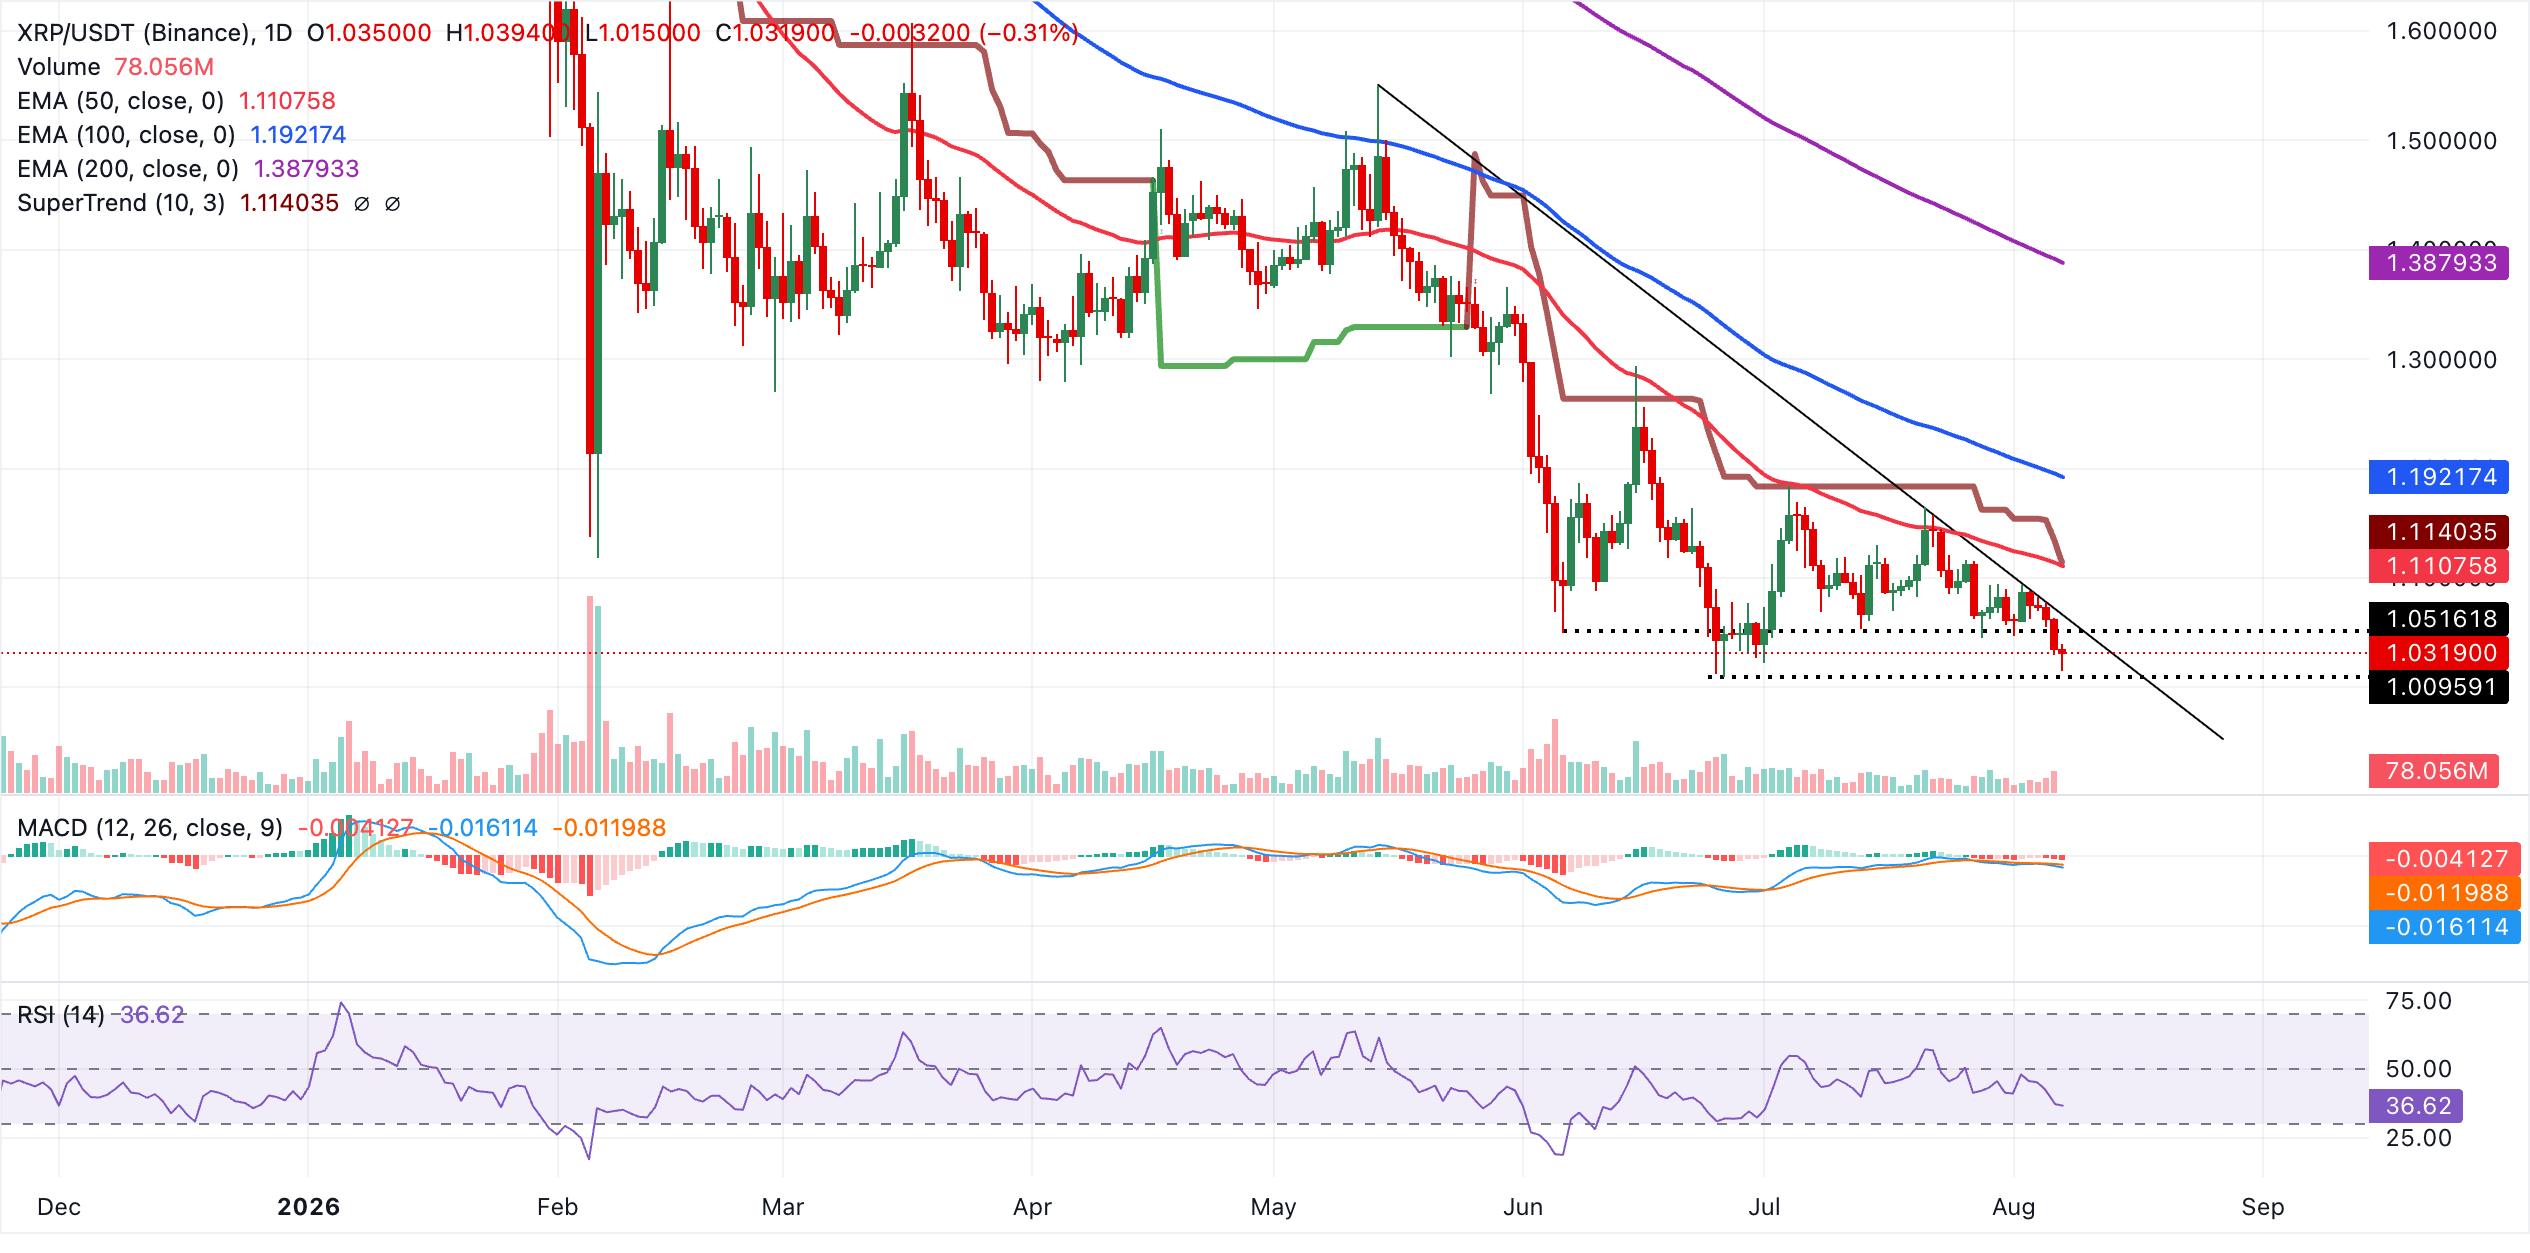
On the topside, initial resistance lies at the broken downtrend line around $1.06, ahead of a dense cap formed by the 50-day EMA at $1.11 and the SuperTrend level at $1.11, with the 100-day EMA at $1.19 and the 200-day EMA at $1.39 reinforcing the broader bearish structure higher up. The pair would likely need to reclaim the $1.06 area first to alleviate immediate selling pressure, while failure to do so keeps risks skewed toward further weakness from current levels.
(The technical analysis of this story was written with the help of an AI tool. Know more.)
Bitcoin, altcoins, stablecoins FAQs
Bitcoin is the largest cryptocurrency by market capitalization, a virtual currency designed to serve as money. This form of payment cannot be controlled by any one person, group, or entity, which eliminates the need for third-party participation during financial transactions.
Altcoins are any cryptocurrency apart from Bitcoin, but some also regard Ethereum as a non-altcoin because it is from these two cryptocurrencies that forking happens. If this is true, then Litecoin is the first altcoin, forked from the Bitcoin protocol and, therefore, an “improved” version of it.
Stablecoins are cryptocurrencies designed to have a stable price, with their value backed by a reserve of the asset it represents. To achieve this, the value of any one stablecoin is pegged to a commodity or financial instrument, such as the US Dollar (USD), with its supply regulated by an algorithm or demand. The main goal of stablecoins is to provide an on/off-ramp for investors willing to trade and invest in cryptocurrencies. Stablecoins also allow investors to store value since cryptocurrencies, in general, are subject to volatility.
Bitcoin dominance is the ratio of Bitcoin's market capitalization to the total market capitalization of all cryptocurrencies combined. It provides a clear picture of Bitcoin’s interest among investors. A high BTC dominance typically happens before and during a bull run, in which investors resort to investing in relatively stable and high market capitalization cryptocurrency like Bitcoin. A drop in BTC dominance usually means that investors are moving their capital and/or profits to altcoins in a quest for higher returns, which usually triggers an explosion of altcoin rallies.
Bài viết đề xuất


