

Ripple Price Forecast: XRP extends losses as derivatives interest cools
- XRP continues to face downward pressure, retesting the $1.12 support level on Friday.
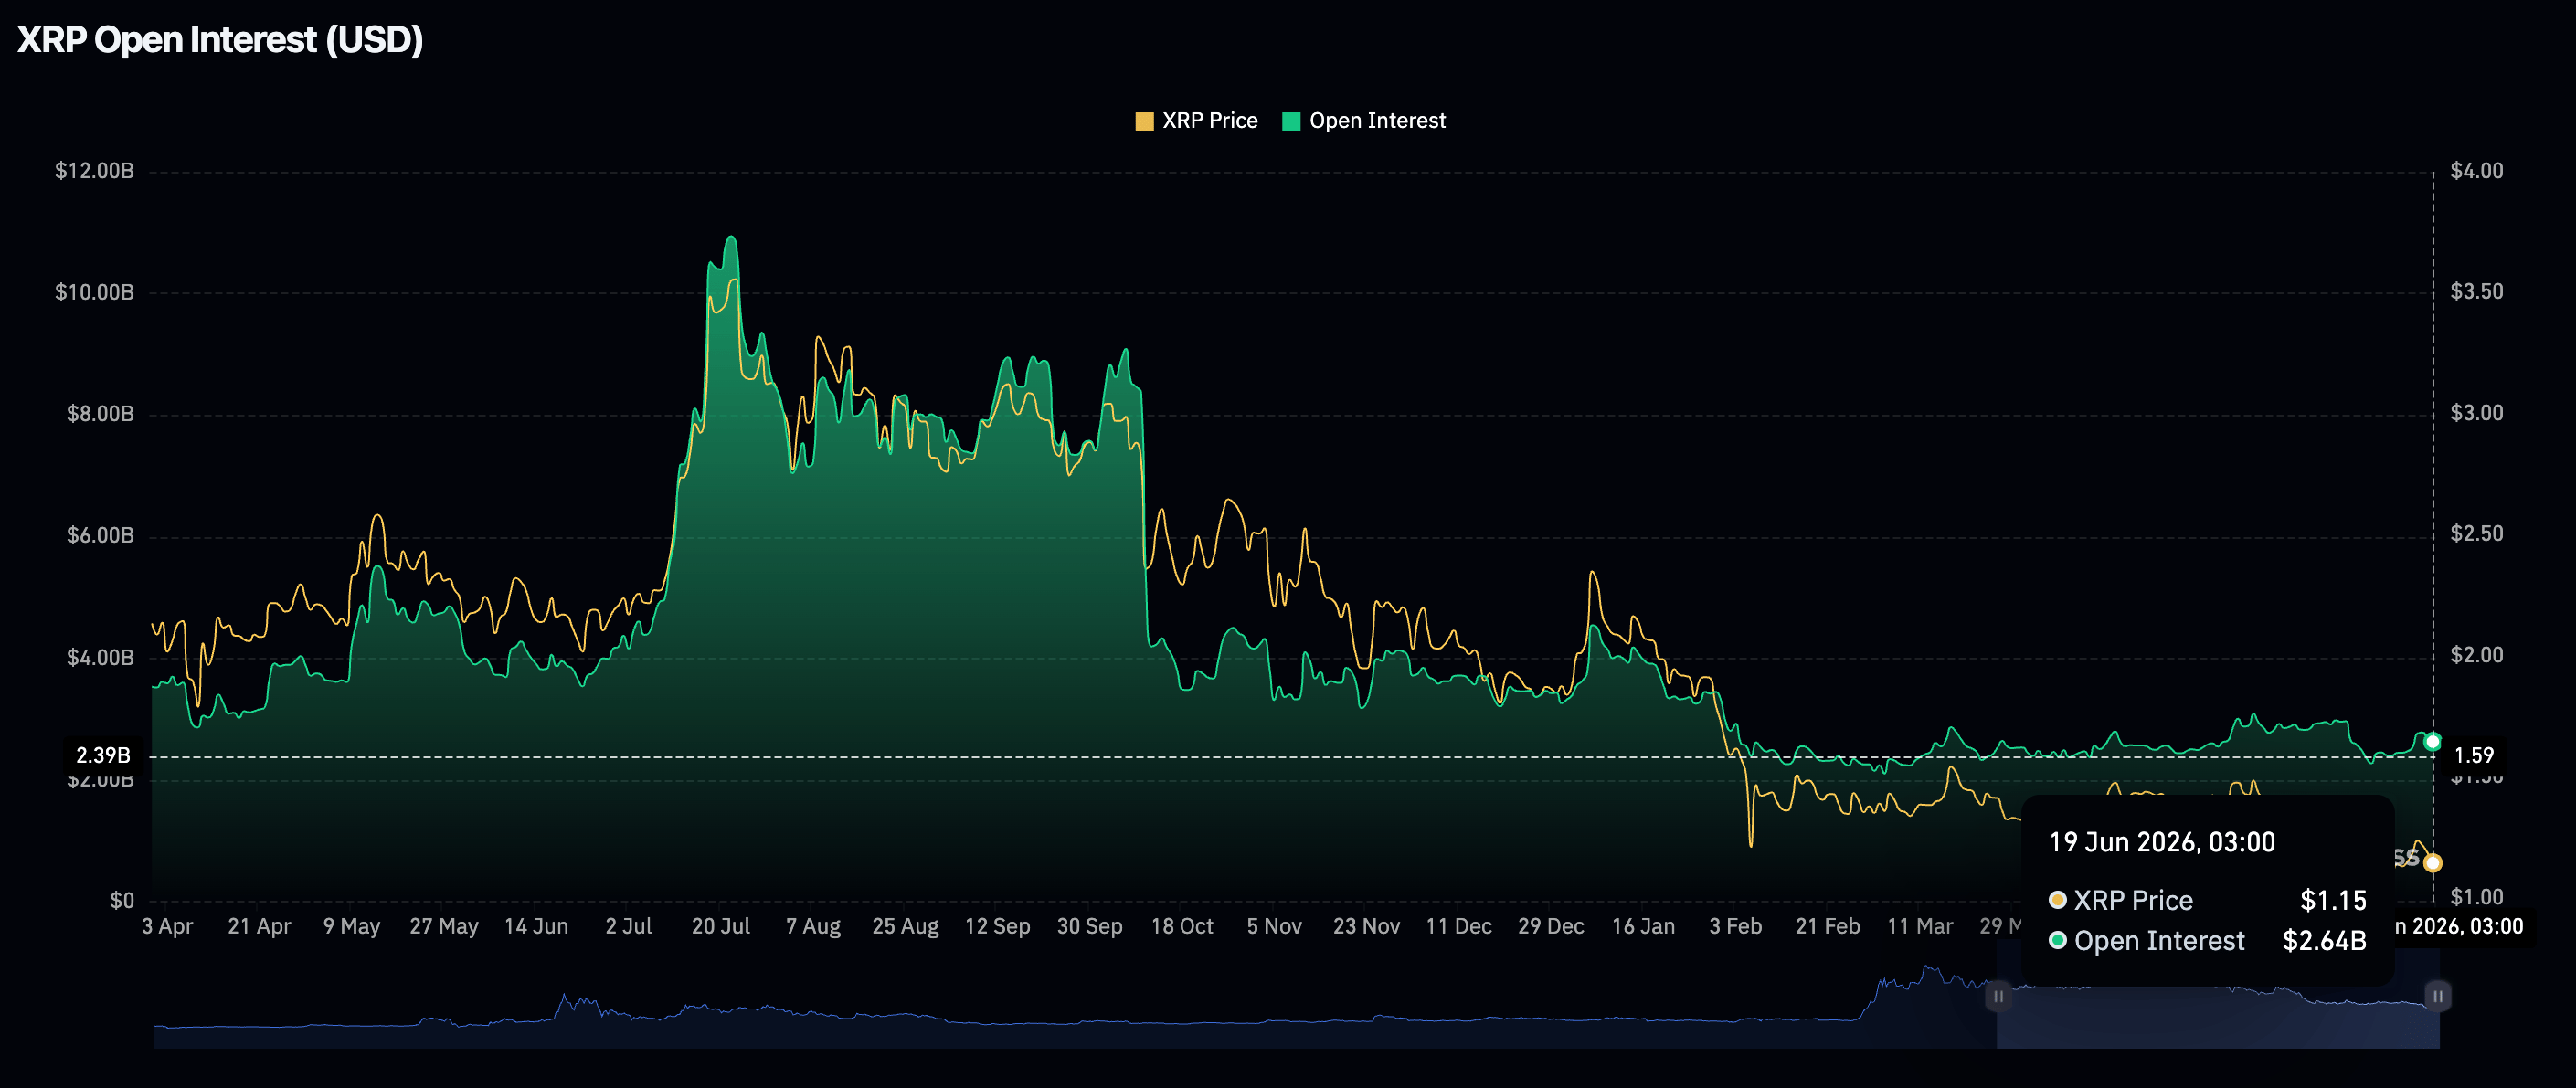
- XRP derivatives remain suppressed at $2.64 billion, aligning with broader risk-averse sentiment
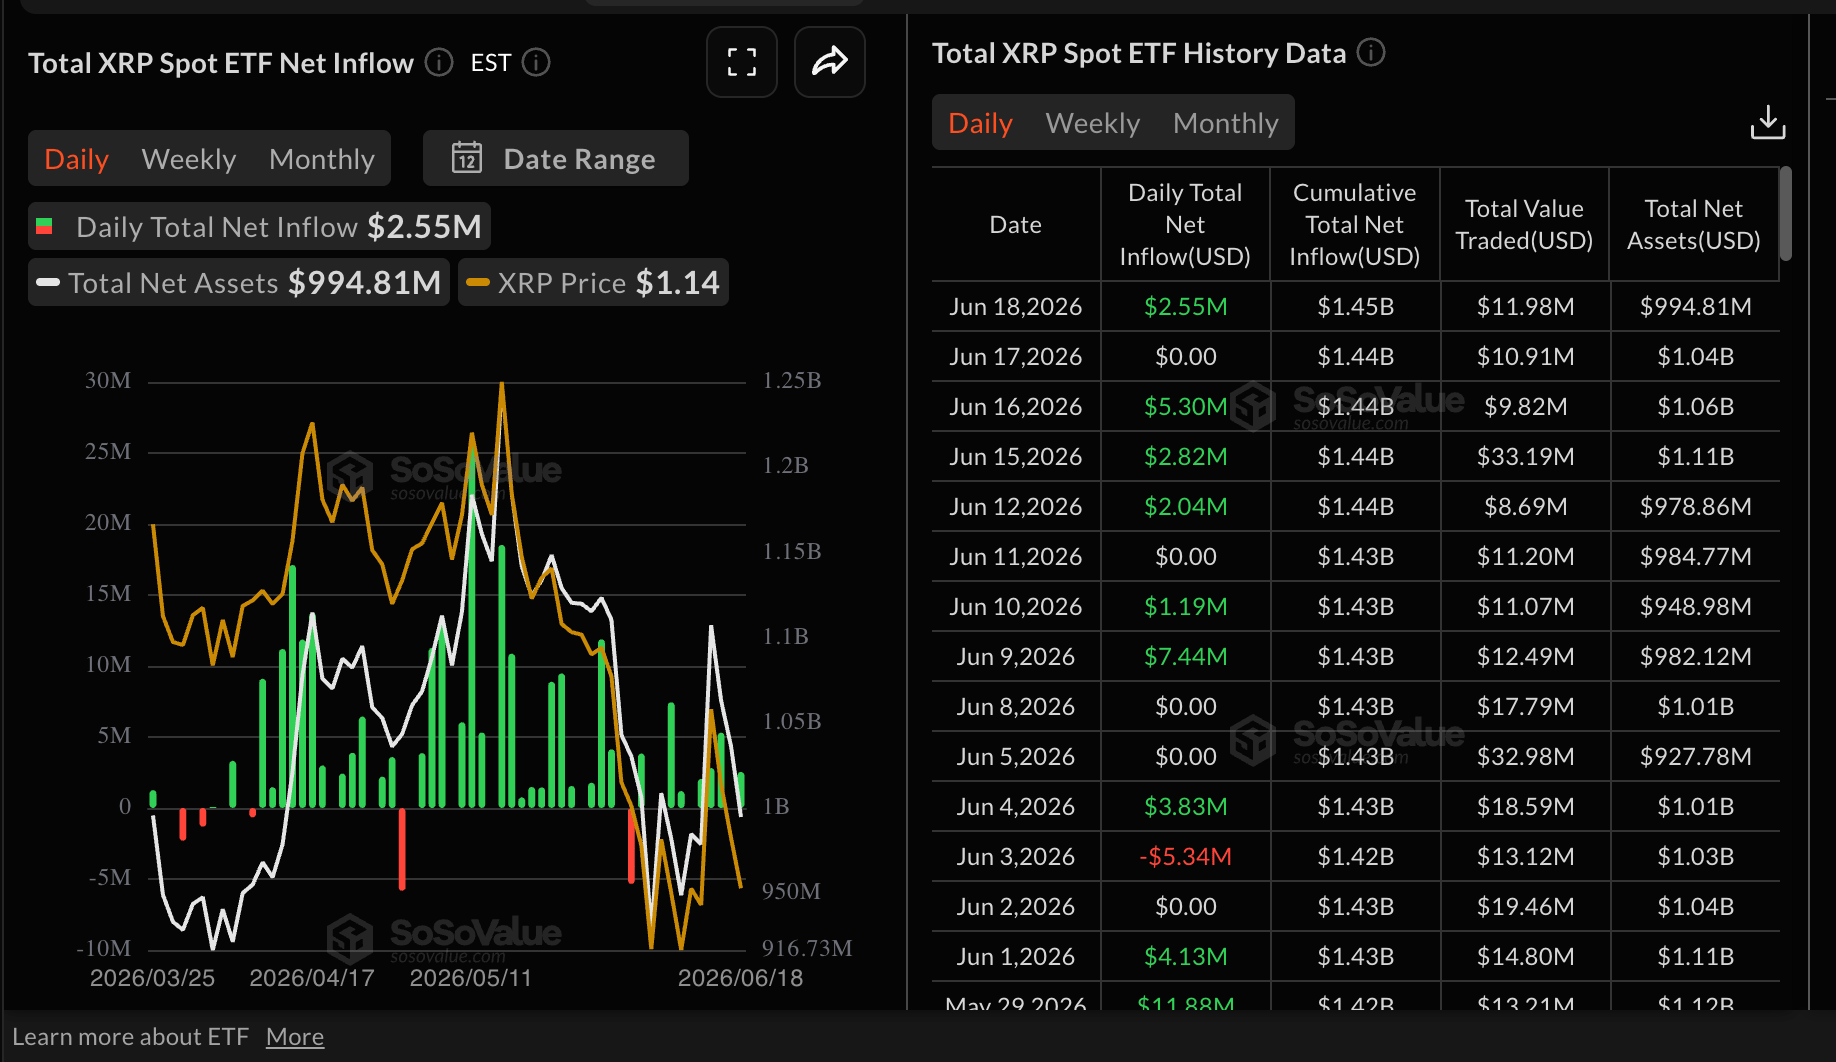
- Mild inflows into spot ETFs fail to lift XRP’s outlook amid weak technical signals.
Ripple (XRP) extends its bearish roll near $1.12 support on Friday, reflecting intense headwinds in the broader crypto market largely attributable to macroeconomic pressure.
XRP under pressure amid capital outflows
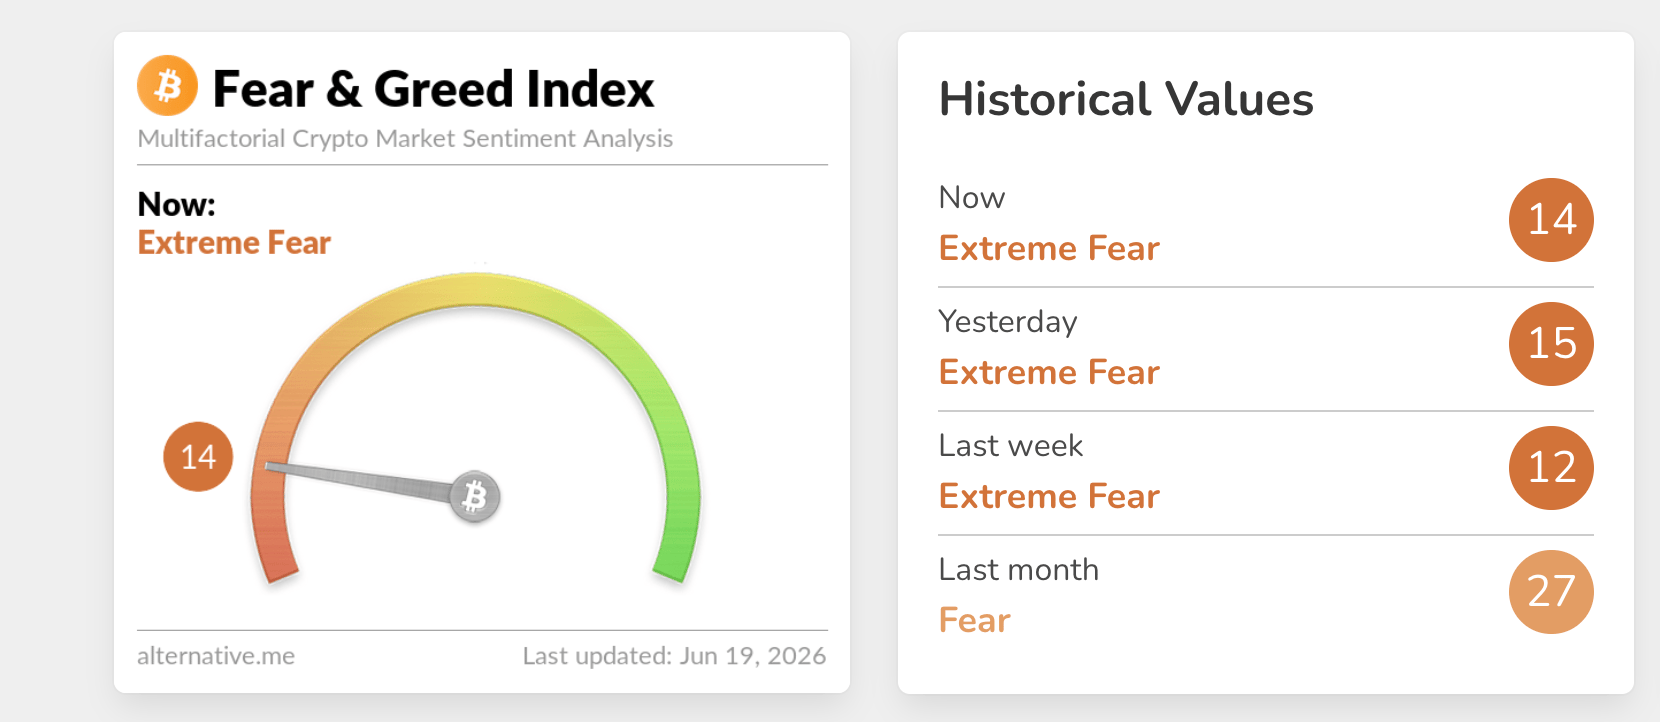
Derivatives and institutional digital asset products are seeing diminished engagement, reflecting persistent risk aversion across the crypto markets. The Crypto Fear & Greed Index, holding at 15 in the Extreme Fear zone on Friday, underscores this cautious investor sentiment.
Open Interest (OI) in XRP futures holds at $2.64 billion on Friday, marking a slight decrease from $2.66 billion the previous day. This contraction signals a continued pullback in risk appetite among market participants.
Ongoing weakness in derivatives demand underscores waning confidence in XRP’s short-term prospects. Consequently, traders are increasingly closing existing positions instead of opening new longs, intensifying downward pressure on the asset.
Meanwhile, mild inflows into XRP spot Exchange-Traded Funds (ETFs) failed to trigger a bullish reversal. SoSoValue data shows inflows totaled $2.55 million on Friday, following muted activity the previous day.
If headwinds persist and outweigh demand, a sustained bearish trend could accelerate losses toward recent lows of $1.05 and the psychological support level at $1.00.
Price analysis: XRP bearish roll persists
XRP trades above $1.12, maintaining a bearish near-term bias. The spot price holds below the 50-day, 100-day and 200-day Exponential Moving Averages (EMAs) clustered above $1.26, $1.36 and $1.58 respectively.
Although the broader market correction persists, the Moving Average Convergence Divergence *(MACD) histogram remains in positive territory but is steadily contracting, signaling that bullish momentum is waning. Additionally, the pair is unable to recover key trend levels, with the elevated Stochastic Relative Strength Index (RSI) retreating from overbought territory, further highlighting diminishing buyer strength.
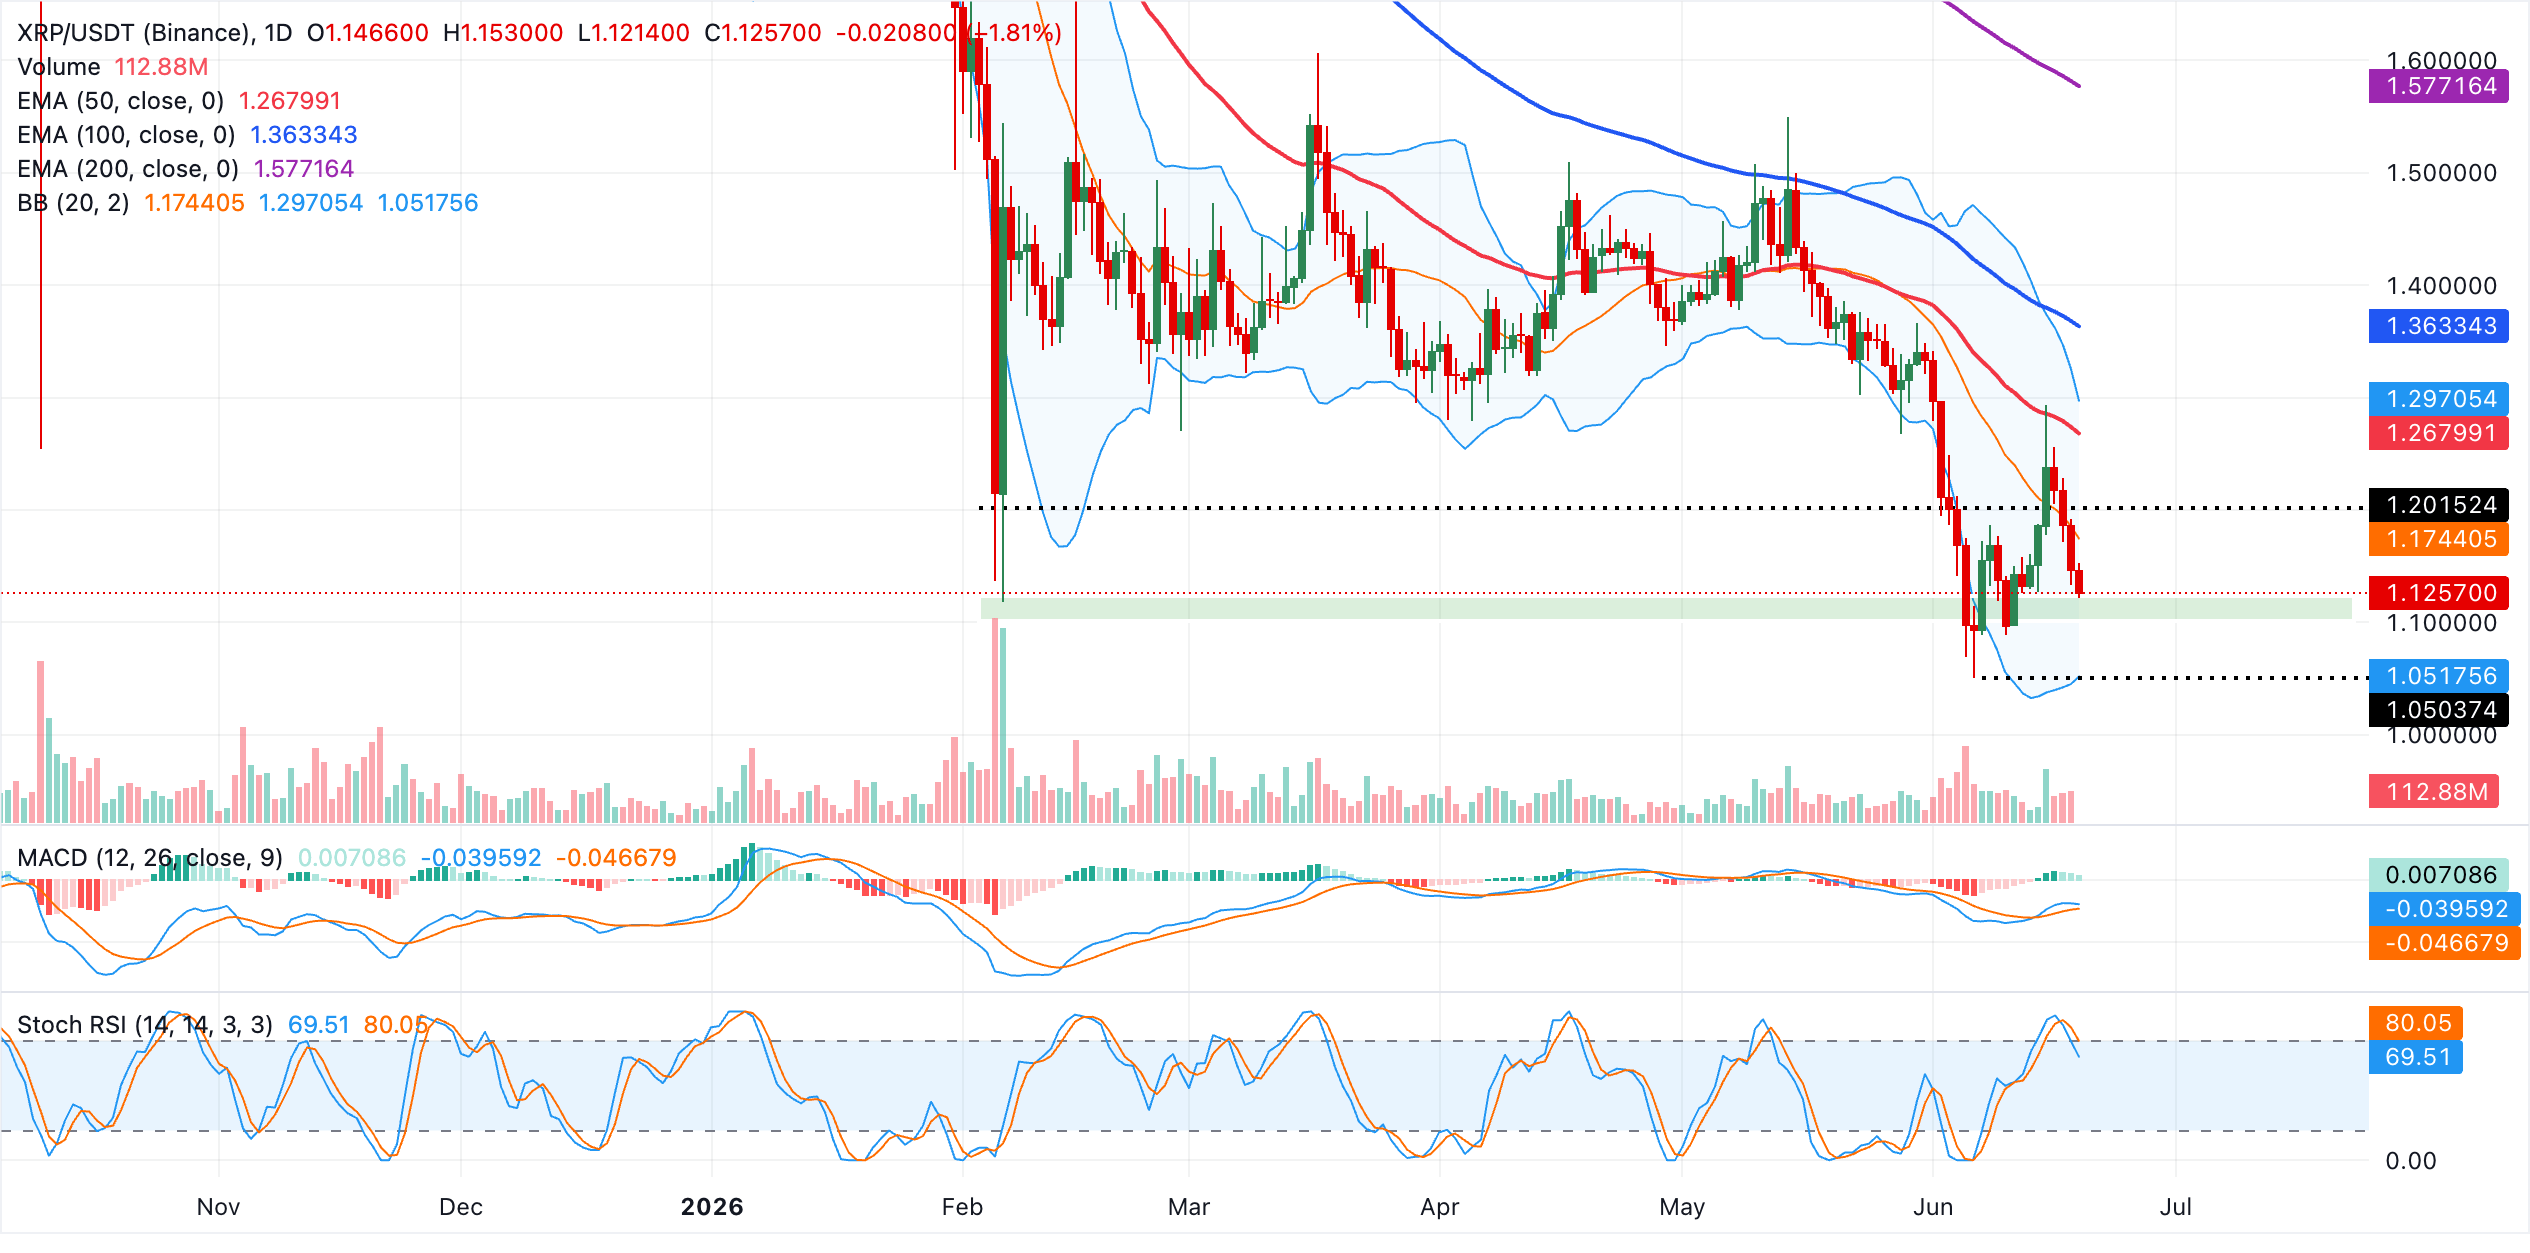
XRP faces initial resistance at the Bollinger middle band around $1.17, with further hurdles at the 50-day EMA ($1.27) and the upper Bollinger band ($1.30). Stronger resistance levels are observed at the 100-day EMA around $1.36 and 200-day EMA at $1.58.
To the downside, the lower Bollinger band near $1.05 acts as key support. A sustained move below this threshold could accelerate losses toward the psychologically significant $1.00 level, maintaining a bearish bias for the broader technical outlook.
(The technical analysis of this story was written with the help of an AI tool.)
Crypto ETF FAQs
An Exchange-Traded Fund (ETF) is an investment vehicle or an index that tracks the price of an underlying asset. ETFs can not only track a single asset, but a group of assets and sectors. For example, a Bitcoin ETF tracks Bitcoin’s price. ETF is a tool used by investors to gain exposure to a certain asset.
Yes. The first Bitcoin futures ETF in the US was approved by the US Securities & Exchange Commission in October 2021. A total of seven Bitcoin futures ETFs have been approved, with more than 20 still waiting for the regulator’s permission. The SEC says that the cryptocurrency industry is new and subject to manipulation, which is why it has been delaying crypto-related futures ETFs for the last few years.
Yes. The SEC approved in January 2024 the listing and trading of several Bitcoin spot Exchange-Traded Funds, opening the door to institutional capital and mainstream investors to trade the main crypto currency. The decision was hailed by the industry as a game changer.
The main advantage of crypto ETFs is the possibility of gaining exposure to a cryptocurrency without ownership, reducing the risk and cost of holding the asset. Other pros are a lower learning curve and higher security for investors since ETFs take charge of securing the underlying asset holdings. As for the main drawbacks, the main one is that as an investor you can’t have direct ownership of the asset, or, as they say in crypto, “not your keys, not your coins.” Other disadvantages are higher costs associated with holding crypto since ETFs charge fees for active management. Finally, even though investing in ETFs reduces the risk of holding an asset, price swings in the underlying cryptocurrency are likely to be reflected in the investment vehicle too.
Bài viết đề xuất


