


XRP rises as $300,000 flows into Ripple funds, traders digest SEC appeal in lawsuit
- XRP funds see rise in capital inflows from institutions last week, according to CoinShares digital asset fund flow report.
- SEC appeal and 1 billion token unlock are other key market movers for the altcoin.
- XRP trades at $0.5430, gaining nearly 2% on Monday.
Ripple (XRP) price on Monday is being influenced by the token unlock on October 1, XRP fund flows and sentiment among crypto market participants. XRP gains nearly 2% on the day, the altcoin trades above key support at $0.5200.
Daily Digest Market Movers: XRP funds sees rise in capital inflow
- CoinShares Digital Asset Flows Report shows XRP-based funds received $300,000 in capital inflows last week.
- In the same time frame, the two largest assets by market capitalization noted negative flows: Bitcoin recorded a $159 million in outflows, and Ethereum funds lost $28.9 million.
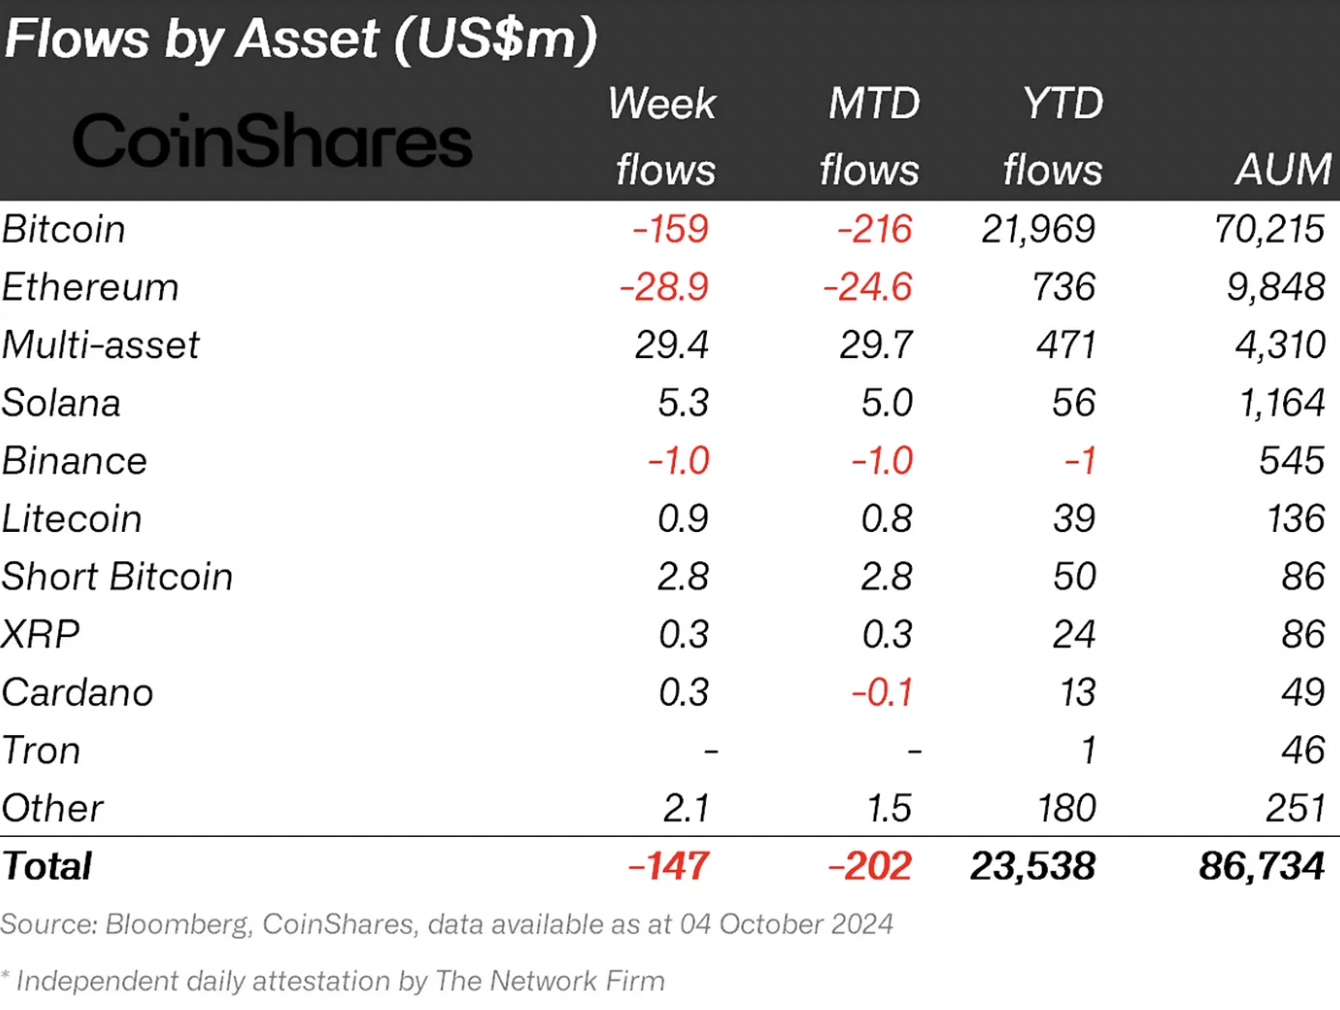
Fund flows by asset
- The rising capital inflows to XRP is indicative of demand among institutional investors.
- XRP traders are watching the developments in the Securities & Exchange Commission’s (SEC) lawsuit appeal against the payment remittance firm.
- The SEC appealed against the final ruling, which imposed a $125 million fine on Ripple for the institutional sale of XRP tokens.
- Another factor influencing the asset is the 1 billion XRP token unlock, part of a scheduled token release by the payment firm. The release of a large volume of XRP tokens during each unlock negatively influences the asset’s price.
Technical analysis: XRP could extend losses by another 7%
Ripple started its multi-month downward trend in July 2023, post the top of $0.9380. The altcoin is likely to extend losses by 7% and sweep liquidity at $0.5026, a key support level for XRP. This level coincides with the September 6 low.
The red histogram bars on the Moving Average Convergence Divergence (MACD) indicator signal an underlying negative momentum in XRP price.
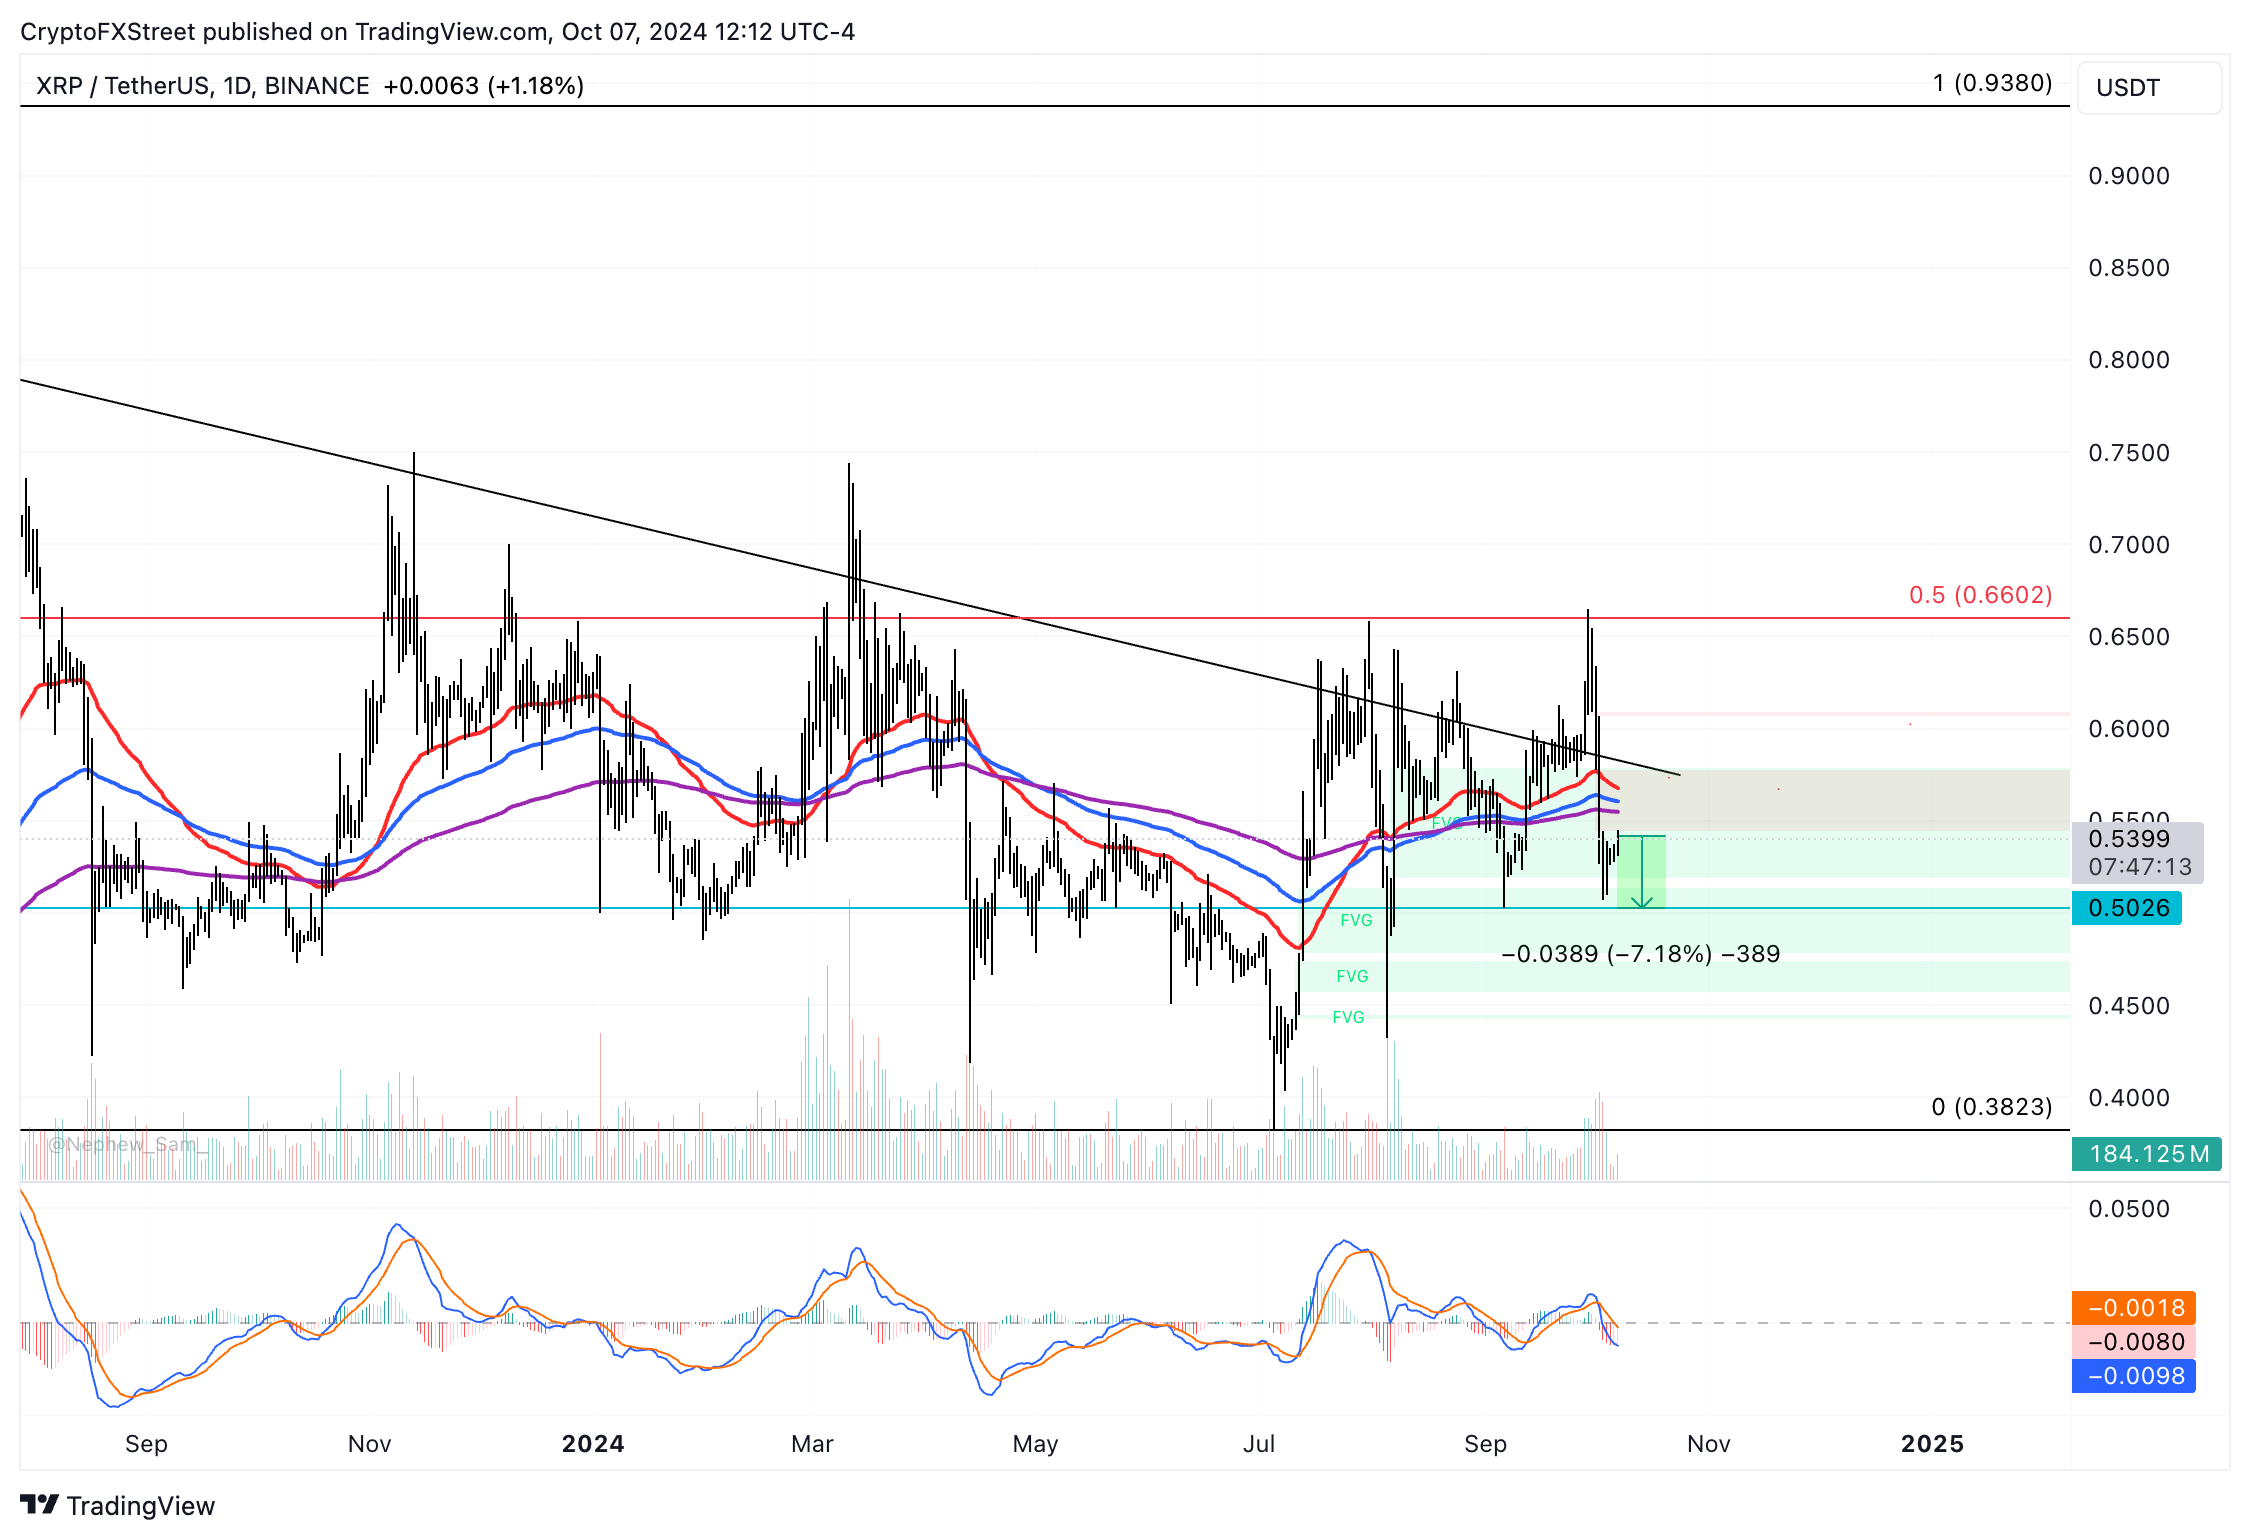
XRP/USDT daily chart
If there is a daily candlestick close above the 200-day Exponential Moving Average at $0.5548, it could invalidate the bearish thesis. XRP could then attempt a recovery to $0.6000, the October 2 high and a psychologically important price level for the altcoin.
Bitcoin, altcoins, stablecoins FAQs
Bitcoin is the largest cryptocurrency by market capitalization, a virtual currency designed to serve as money. This form of payment cannot be controlled by any one person, group, or entity, which eliminates the need for third-party participation during financial transactions.
Altcoins are any cryptocurrency apart from Bitcoin, but some also regard Ethereum as a non-altcoin because it is from these two cryptocurrencies that forking happens. If this is true, then Litecoin is the first altcoin, forked from the Bitcoin protocol and, therefore, an “improved” version of it.
Stablecoins are cryptocurrencies designed to have a stable price, with their value backed by a reserve of the asset it represents. To achieve this, the value of any one stablecoin is pegged to a commodity or financial instrument, such as the US Dollar (USD), with its supply regulated by an algorithm or demand. The main goal of stablecoins is to provide an on/off-ramp for investors willing to trade and invest in cryptocurrencies. Stablecoins also allow investors to store value since cryptocurrencies, in general, are subject to volatility.
Bitcoin dominance is the ratio of Bitcoin's market capitalization to the total market capitalization of all cryptocurrencies combined. It provides a clear picture of Bitcoin’s interest among investors. A high BTC dominance typically happens before and during a bull run, in which investors resort to investing in relatively stable and high market capitalization cryptocurrency like Bitcoin. A drop in BTC dominance usually means that investors are moving their capital and/or profits to altcoins in a quest for higher returns, which usually triggers an explosion of altcoin rallies.
Bài viết đề xuất


