

Bitcoin Weekly Forecast: Fed-led rally could have legs towards $65,000
- Bitcoin is poised for a second consecutive week of gains, supported by the recent 50-basis-point cut in interest rates by the Federal Reserve.
- Bitcoin broke above several key technical resistances this week, signaling a rally continuation.
- US spot Bitcoin ETFs posted $305.20 million in inflows until Thursday.
Bitcoin (BTC) has risen 7% so far this week, supported by the US Federal Reserve (Fed) interest-rate cut and more than $300 million in ETFs inflows. The recent surge led BTC price to shatter several key technical resistance levels, a sign that the current two-week rally has likely some more way to go towards $65,000.
Macroeconomics supports Bitcoin's gains
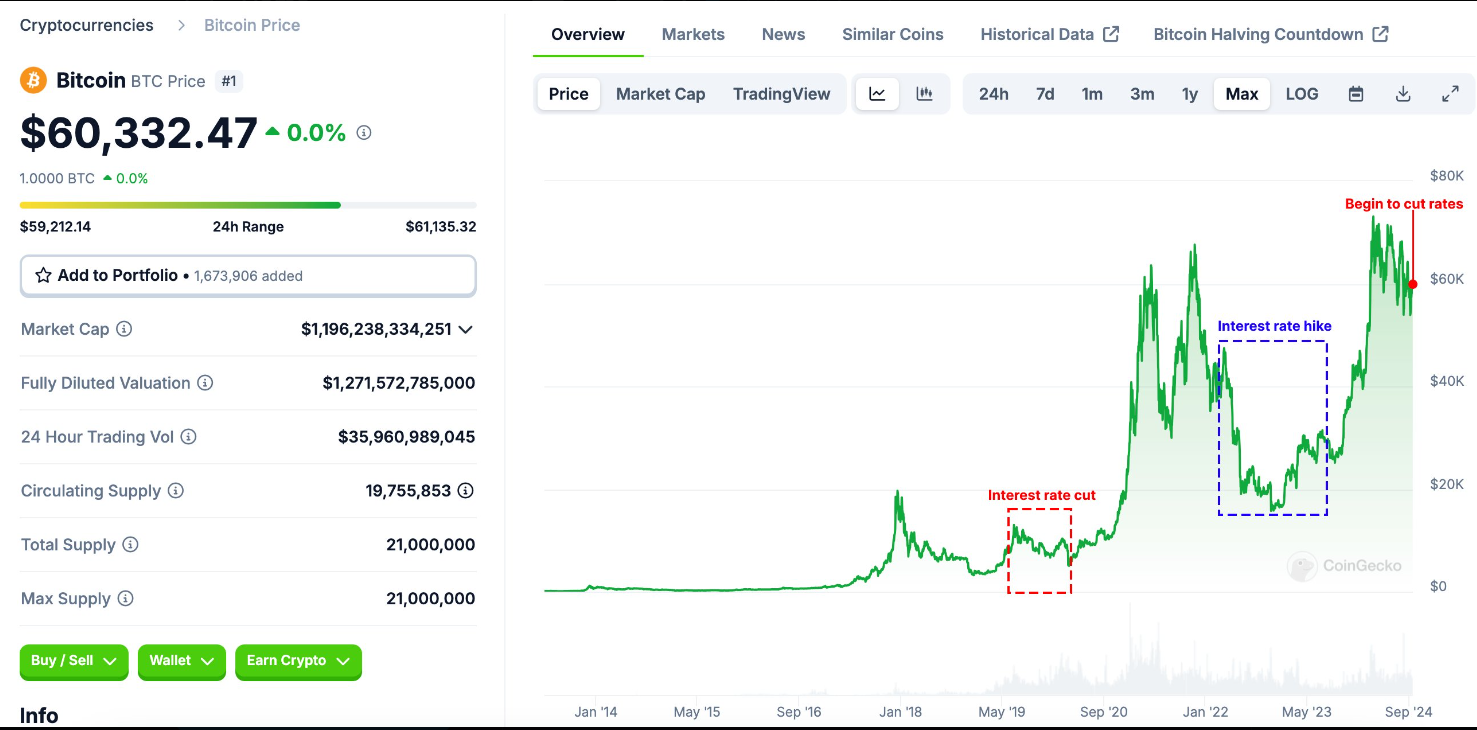
Bitcoin rose 7% this week to trade above $63,000. These gains were mostly caused by the US Federal Reserve’s 50-basis-point (bps) cut in interest rates on Wednesday. This big rate cut is generally considered a bullish sign for cryptocurrencies, stocks, and global risk markets. Lower borrowing costs generally provide more purchasing power for investors, who would invest their money into assets rather than keep it in the bank.
The Lookonchain chart below further explains how the Federal Reserve Rate has historically impacted Bitcoin’s Price.
At the start of the COVID crisis in 2020, the Federal Reserve aggressively cut interest rates, bringing them to the 0%-0.25% range. The low interest rate environment sparked a rally in Bitcoin’s price, which surged from around $5,000 to $60,000.
Still, the Covid-19 pandemic era is a tricky time to compare with because many other factors come into play to explain the surge in crypto prices, from the direct rounds of stimulus checks received by US households to the fact that lockdowns made it very difficult for consumers to spend money in leisure activities outdoors.
Conversely, the rate hikes between March and December 2022, increasing rates to the 4.25%-4.50% range, negatively impacted Bitcoin, causing its price to plummet from approximately $46,000 to $16,000.
The current reduction of the interest rate by 50 basis points, to the 4.75%-5.00% range, could produce effects similar to those observed during the COVID crisis. However, while the 2020 rate cut significantly influenced Bitcoin’s price due to the global nature of the crisis, the anticipated 2024 reduction may have a positive but less pronounced impact.
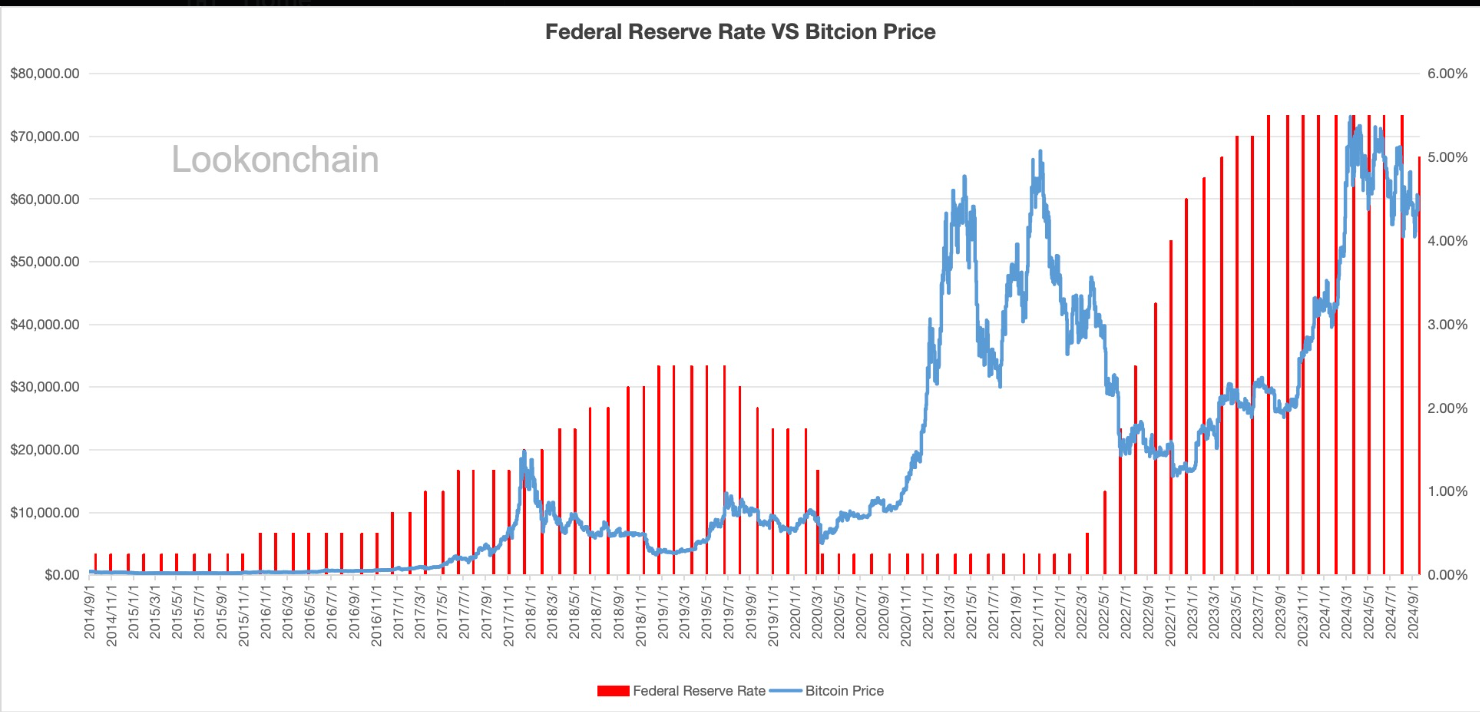
Federal Reserve Rate VS Bitcoin Price Chart
Economist and Gold advocate Peter Schiff warned about the Fed’s rate cut in a post on Twitter on Wednesday. “Not only will this round of rate cuts not stop a cooling economy from entering a recession, but it will also turn up the heat on inflation, making the recession that much worse,” he said.
Schiff also commented, “Not only did the Fed’s 50 basis point rate cut send gold to a record high above $2,595, but it also sent the US dollar sinking below 0.84 Swiss francs, a new 13-year low.” In his view, the rate cut could shift investors from risky assets like Bitcoin to more safe-haven assets like Gold.
As expected, the #Fed caved to the markets and cut interest rates by 50 basis points. Not only will this round of rate cuts not stop a cooling economy from entering a #recession, but it will also turn up the heat on #inflation, making the recession that much worse. Buy #gold now.
— Peter Schiff (@PeterSchiff) September 18, 2024
US spot Bitcoin ETFs see inflows
Institutional flows supported Bitcoin’s price this week. According to Coinglass data, US spot Bitcoin ETFs experienced three days of inflow and one day of mild outflows until Thursday, totaling $305.20 million in net inflows. This increase in inflows shows a rise in institutional demand. The total Bitcoin reserves held by the 11 US spot Bitcoin ETFs rose from $50.36 billion to $50.67 billion in Assets Under Management (AUM) this week.
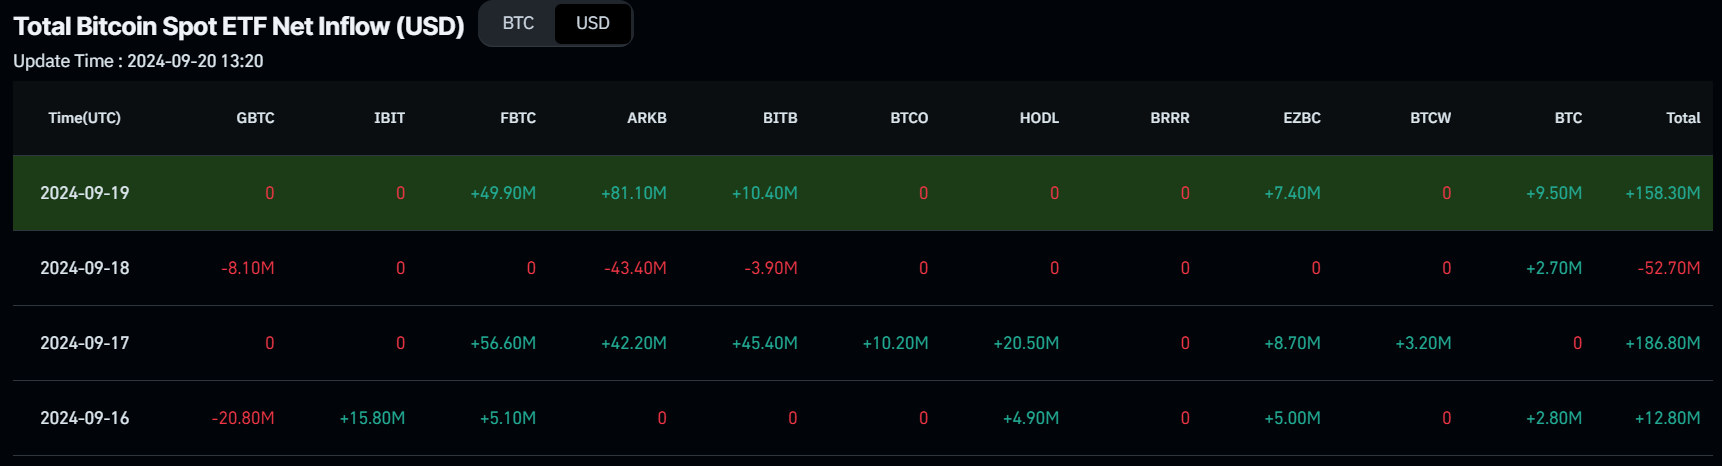
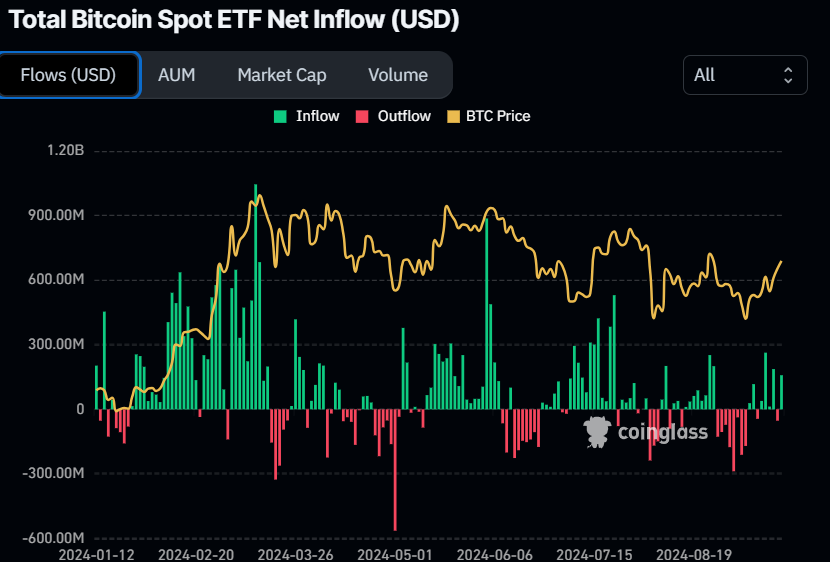
Bitcoin Spot EFT Net Flow chart
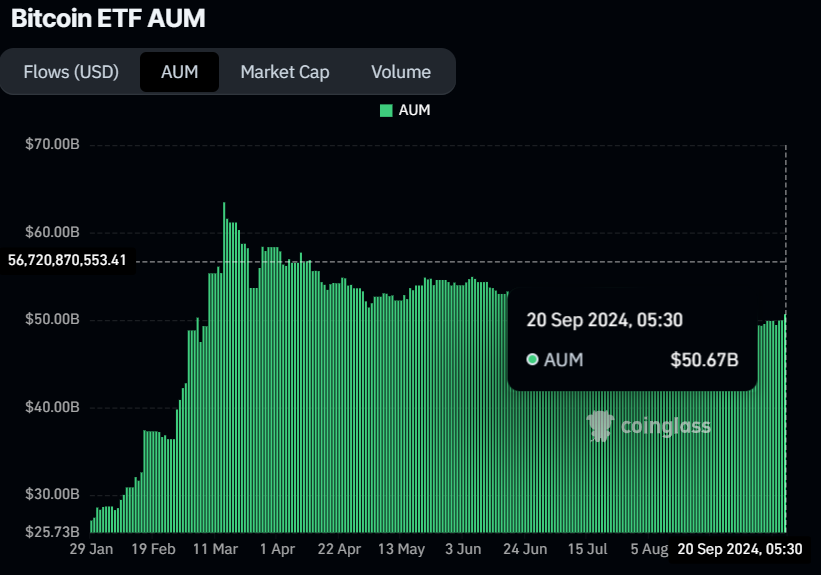
Bitcoin ETF AUM chart
Investors appear to be still bullish about Bitcoin
According to Gemini 2024 Global State of Crypto report, 57% of crypto owners are comfortable making crypto a significant part of their investment portfolio. Additionally, more than 27% of past owners have the same view, signaling many may soon re-enter the crypto market.
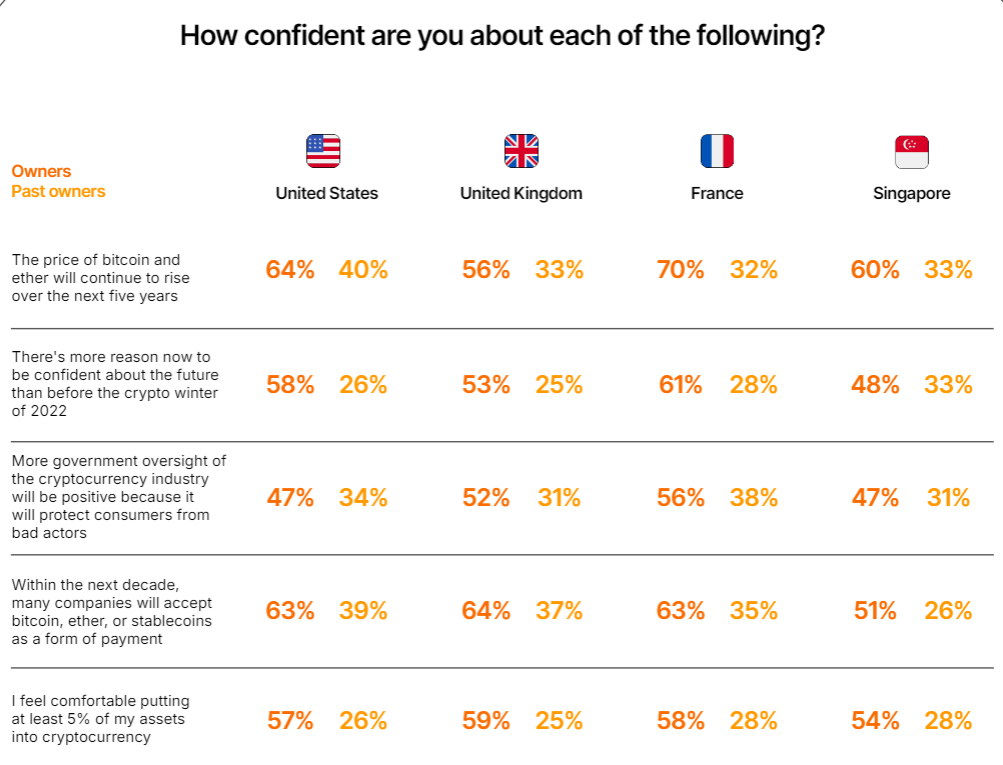
Countries' confidence in crypto chart
Furthermore, it also mentions that in a survey in the US, 37% of Bitcoin owners hold some BTC through ETF. More than 13% own exclusively through an ETF, suggesting that they entered crypto markets through these investment vehicles when they were introduced in January.
However, the report also highlights growing concerns over regulatory issues. In 2024, a higher percentage of respondents from the US, UK, and Singapore identified regulatory uncertainty as a barrier to investing in crypto compared to 2022.
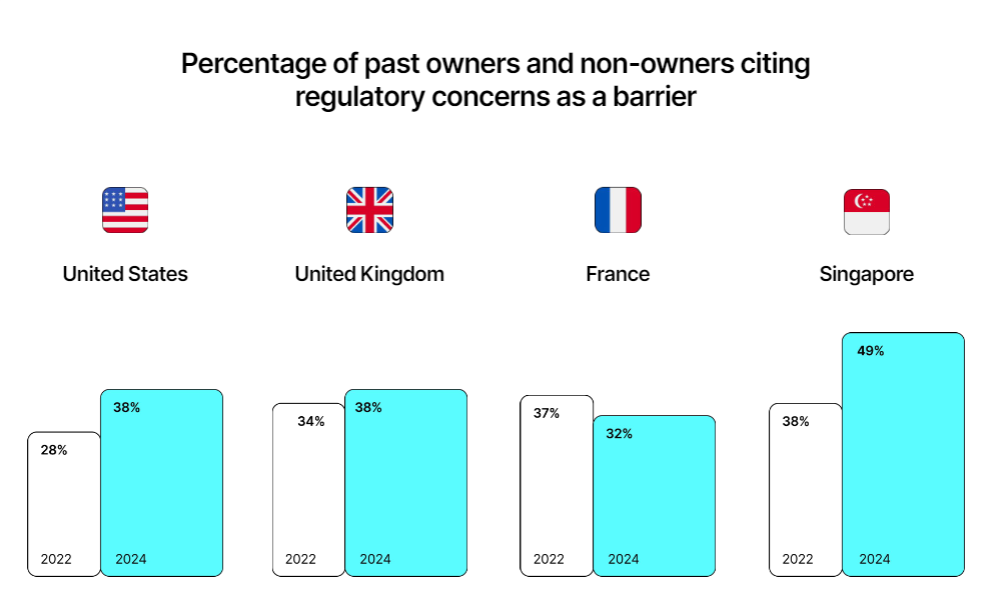
Countries' regulatory concerns chart
Upcoming US elections impact
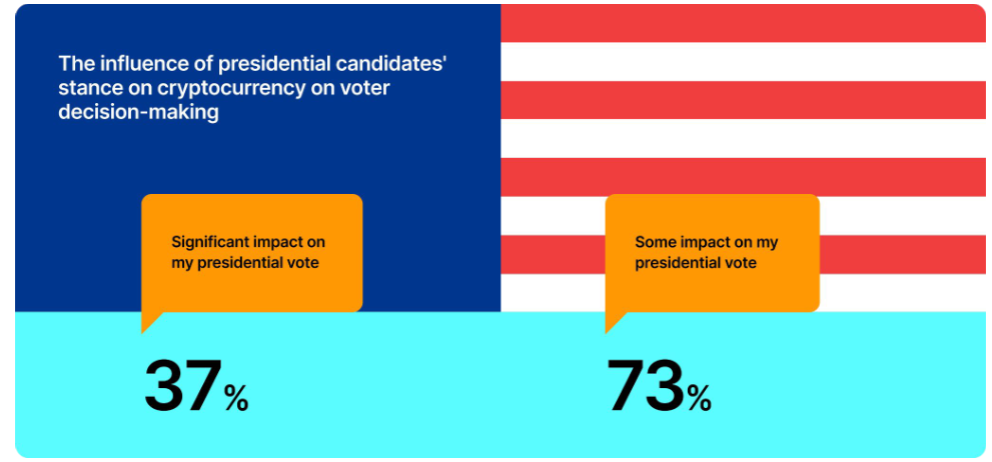
The Gemini report also dives into the US presidential elections, noting that crypto has become a significant campaign issue “for the first time in US history”
Among the respondents who own crypto, the vast majority (73%) plan to consider a candidate’s stance on crypto when they vote, the report says. More than a third (37%) said that this would have a “significant” impact on their vote.
BTC eyes $65,000
Bitcoin’s price broke above the descending trendline (drawn from multiple high levels from the end of July) and closed above the 100-day Exponential Moving Average (EMA) at $60,850 earlier in the week. On Thursday, it closed above its 61.8% Fibonacci retracement level of around $62,000. At the time of writing on Friday, BTC extends gains and trades above $63,000.
If the 200-day EMA at $60,850 holds as support, BTC could extend its gains to retest its daily resistance level at $65,379.
The Moving Average Convergence Divergence (MACD) indicator further supports BTC’s rise, signaling a bullish crossover on the daily chart. The MACD line (blue line) moved above the signal line (yellow line), giving a buy signal. Furthermore, the Relative Strength Index (RSI) trades at 63 – above its neutral level of 50 – and tilts higher, indicating strong bullish momentum.
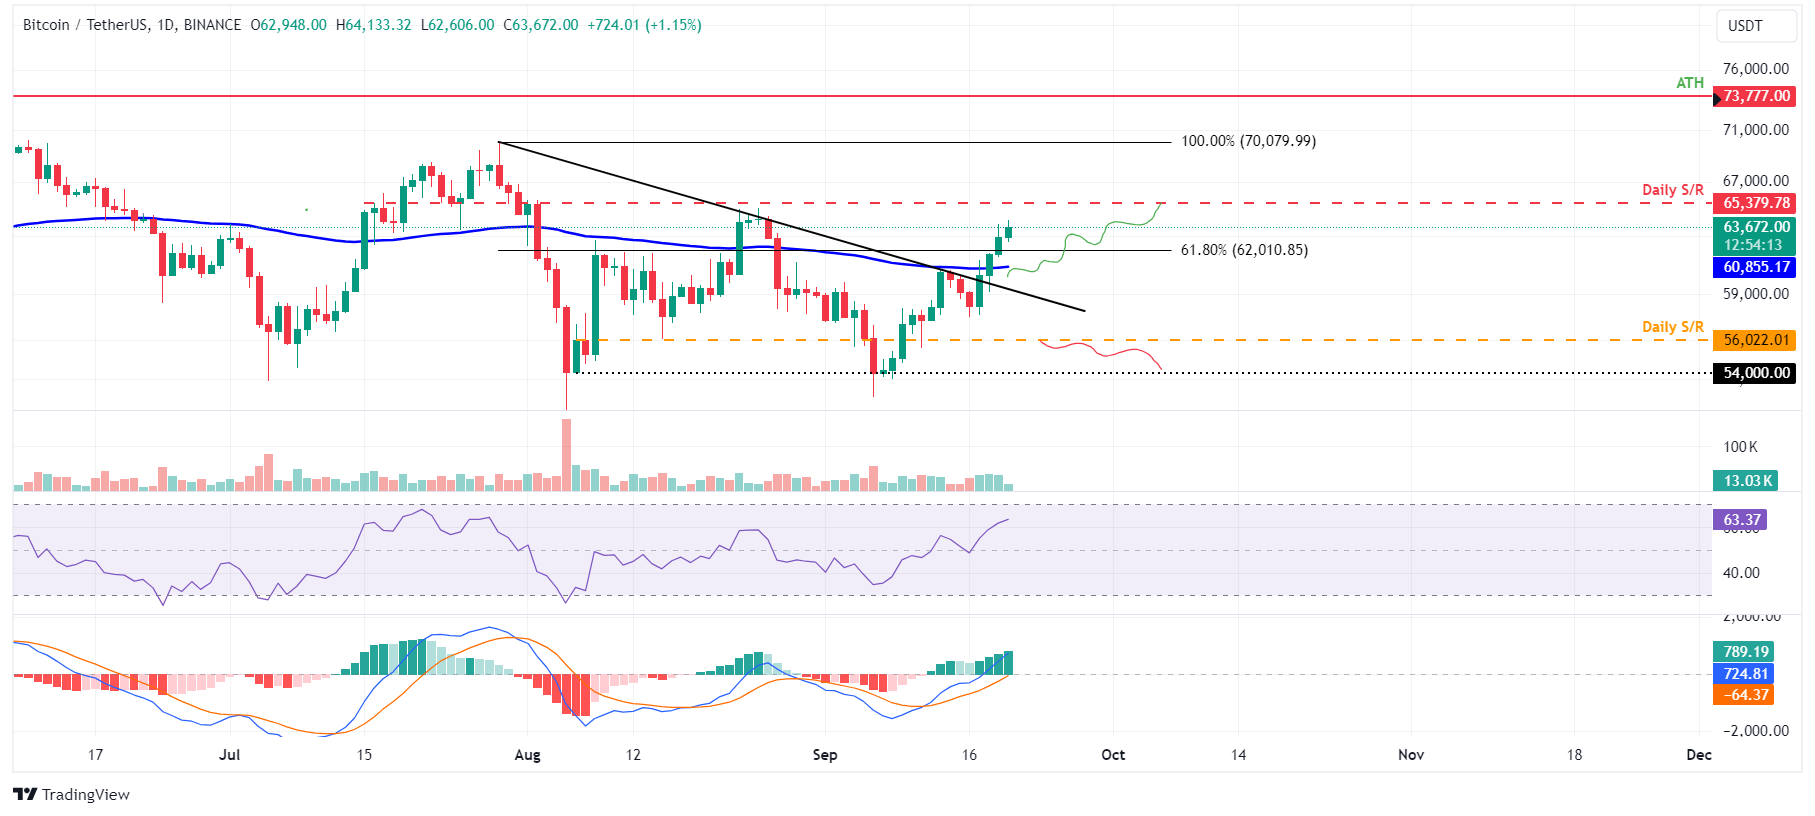
BTC/USDT daily chart
However, the bullish thesis will be invalidated if BTC breaks below the descending trendline and closes below the $56,022 daily support level. In that case, Bitcoin’s price could extend the decline by 3.6% to retest its psychologically important level at $54,000.
Bitcoin, altcoins, stablecoins FAQs
Bitcoin is the largest cryptocurrency by market capitalization, a virtual currency designed to serve as money. This form of payment cannot be controlled by any one person, group, or entity, which eliminates the need for third-party participation during financial transactions.
Altcoins are any cryptocurrency apart from Bitcoin, but some also regard Ethereum as a non-altcoin because it is from these two cryptocurrencies that forking happens. If this is true, then Litecoin is the first altcoin, forked from the Bitcoin protocol and, therefore, an “improved” version of it.
Stablecoins are cryptocurrencies designed to have a stable price, with their value backed by a reserve of the asset it represents. To achieve this, the value of any one stablecoin is pegged to a commodity or financial instrument, such as the US Dollar (USD), with its supply regulated by an algorithm or demand. The main goal of stablecoins is to provide an on/off-ramp for investors willing to trade and invest in cryptocurrencies. Stablecoins also allow investors to store value since cryptocurrencies, in general, are subject to volatility.
Bitcoin dominance is the ratio of Bitcoin's market capitalization to the total market capitalization of all cryptocurrencies combined. It provides a clear picture of Bitcoin’s interest among investors. A high BTC dominance typically happens before and during a bull run, in which investors resort to investing in relatively stable and high market capitalization cryptocurrency like Bitcoin. A drop in BTC dominance usually means that investors are moving their capital and/or profits to altcoins in a quest for higher returns, which usually triggers an explosion of altcoin rallies.
Bài viết đề xuất


