

Crypto Today: Bitcoin, Ethereum, Ripple climb higher, beat mid-week slump even as selling pressure persists
- Bitcoin trades above $58,000 on Wednesday, following two consecutive days of positive inflows in Spot ETFs this week.
- Ethereum trades above psychological resistance at $3,000 as founder Vitalik Buterin and key influencers speak at EthCC conference on Wednesday.
- Ripple sustains above $0.43 as traders await end of SEC lawsuit and analyst predicts double-digit target for XRP in 2025.
Bitcoin, Ethereum, Ripple update
- Bitcoin trades at $58,103 at the time of writing. The largest asset by market capitalization extended gains on Wednesday even as the German government continued its BTC transfers and market participants remained fearful. The crypto fear and greed index reads fear on Wednesday, signaling there could be a buying opportunity for sidelined traders. Bitcoin price struggles around $58,000 despite investors quietly accumulating.
- Ethereum trades above the psychological barrier at $3,000 on Wednesday. The second largest cryptocurrency has noted a decline in its social dominance on July 10, despite the Ethereum Community Conference (EthCC) and the upcoming Exchange Traded Fund (ETF) approval awaited by traders. Key Ethereum personalities like founder Vitalik Buterin and Gavin Wood of Polkadot spoke at the event on Wednesday, per an official update.
Three legends on stage together for 10 years of #Ethereum
— EthCC - Ethereum Community Conference (@EthCC) July 10, 2024
A huge ‘thank you!’ to @VitalikButerin, @gavofyork & @ethereumJoseph for speaking at EthCC[7] back-to-back today, we’re so grateful to bring the community together for this moment! ✨ pic.twitter.com/Jyotu1BkcZ
Ethereum ETFs poised to defy market underpricing
- Ripple lawsuit rages on while XRP traders await a final ruling in the case. Pro-crypto attorney Fred Rispoli expects an end to the lawsuit as early as July 13 and latest by the end of July, 2024. XRP trades at $0.43 at the time of writing, up 0.5% on Wednesday. Ripple lawsuit ruling awaited while analyst sets double-digit target for XRP in 2025
Chart of the day
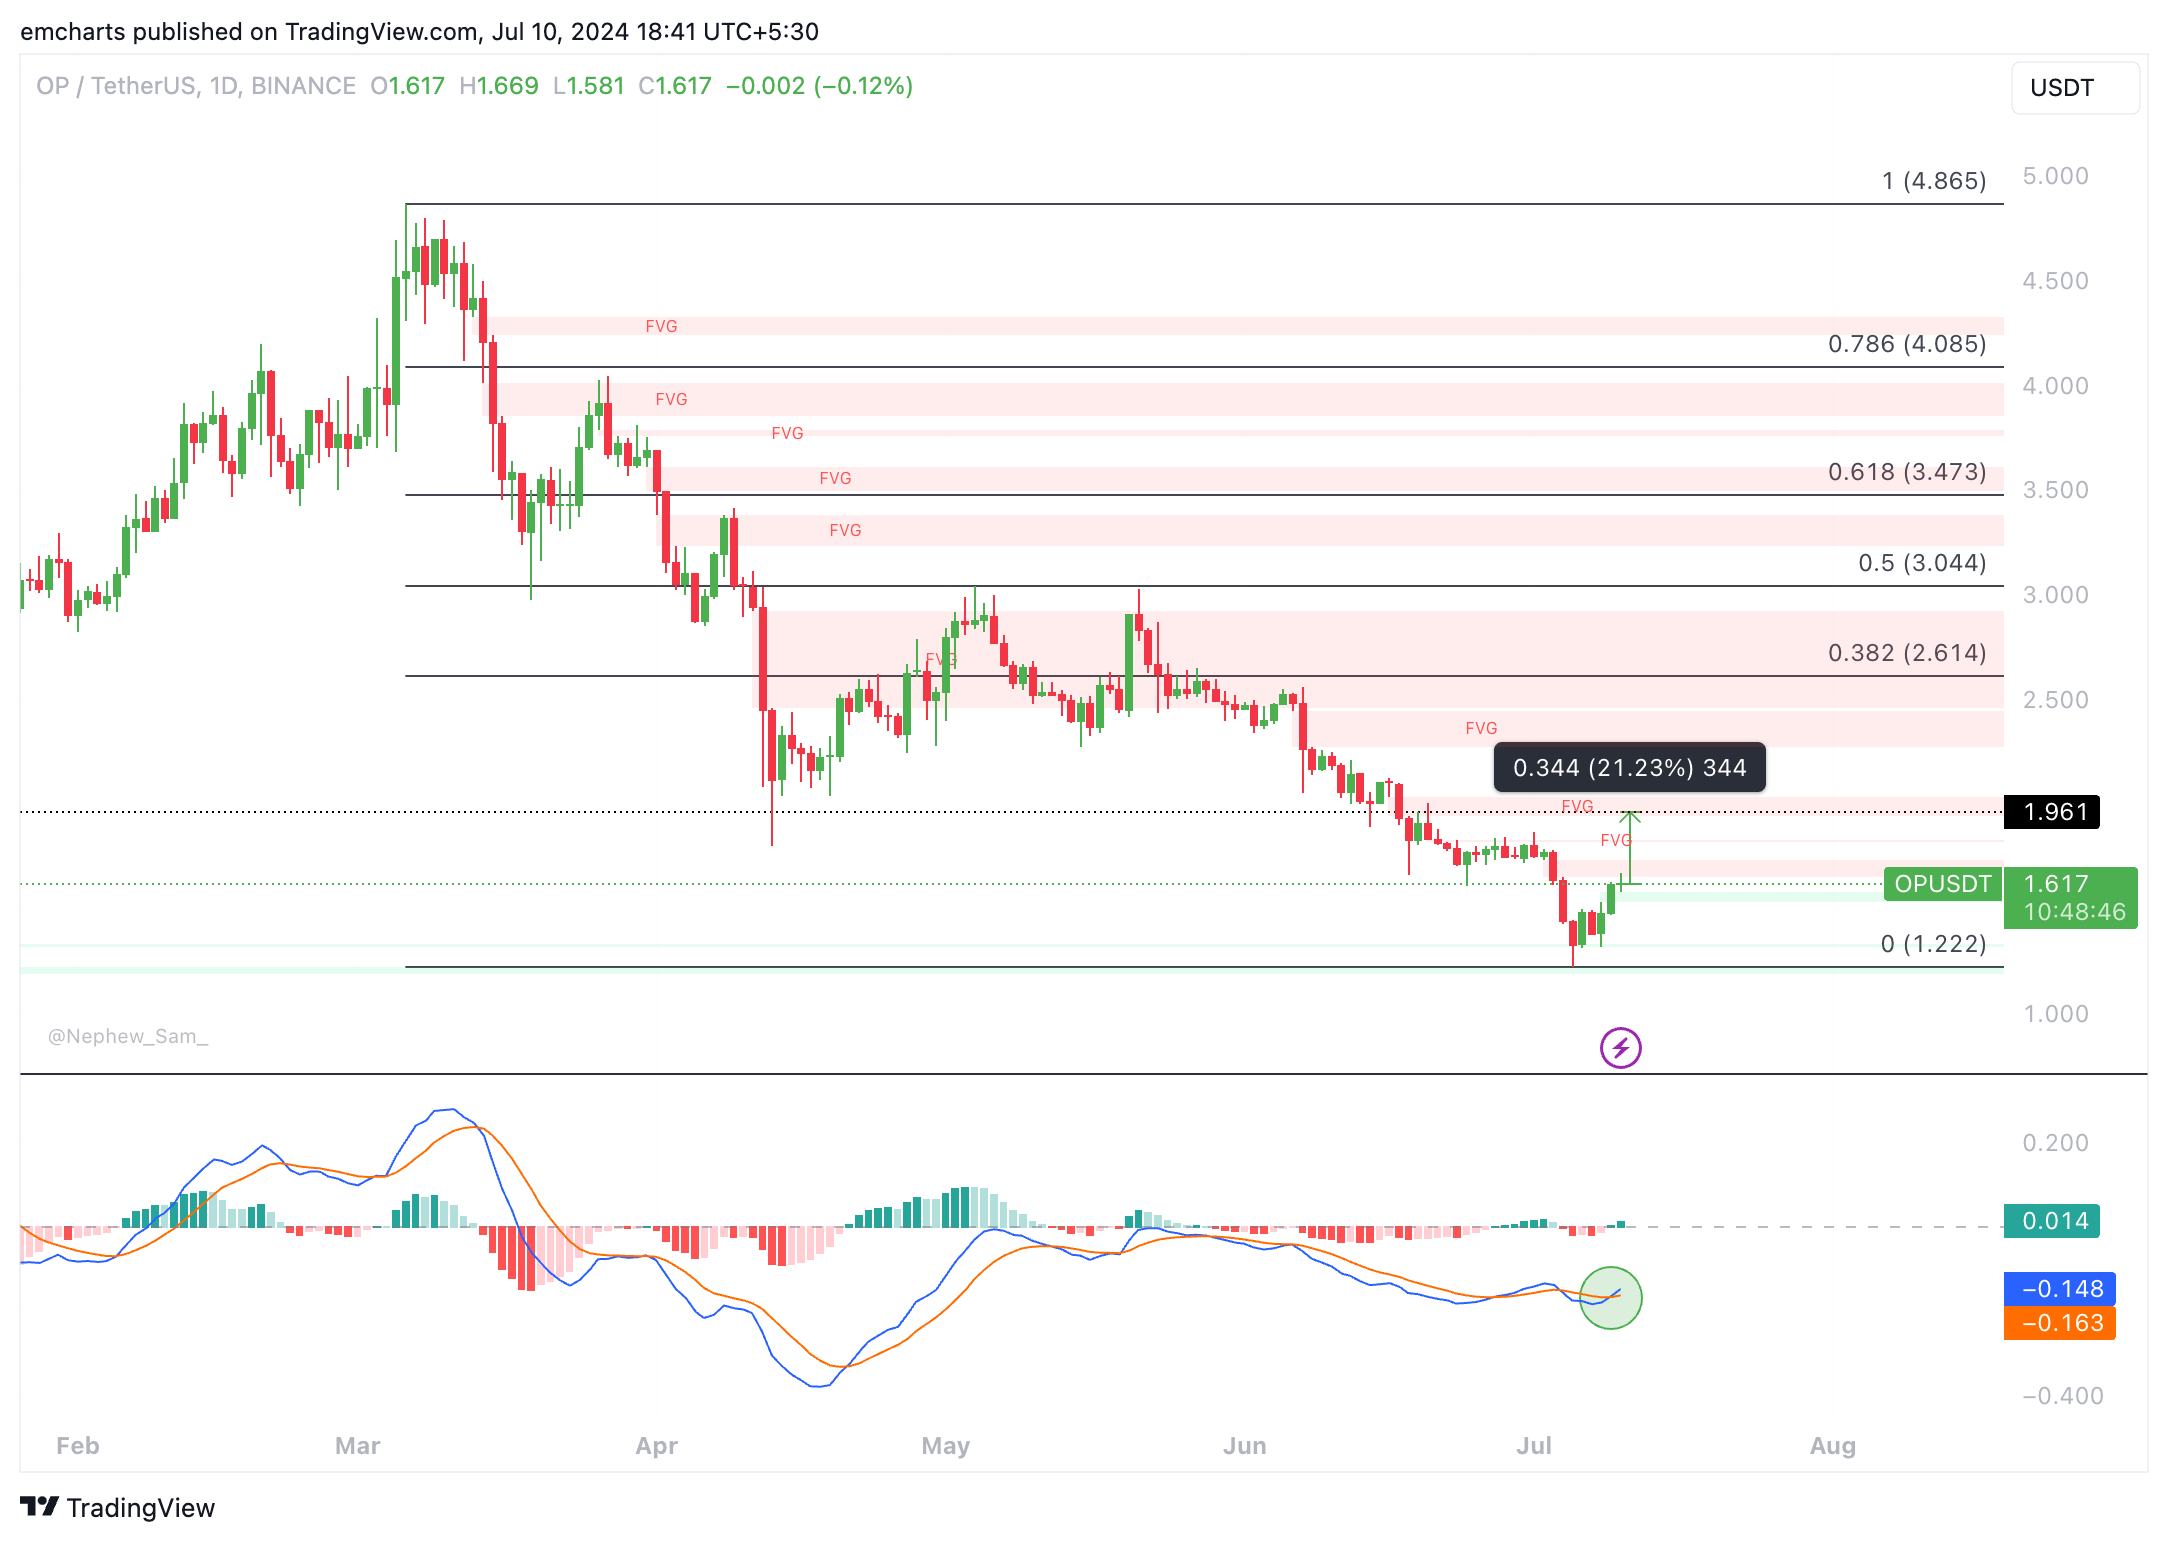
OP/USDT daily chart
Optimism (OP) is currently in an uptrend. The Layer 2 Ethereum scaling token is likely to extend its gains by over 21% and rally to the lower boundary of the Fair Value Gap (FVG) at $1.961, as seen in the OP/USDT daily chart.
OP faces resistance at the upper boundary of the FVG at $1.733.
The momentum indicator Moving Average Convergence Divergence (MACD) supports the bullish thesis. The green bars above the neutral line and the MACD line crossing above the signal line are signs of underlying positive momentum in OP’s upward trend.
OP could find support at the July 5 low of $1.222.
Market updates
- Vitalik Buterin said at the EthCC that Ethereum needs to be prepared for a 51% attack with an automated response mechanism to reduce the burden on the social level, per Colin Wu’s report.
以太坊创始人 Vitalik 近日在 ETHCC 会议上表示,以太坊需要为应对 51% 攻击做好准备。51% 攻击是指恶意行为者(或多方协调)控制了超过一半的区块链网络的计算能力,从而能够操纵和控制区块链的运行,例如审查交易或进行双重支付。他建议,网络应准备好自动化应对机制,以减少社会层面的负担。…
— 吴说区块链 (@wublockchain12) July 10, 2024
- MetaMask, a digital asset wallet, announced that MetaMask Portfolio now supports more than 30 DeFi protocols.
- On-chain intelligence tracker Lookonchain identified a large wallet investor’s purchase of AAVE and Uniswap (UNI) early on Wednesday. Typically, whale accumulation is a bullish sign for an asset.
A whale/institution bought $AAVE and $UNI again today.
— Lookonchain (@lookonchain) July 10, 2024
He deposited 4M $USDC to #Kraken, then withdrew 35,983 $AAVE($3M) and 123,183 $UNI($1M) from #Kraken.
He currently holds 142,296 $AAVE($12.1M) and 1.43M $UNI($11.6M).https://t.co/I5GL4GXr1L pic.twitter.com/7Qj0h3lP0F
Industry updates
- Coinbase Chief Legal Officer Paul Grewal said in a tweet on X that the exchange platform has filed an amicus (Friend of the court) brief in support of Legit.Exchange and the Crypto Freedom Alliance of Texas’ suit against the SEC.
A busy, busy day ahead. First up: @Coinbase filed an Amicus Brief in support of @LEJILEX and the Crypto Freedom Alliance of Texas suit against @SECgov’s overreach and regulation by enforcement campaign towards the digital asset industry. 1/5
— paulgrewal.eth (@iampaulgrewal) July 10, 2024
- Ripple was recognized by CNBC and Statista Charts as one of the World’s Top Fintech Companies in 2024.
We’re honored to be recognized by @CNBC and @StatistaCharts as one of the World’s Top Fintech Companies in 2024.
— Ripple (@Ripple) July 10, 2024
Thank you to our employees, customers, and supporters on the journey with us! https://t.co/GW0IUuh2su
- Bank of Israel’s Deputy Governor told Reuters that the bank will wait for the European Union’s (EU) decision before declaring its stance on Central Bank Digital Currency (CBDC).
Bài viết đề xuất


