

Pi Network Price Forecast: Weak momentum and waning demand reinforce downside bias

Nguồn Fxstreet
  • Pi Network edges lower on Monday, risking a break below its immediate near-term support around $0.0774.
  • Declining PI futures Open Interest and weekly spot trading volume suggest reduced demand among traders.
  • The technical outlook for PI indicates a downside bias as momentum remains weak.

Pi Network (PI) edges lower on Monday, risking a bearish conclusion to its short-term consolidation above the $0.0774 horizontal support. A steady decline in the notional value of active PI futures contracts and the weekly spot trading volume suggests reduced retail demand. The PI token risks a retest of its record low around $0.0704 as bearish momentum remains dominant on the daily chart. 

Pi Network loses retail support

Pi Network is in a long-term bearish trend, weighing on investors' confidence. Blockworks data shows PI is losing demand in the retail space, with weekly spot trading volume dropping to 30.36 million last week, extending a steady decline over the last four weeks after the $65.52 million peak in late September.

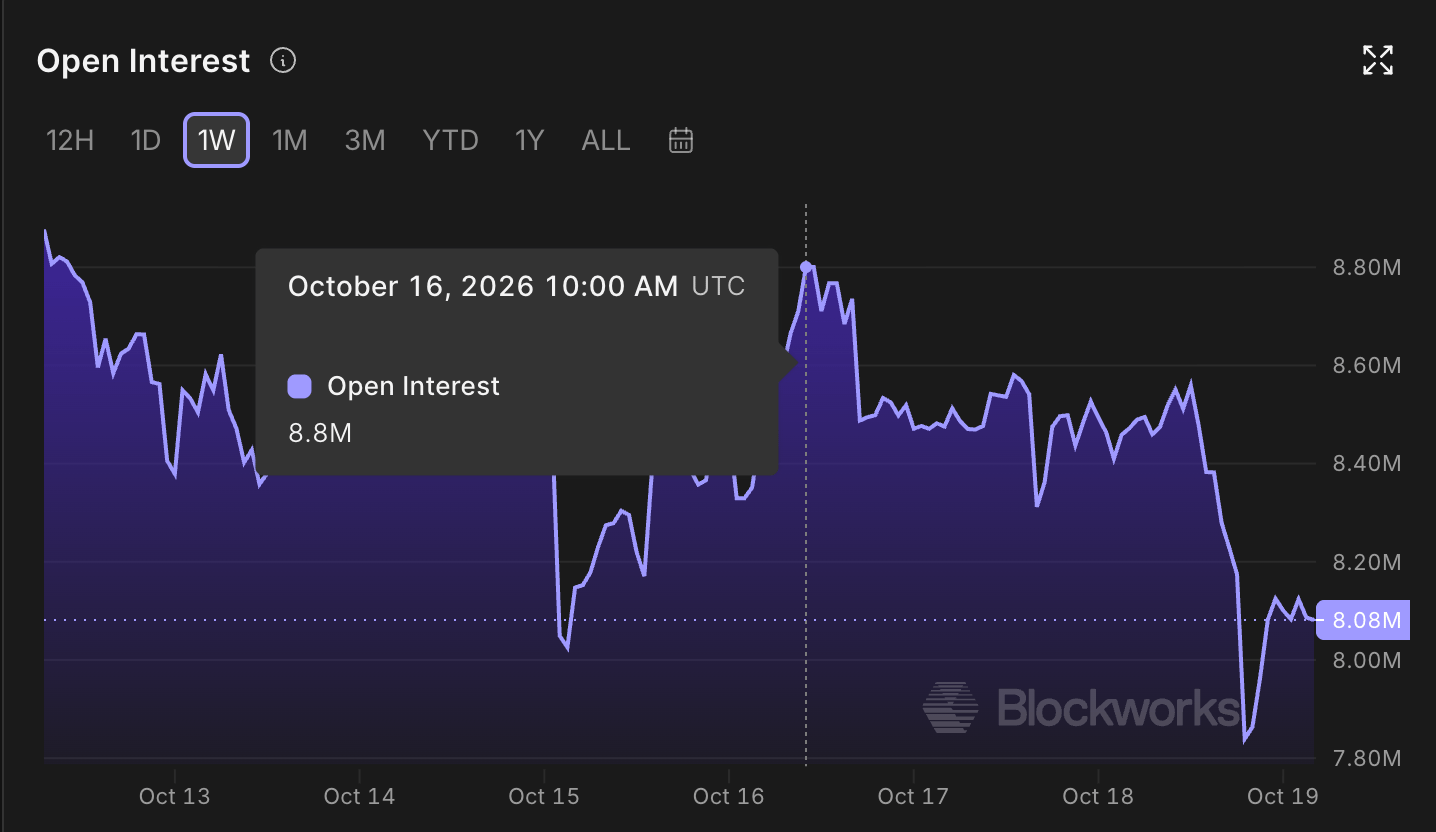
Similarly, the derivatives market is seeing reduced demand in PI futures. Blockworks data shows PI futures Open Interest (OI) is down to $8.08 million on Monday, from $8.80 million on Friday, suggesting a lower notional value of active contracts, driven by a lower spot price or a positional wipeout.
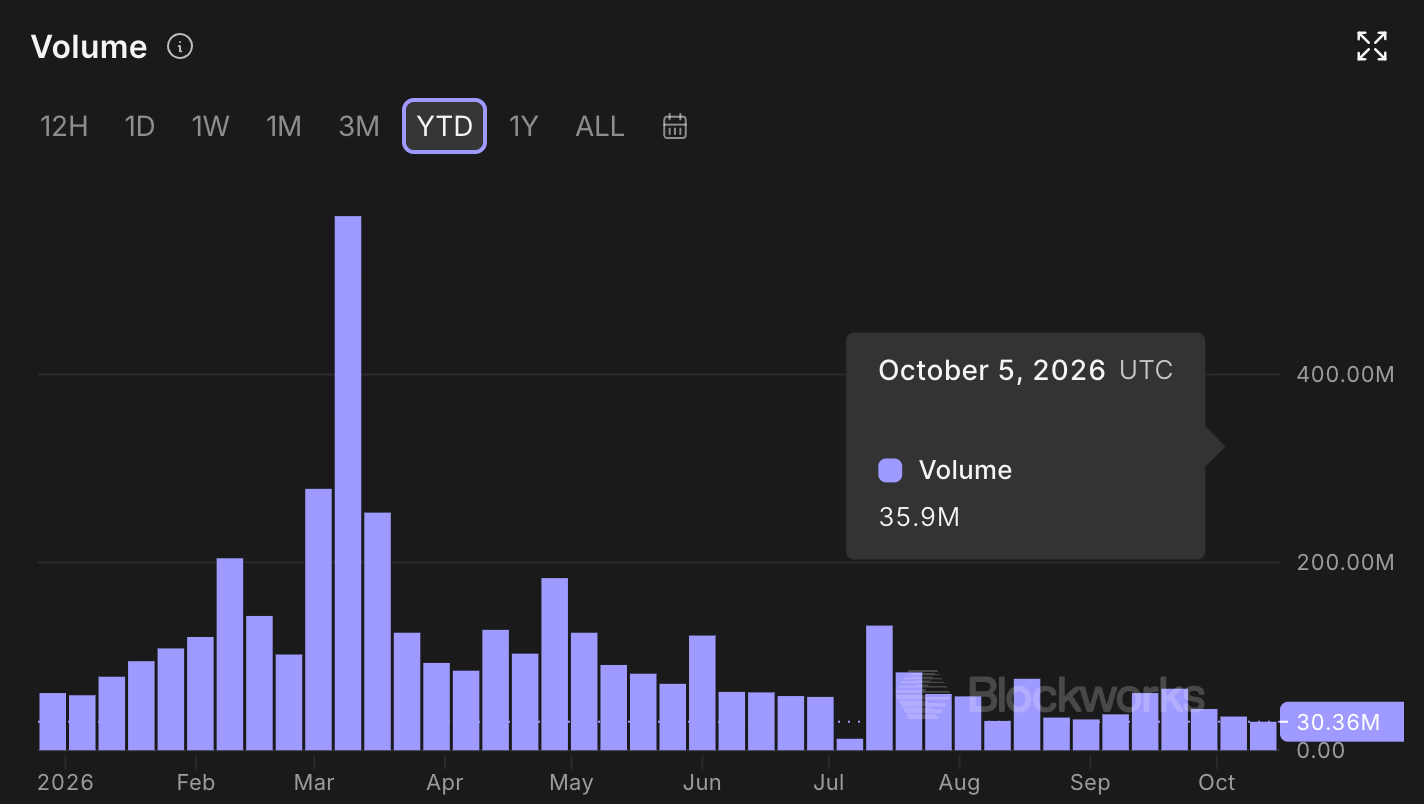
Pi Network trading volume data. Source: Blockworks
PI token Open Interest chart. Source: Blockworks

Technical outlook: Will Pi Network extend its decline to a fresh record low?

Pi Network trades around $0.0786 at press time on Monday, maintaining a long-term bearish bias. The PI token remains capped beneath the 50-day Exponential Moving Average (EMA) at $0.0865 and the broken downward trendline, which connects the June 20 and August 22 highs, at $0.0843.

From a technical perspective, the 23.6% Fibonacci retracement level, measured from $0.1394 to $0.0704, at $0.0866 reinforces the overhead barrier near the declining resistance trendline. To reinstate an upward trend, PI must surpass the 50-day EMA at $0.0865, which could extend the recovery toward the 50% retracement level at $0.1049.

The Relative Strength Index (RSI) at 37 signals soft but not extreme downside momentum, and the Moving Average Convergence Divergence (MACD) line remains marginally below its signal line, which together hint that sellers still retain control.

PI/USD daily price chart.

On the downside, the immediate technical floor is at the October 8 low of $0.0774, guarding the Fibonacci anchor at $0.0704. A decisive break beneath this structural low would open the door to a deeper bearish extension into untested waters.

(The technical analysis of this story was written with the help of an AI tool. Know more.)

Tuyên bố miễn trừ trách nhiệm: Chỉ dành cho mục đích thông tin. Hiệu suất trong quá khứ không đảm bảo cho kết quả trong tương lai.
placeholder
Nhìn lại lịch sử giá vàng trong 50 năm qua. Liệu vàng còn tiếp tục thời kỳ hoàng kim thêm 50 năm nữa? Trong 50 năm qua, vàng vẫn luôn giữ được vị thế là tài sản được ưa chuộng và phổ biến nhất thế giới. Giao dịch vàng luôn được các nhà đầu tư quan tâm do mức độ thanh khoản cao và tầm ảnh hưởng lớn đến toàn bộ thị trường tài chính. Vậy, lịch sử giá vàng như thế nào và cách đầu tư vàng ra sao? Chúng ta sẽ cùng tìm hiểu qua bài viết dưới đây.
Tác giả  Nhóm Traderins
ngày11 tháng 12 năm 2023
Trong 50 năm qua, vàng vẫn luôn giữ được vị thế là tài sản được ưa chuộng và phổ biến nhất thế giới. Giao dịch vàng luôn được các nhà đầu tư quan tâm do mức độ thanh khoản cao và tầm ảnh hưởng lớn đến toàn bộ thị trường tài chính. Vậy, lịch sử giá vàng như thế nào và cách đầu tư vàng ra sao? Chúng ta sẽ cùng tìm hiểu qua bài viết dưới đây.
placeholder
WTI đạt mức tăng khiêm tốn trên mức 88,50$ nhờ mức giảm bất ngờ của EIA, xung đột ở Trung Đông được chú ýWest Texas Intermediate (WTI), chuẩn dầu thô của Mỹ, đang giao dịch quanh mức 88,55$ trong đầu phiên giao dịch châu Á vào thứ Năm. WTI ghi nhận mức tăng khiêm tốn khi tồn kho dầu thô Mỹ bất ngờ giảm vào tuần trước
Tác giả  FXStreet
10 tháng 08 ngày Thứ Năm
West Texas Intermediate (WTI), chuẩn dầu thô của Mỹ, đang giao dịch quanh mức 88,55$ trong đầu phiên giao dịch châu Á vào thứ Năm. WTI ghi nhận mức tăng khiêm tốn khi tồn kho dầu thô Mỹ bất ngờ giảm vào tuần trước
placeholder
Vàng giảm xuống gần 4.150$ trước thềm công bố dữ liệu lạm phát CPI của MỹGiá vàng (XAU/USD) giảm nhẹ xuống gần 4.155$ trong phiên giao dịch đầu ngày thứ Tư ở châu Á. Kim loại quý này kéo dài đà giảm khi giá dầu tăng làm dấy lên lo ngại về lạm phát và thúc đẩy các ngân hàng trung ương lớn thắt chặt chính sách tiền tệ.
Tác giả  FXStreet
10 tháng 14 ngày Thứ Tư
Giá vàng (XAU/USD) giảm nhẹ xuống gần 4.155$ trong phiên giao dịch đầu ngày thứ Tư ở châu Á. Kim loại quý này kéo dài đà giảm khi giá dầu tăng làm dấy lên lo ngại về lạm phát và thúc đẩy các ngân hàng trung ương lớn thắt chặt chính sách tiền tệ.
placeholder
WTI giảm xuống gần 97,50$ khi Mỹ miễn trừ các lệnh trừng phạt dầu mỏ đối với NgaGiá dầu West Texas Intermediate (WTI) giảm sau bảy ngày tăng, giao dịch quanh mức 97,40/thùng trong phiên giao dịch châu Á vào thứ Hai.
Tác giả  FXStreet
8 giờ trước
Giá dầu West Texas Intermediate (WTI) giảm sau bảy ngày tăng, giao dịch quanh mức 97,40/thùng trong phiên giao dịch châu Á vào thứ Hai.
placeholder
Forex hôm nay: Các cặp tiền tệ chính giữ ổn định khi bắt đầu tuần mớiĐây là những gì bạn cần biết vào thứ Hai, ngày 19 tháng 10:
Tác giả  FXStreet
1 giờ trước
Đây là những gì bạn cần biết vào thứ Hai, ngày 19 tháng 10:
goTop
quote