


Crypto Today: Bitcoin and Ethereum consolidate gains as XRP extends breakout
- Bitcoin stabilizes near $86,000, backed by sustained institutional inflows.
- Ethereum retains a broad bullish outlook above $2,700 despite a cooling rally.
- XRP extends its rally and tags highs above $1.60, backed by returning ETF inflows.
Bitcoin (BTC) is moderating on Wednesday, trading near $86,000 as the crypto market broadly consolidates. Ethereum (ETH) mirrors BTC’s stable outlook, holding above $2,700. Ripple (XRP), meanwhile, edges higher for the sixth consecutive day, currently sitting above $1.61 as bulls tighten their grip.
The bullish outlook aligns with positive market sentiment, given the crypto Fear & Greed Index at 71, steady in the Greed territory on Wednesday, down slightly from 78 in the Extreme Greed region the day before. This setup shows that appetite for risk assets remains elevated and demand may reinforce the bullish outlook.
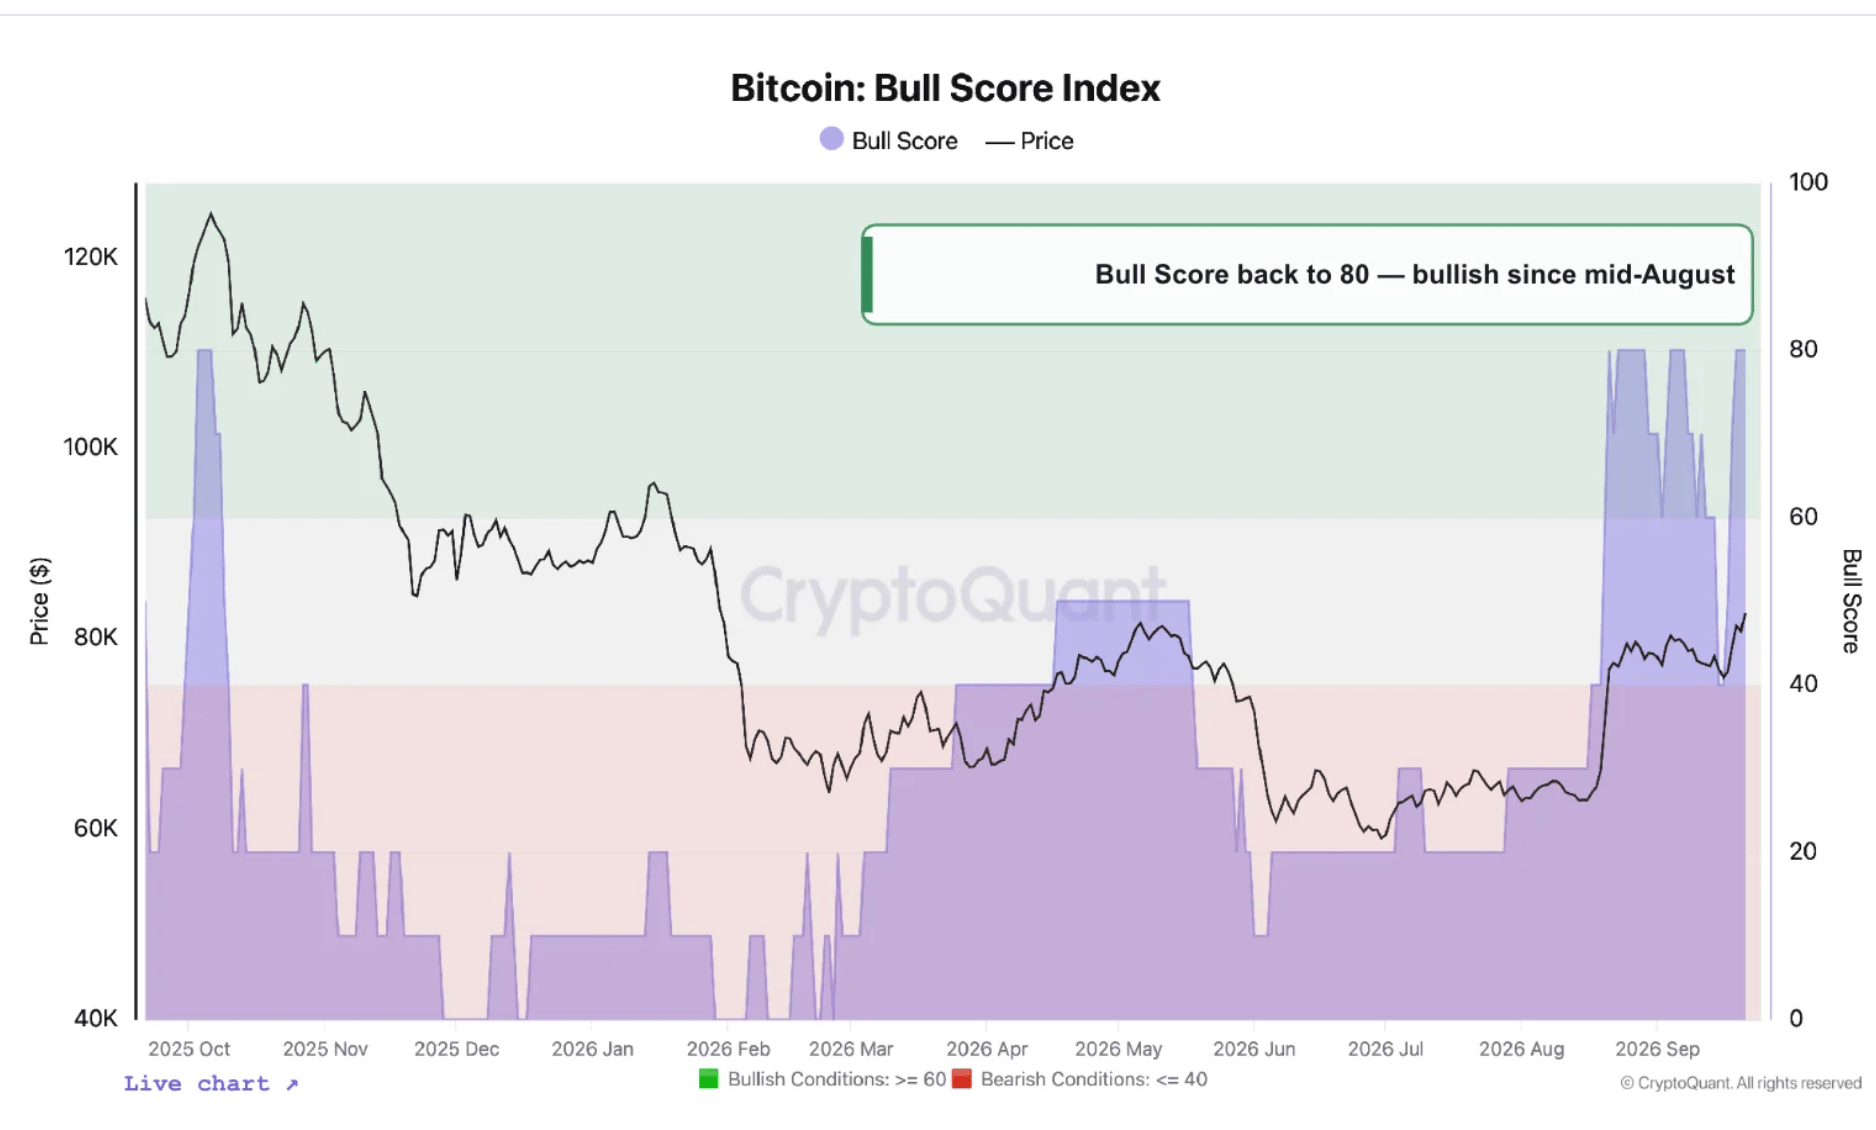
The latest CryptoQuant’s weekly on-chain report states that “CryptoQuant's Bull Score has been in bullish territory since mid-August and now sits at 80. It flagged the shift weeks before the 365-day Moving Average (MA) crossover confirmed it, underscoring how on-chain valuation often leads price at cycle turns.”
Institutional demand sustains bullish outlook
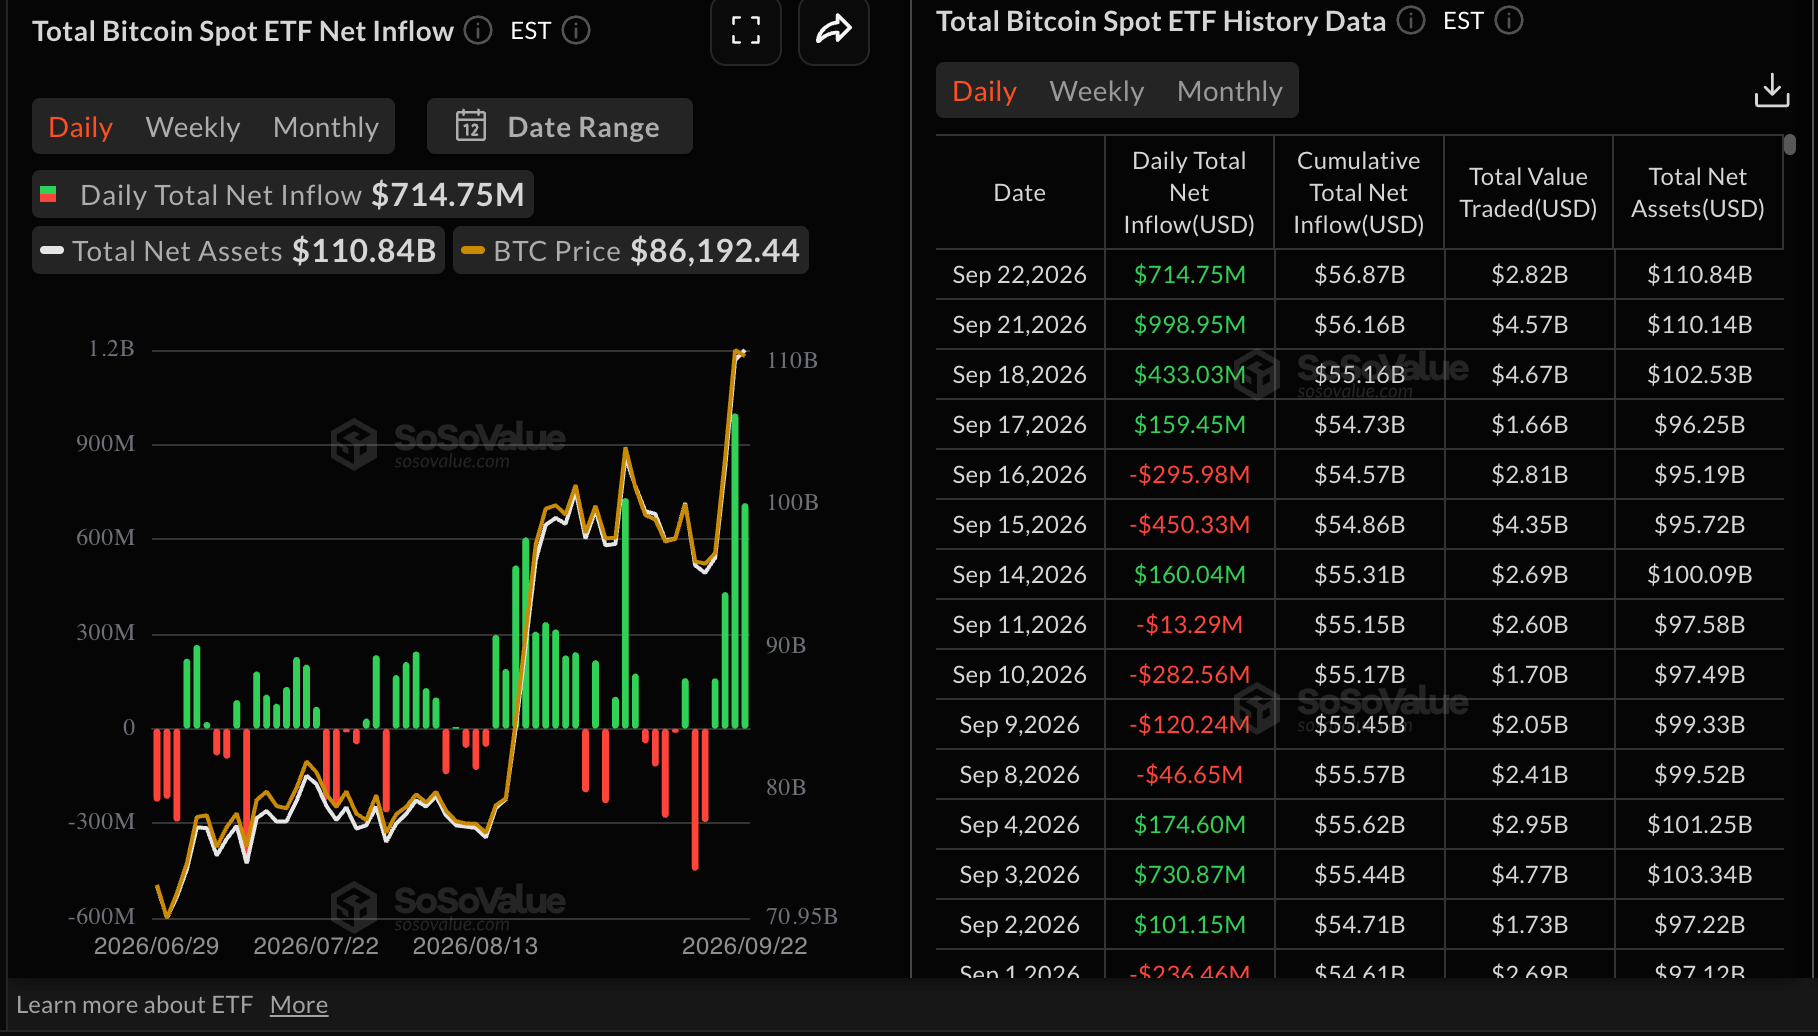
Institutional demand for Bitcoin eased slightly, with inflows into spot Exchange-Traded Funds (ETFs) coming in at $715 million on Tuesday from $999 million on Monday. Cumulative inflows hold near $57 billion, with total net assets under management averaging $111 billion, per SoSoValue data.
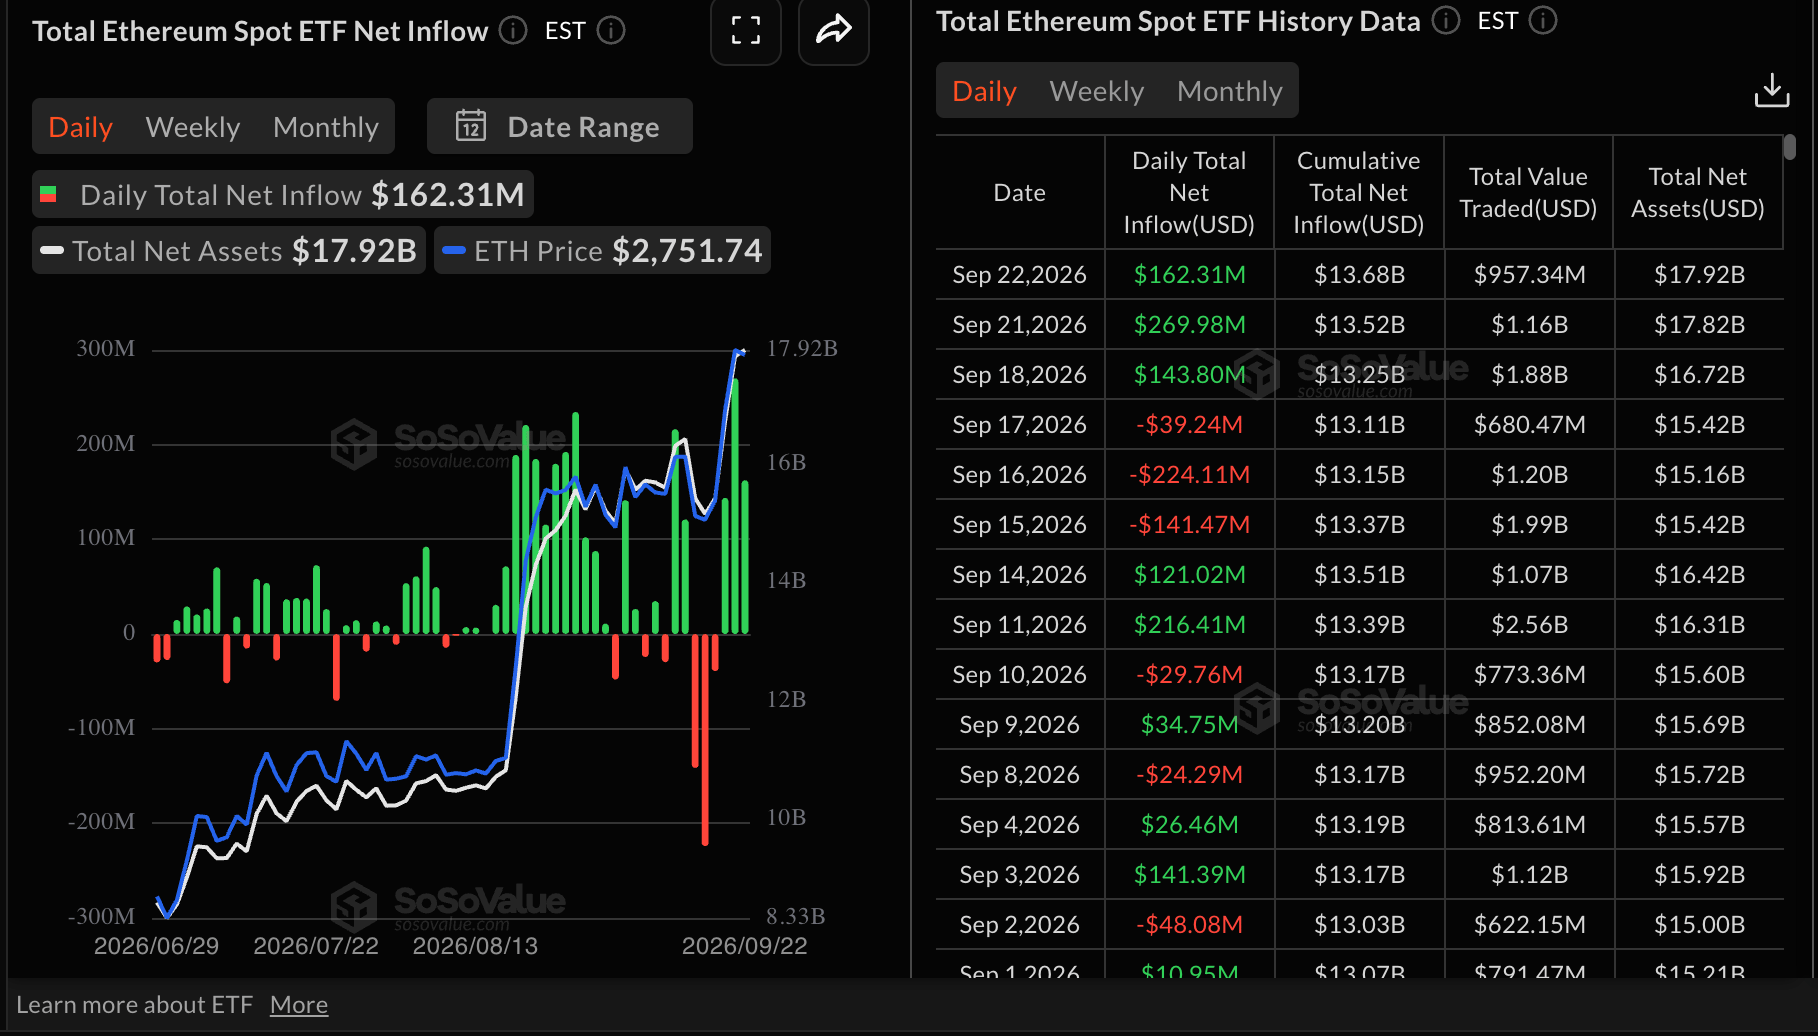
Ethereum spot ETFs drew $162 million in inflows on Tuesday, down from roughly $270 million the previous day. According to SoSoValue, cumulative inflows are approaching $14 billion, with net assets under management standing near $18 billion.
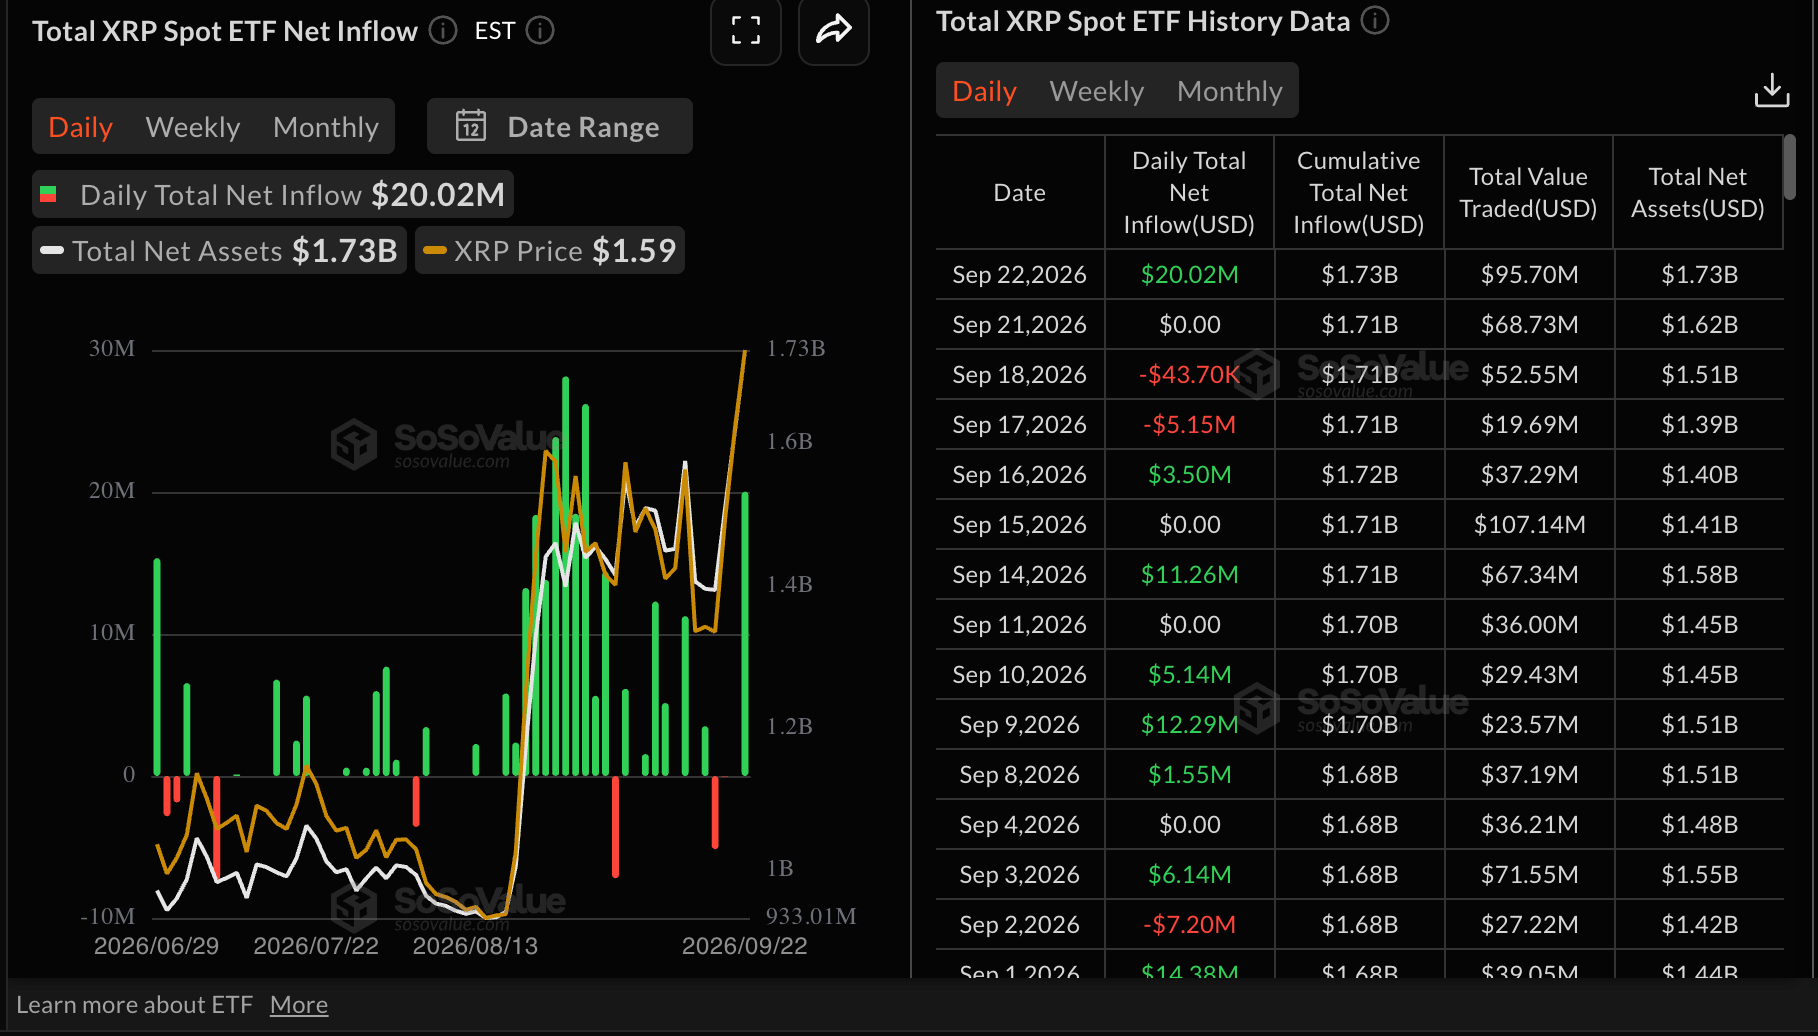
The remittance token, XRP, posted a notable jump in spot ETF inflows to $20 million on Tuesday, following muted activity the day before and $44,000 in outflows last Friday. Cumulative inflows edged higher to $1.73 billion, with net assets averaging $1.73 billion.
Technical analysis: Bitcoin uptrend slows but holds bullish outlook
Bitcoin trades near $86,000, keeping a firm bullish bias as price holds well above the short, medium and long-term Exponential Moving Averages (EMAs) clustered between roughly $72,900 and $75,900. The pair is also trading decisively above the reclaimed downtrend resistance break zone near $80,805 and the latest SuperTrend support at $79,448, suggesting buyers still control the move.
The Relative Strength Index (RSI) hovering in the low-70s points to strong but overbought momentum, while the Moving Average Convergence Divergence (MACD) remains in positive territory with a constructive profile, suggesting upside pressure remains dominant despite the risk of corrective pauses.
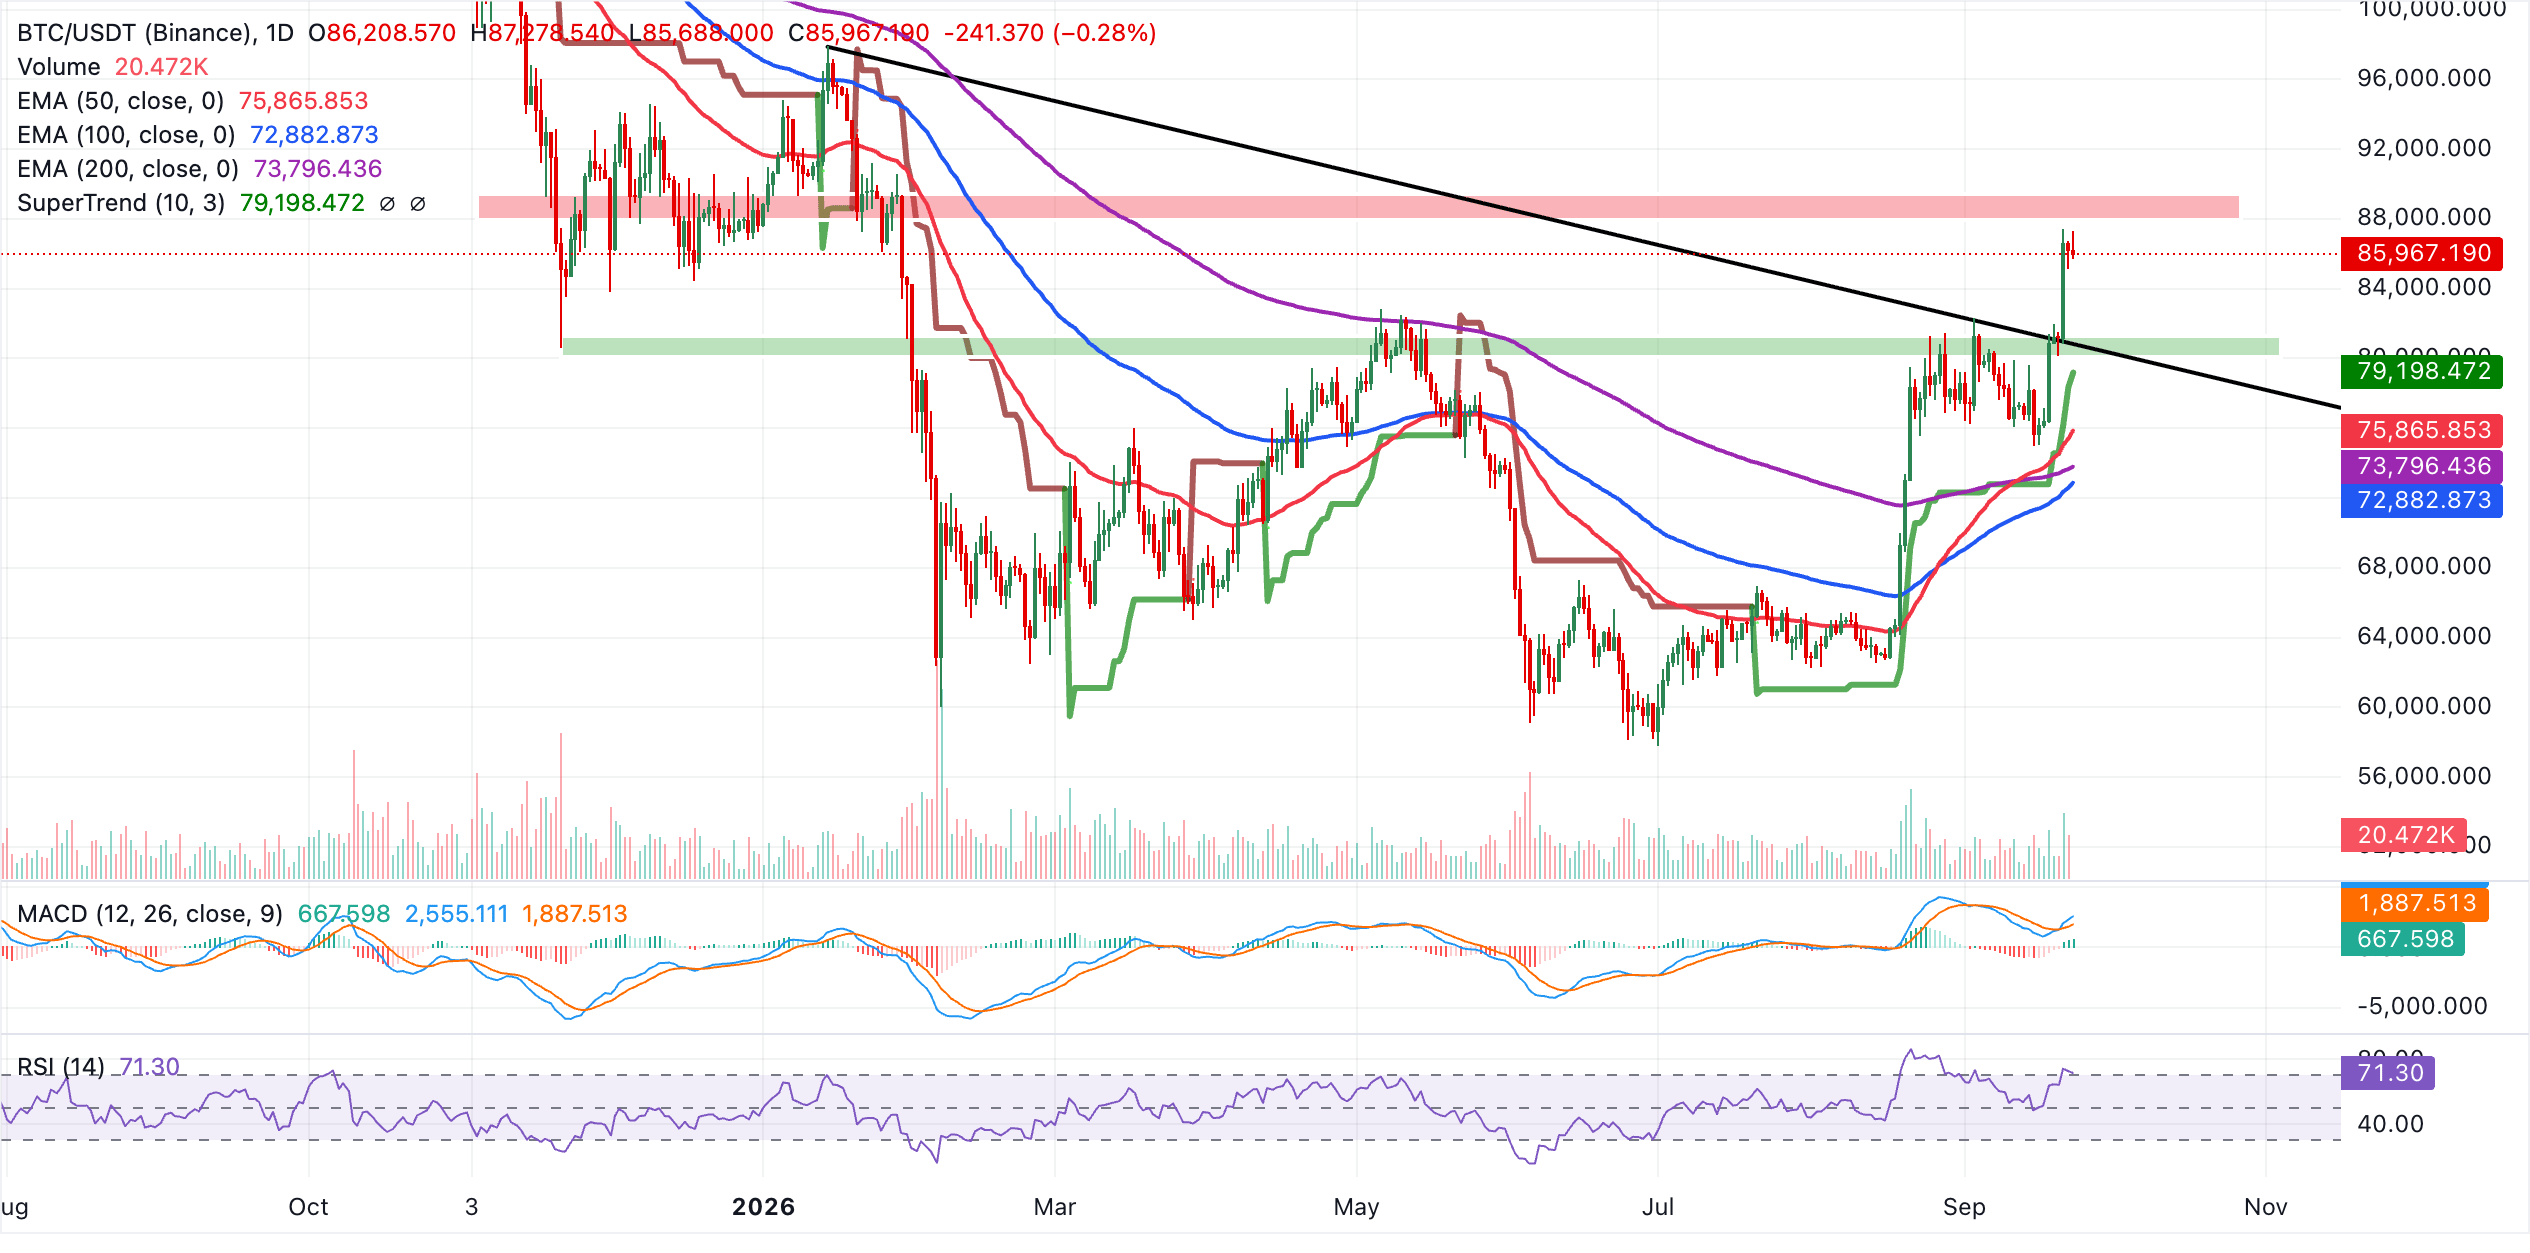
On the downside, initial support emerges at the former trendline resistance-turned-floor around $80,805, followed by the SuperTrend level at $79,448, which together define the first demand band on pullbacks. Deeper losses would expose the 50-day EMA near $75,875, ahead of the 200-day EMA at $73,803 and the 100-day EMA at $72,888, where a broader bullish structure would likely be tested. As long as BTC stays above this moving-average base, dips are likely to be viewed as corrective within the prevailing uptrend.
"The next resistance sits at $88,000-$90,000, lining up with the upper band of the trader-realized price. Support is well-defined below, at the 200-day MA around $70,600," CryptoQuant added in the report.
Altcoins technical outlook: Ethereum uptrend takes a breather as XRP gains momentum
XRP holds well above the short- and long-term EMAs, with the 50-day EMA near $2,371 and the 100-day and 200-day EMAs clustered around $2,223-$2,240, reinforcing a constructive near-term bias. Price also sits comfortably over the latest SuperTrend support at about 2,465, while the RSI around 69 stays just shy of overbought, suggesting strong yet not extreme bullish momentum. The MACD histogram remains positive, hinting that upside pressure is still in play, albeit after an already extended run.
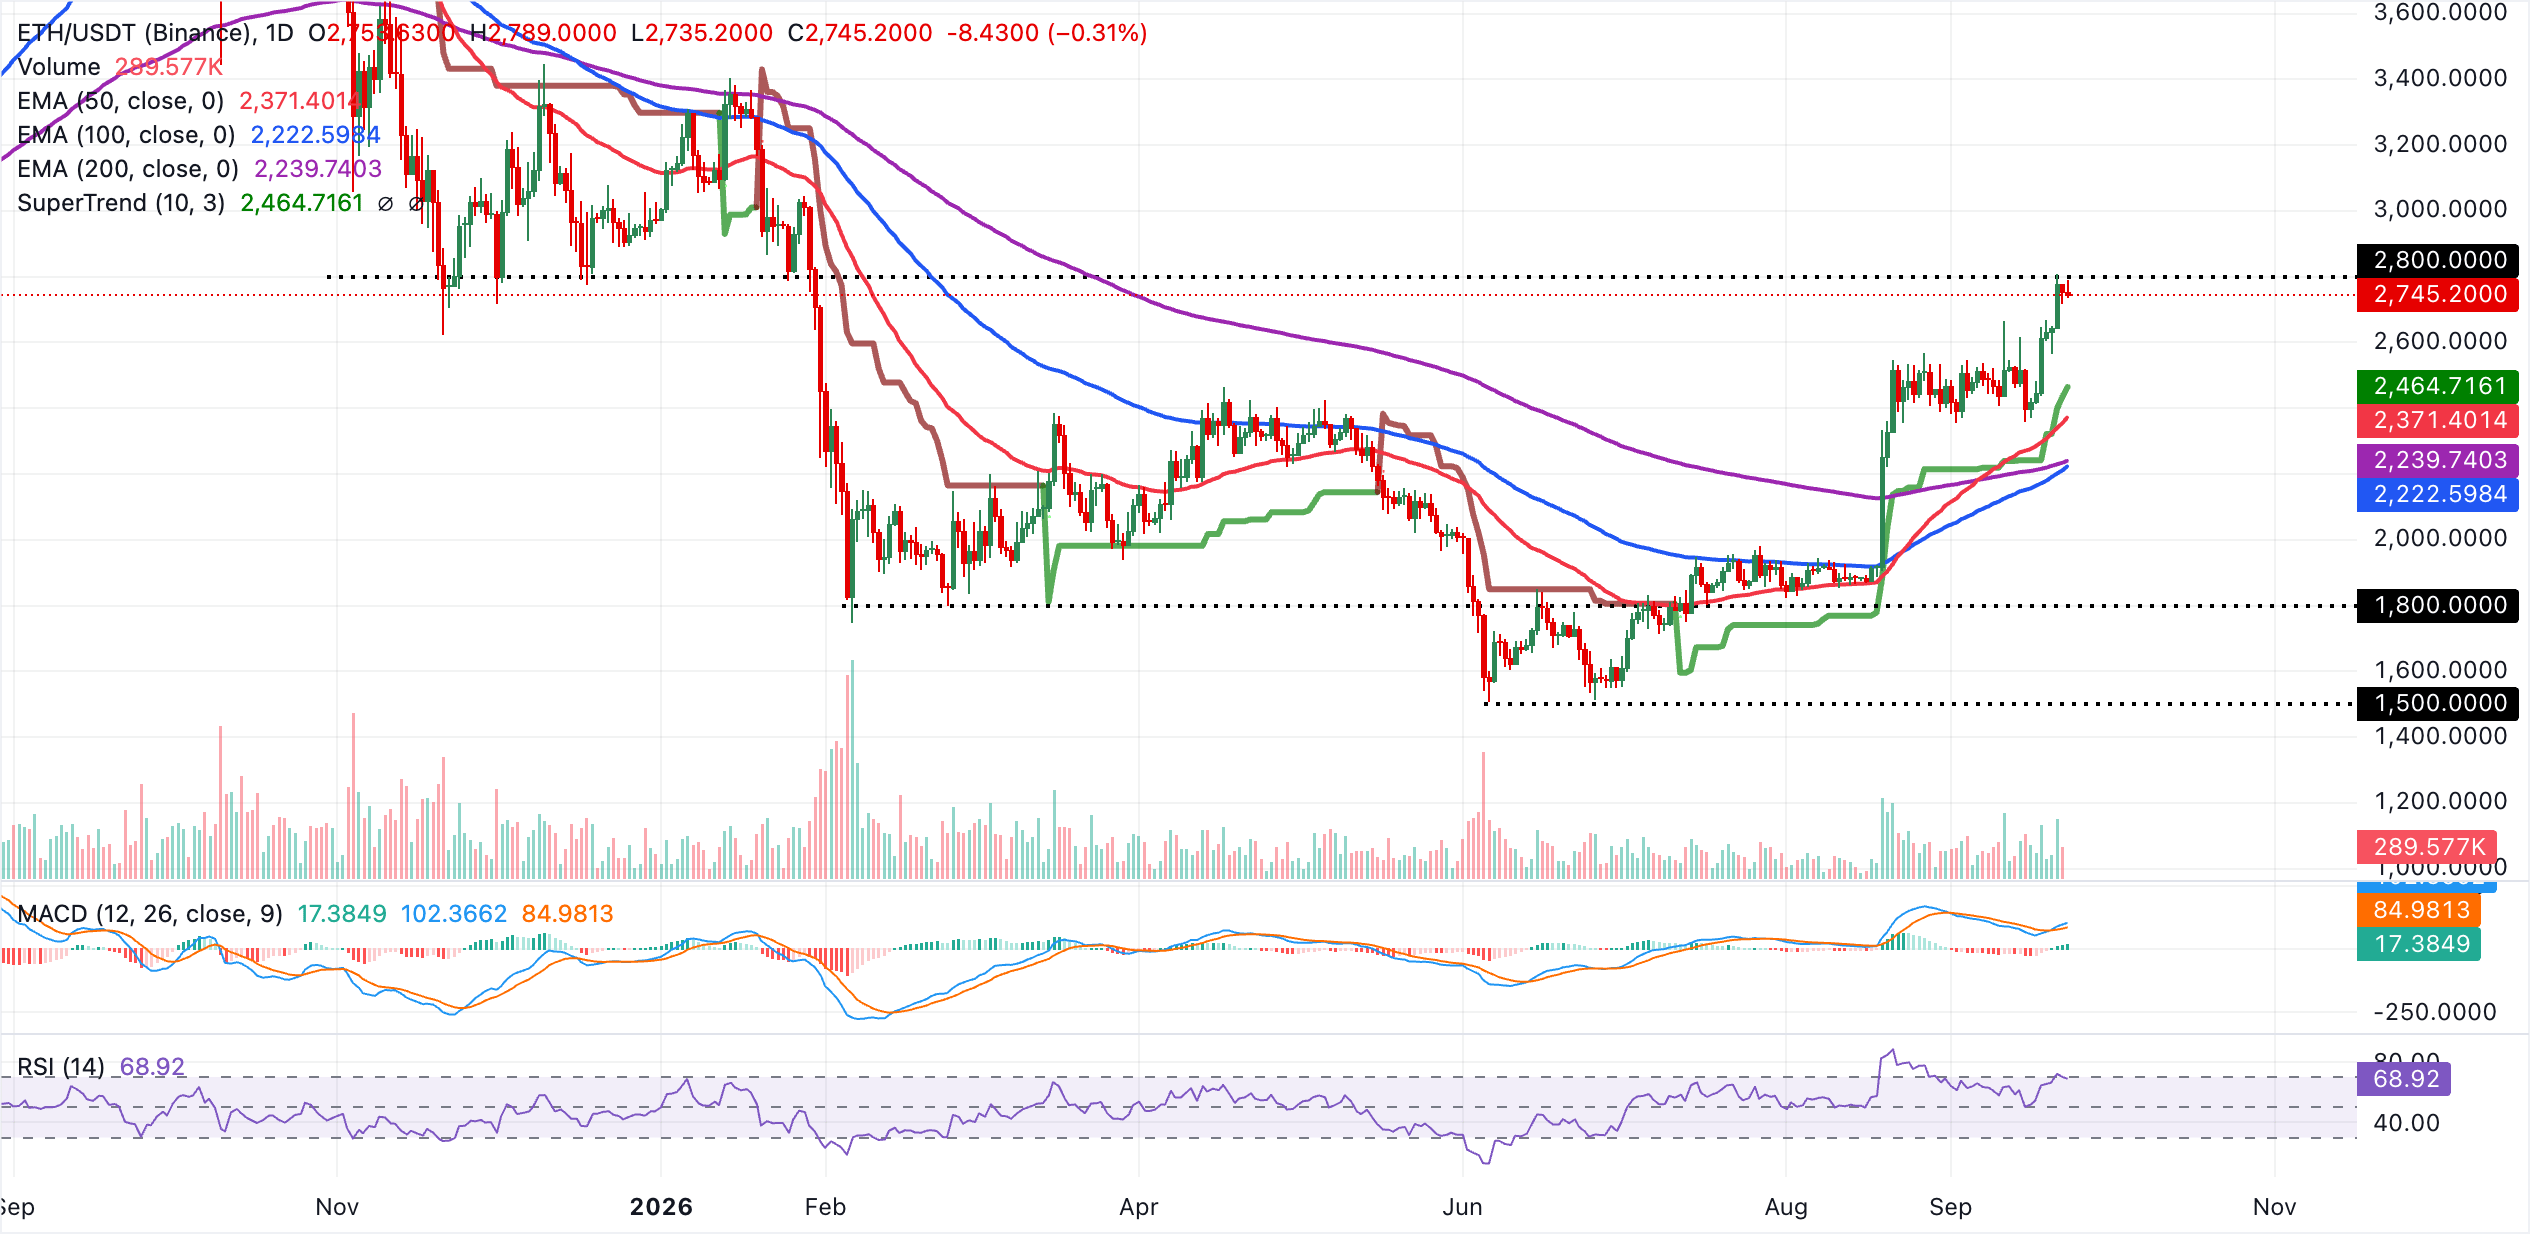
Initial support lies at the SuperTrend level around $2,465, where a pullback could find buyers on first test. Below that, the 50-day EMA near $2,371 forms the next key floor, ahead of a deeper cushion from the 200-day EMA around $2,240 and the 100-day EMA near $2,223. As long as ETH defends these supports on closing bases, the broader uptrend is likely to hold, with any consolidation viewed as corrective within the prevailing bullish structure.
XRP, meanwhile, trades at $1.61, extending its advance well above the key EMAs. The 200-day EMA at $1.36, together with the 50-day and 100-day EMAs clustered between roughly $1.33 and $1.28, now underpin a clear bullish near-term bias as price holds decisively over these structural lines.
Momentum is supportive, with the MACD above zero and its latest reading strengthening, while the RSI at 69 hovers just below overbought territory, hinting at robust but possibly stretched buying pressure.
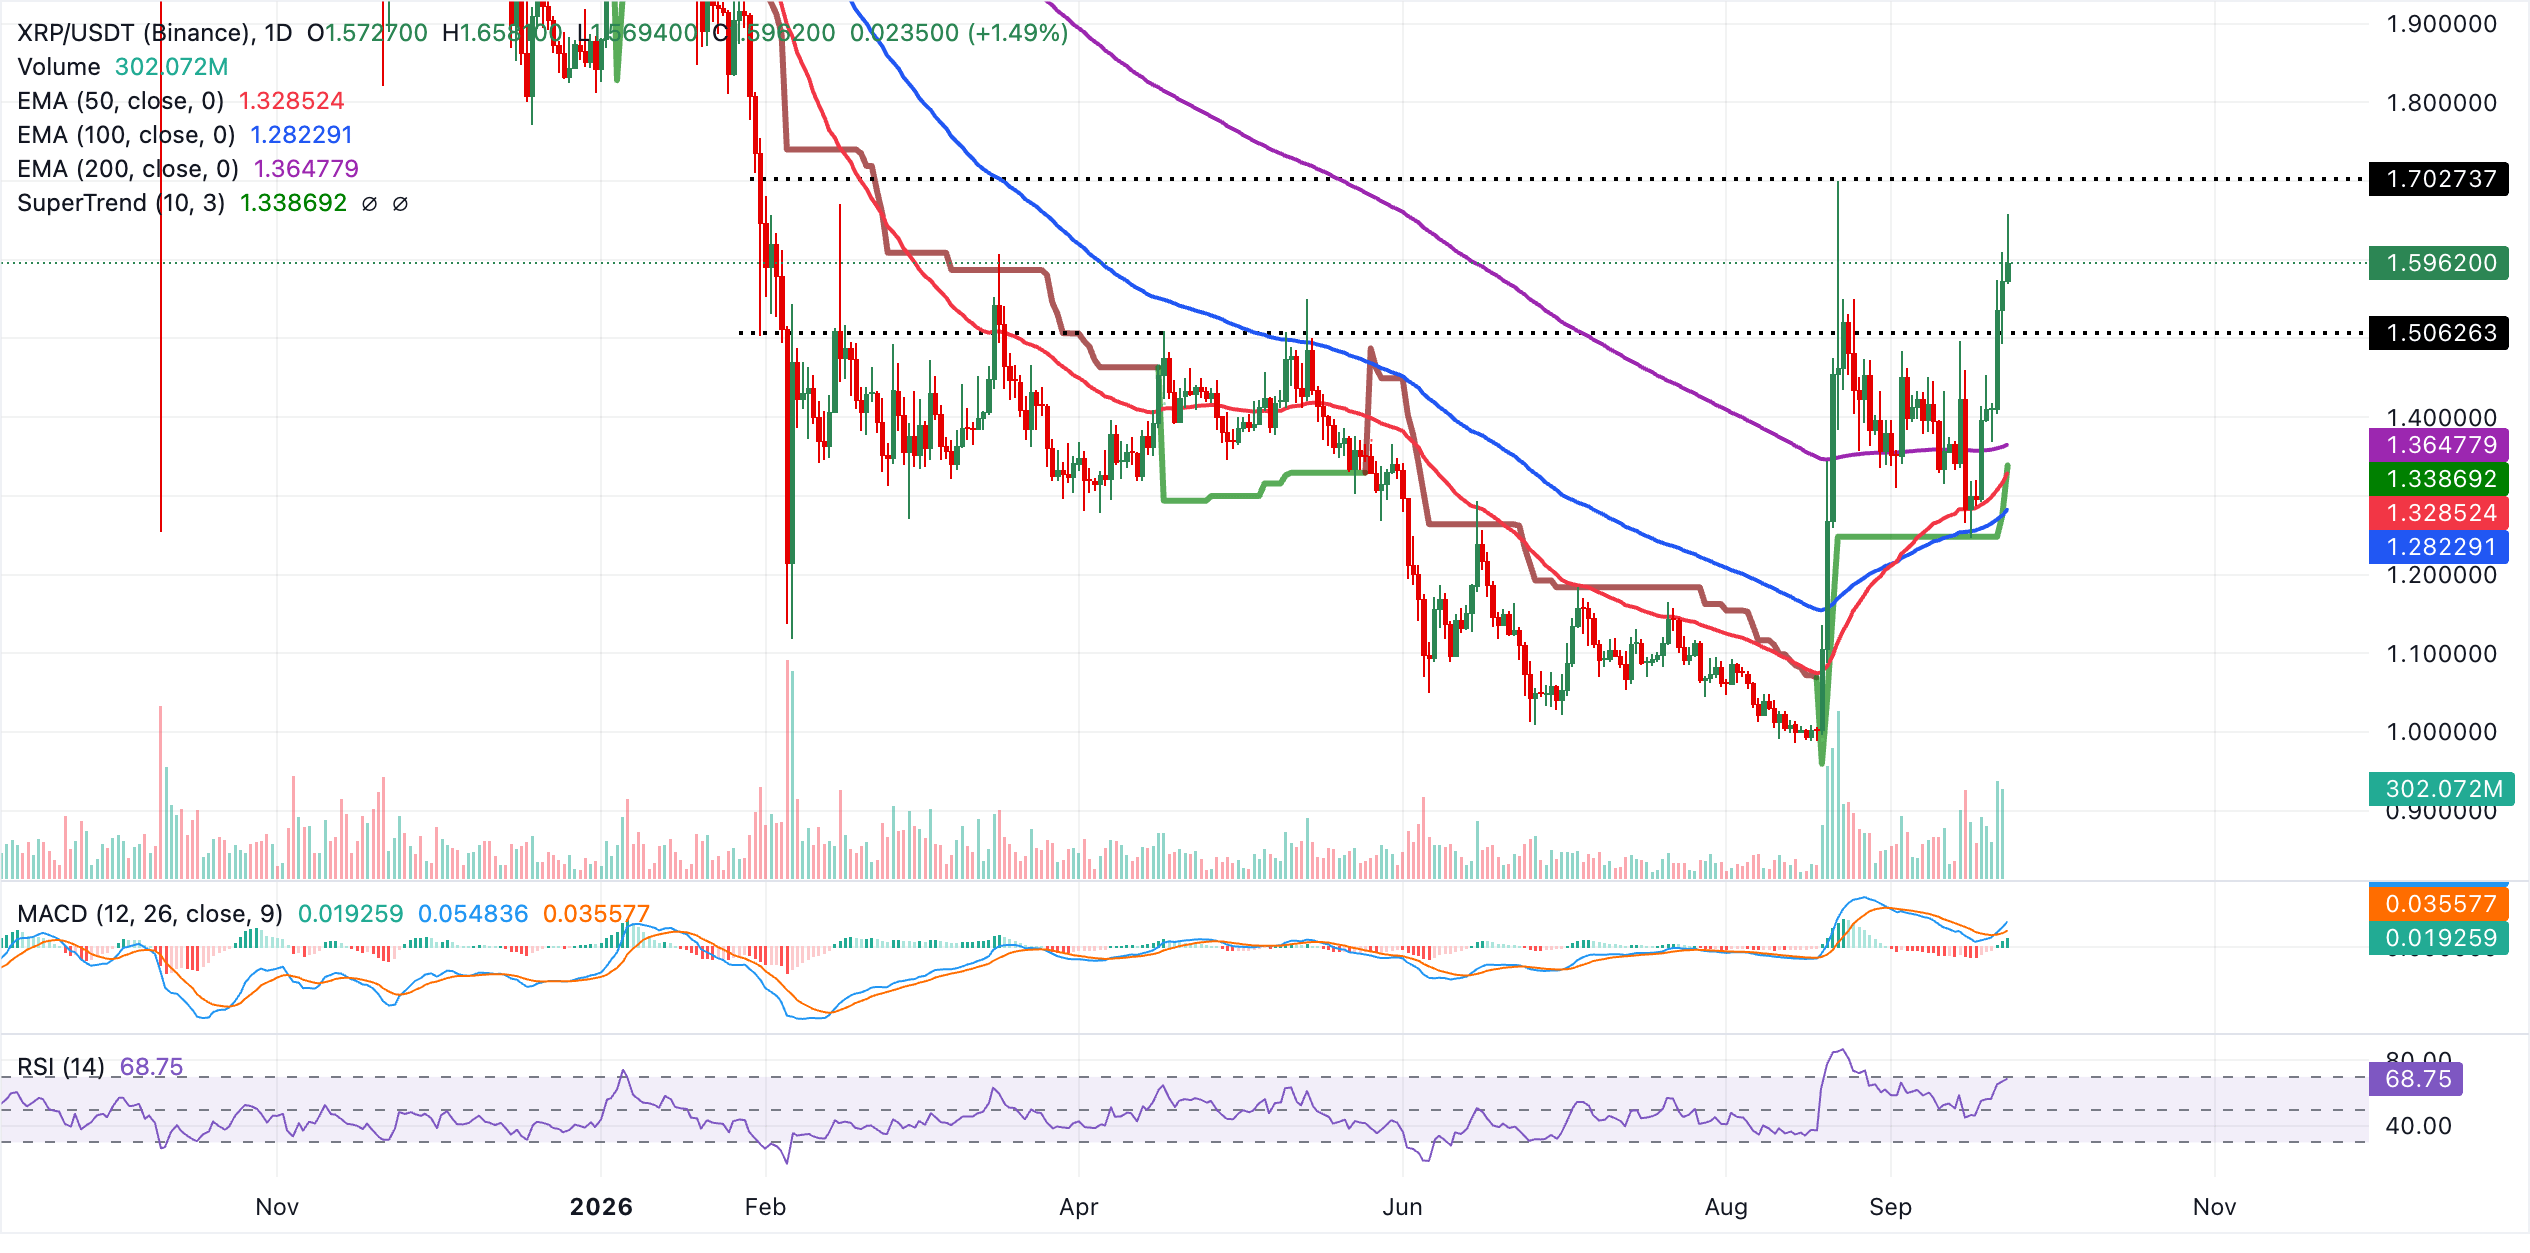
Initial technical support lies at the 200-day EMA around $1.36, followed by a broader demand zone defined by the SuperTrend baseline at $1.34 and the 50-day EMA at $1.33. A deeper pullback would expose the 100-day EMA at $1.28 as the next notable floor. With no nearby overhead levels on the daily chart, the pair would likely remain constructive as long as it stays above the $1.36-$1.33 support cluster, though the elevated RSI suggests that fresh gains could be preceded by a consolidation phase.
(The technical analysis of this story was written with the help of an AI tool. Know more.)
Crypto ETF FAQs
An Exchange-Traded Fund (ETF) is an investment vehicle or an index that tracks the price of an underlying asset. ETFs can not only track a single asset, but a group of assets and sectors. For example, a Bitcoin ETF tracks Bitcoin’s price. ETF is a tool used by investors to gain exposure to a certain asset.
Yes. The first Bitcoin futures ETF in the US was approved by the US Securities & Exchange Commission in October 2021. A total of seven Bitcoin futures ETFs have been approved, with more than 20 still waiting for the regulator’s permission. The SEC says that the cryptocurrency industry is new and subject to manipulation, which is why it has been delaying crypto-related futures ETFs for the last few years.
Yes. The SEC approved in January 2024 the listing and trading of several Bitcoin spot Exchange-Traded Funds, opening the door to institutional capital and mainstream investors to trade the main crypto currency. The decision was hailed by the industry as a game changer.
The main advantage of crypto ETFs is the possibility of gaining exposure to a cryptocurrency without ownership, reducing the risk and cost of holding the asset. Other pros are a lower learning curve and higher security for investors since ETFs take charge of securing the underlying asset holdings. As for the main drawbacks, the main one is that as an investor you can’t have direct ownership of the asset, or, as they say in crypto, “not your keys, not your coins.” Other disadvantages are higher costs associated with holding crypto since ETFs charge fees for active management. Finally, even though investing in ETFs reduces the risk of holding an asset, price swings in the underlying cryptocurrency are likely to be reflected in the investment vehicle too.
Bài viết đề xuất


