


Ripple and Stellar outlook: XRP and XLM await direction amid cautious sentiment
- XRP hovers below the 50-day EMA at $1.145 on Thursday, a breakout suggests a bullish move ahead.
- XLM hovers near the $0.187 support zone, consolidating ahead of its next directional move.
- Mixed signals, with a slight bearish tilt in derivative metrics, suggest traders remain cautious despite resilient price action.
Ripple (XRP) and Stellar (XLM) trade cautiously on Thursday as both tokens hover around key technical levels. XRP is testing resistance at its 50-day Exponential Moving Average (EMA), while XLM continues to consolidate around the $0.187 support zone. Meanwhile, mixed derivatives data with a slight bearish tilt suggests traders remain cautious, keeping the next directional move uncertain.
Derivatives data shows cautious signs
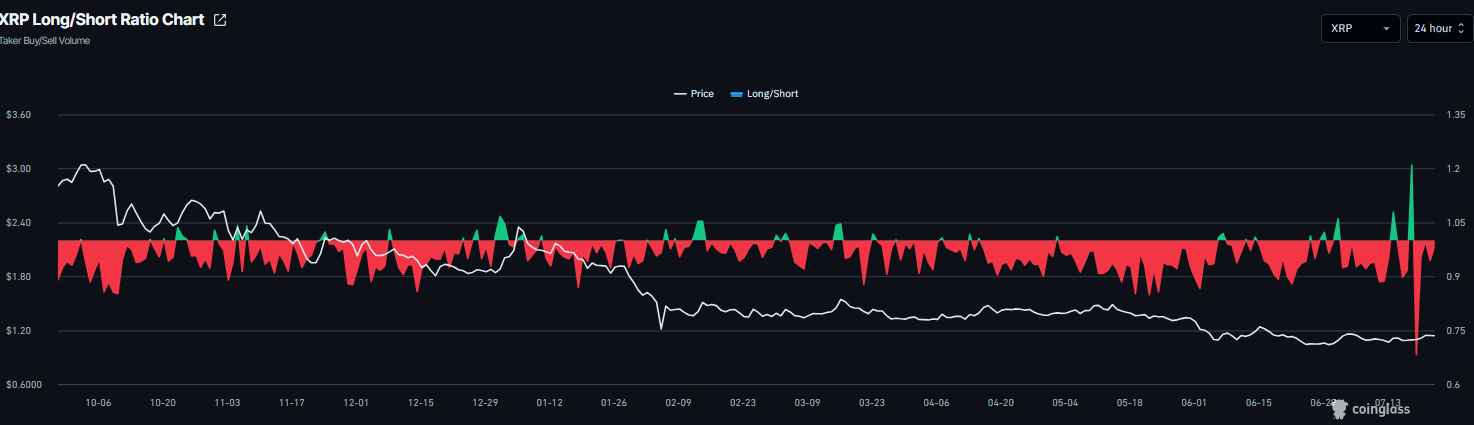
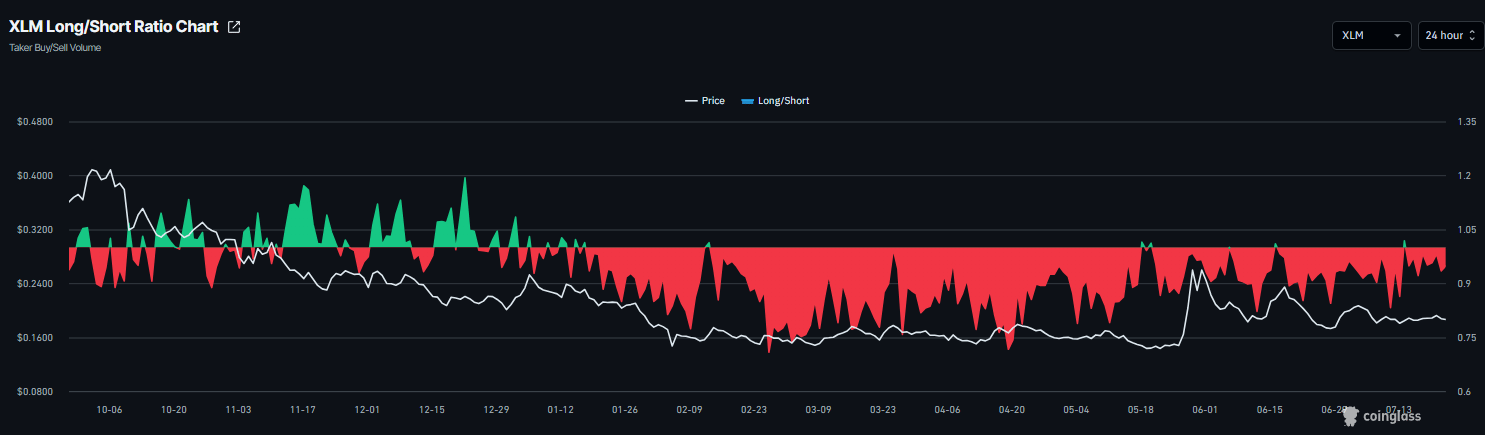
Derivatives data shows mixed sentiment with a slight bearish tilt. CoinGlass’ long-to-short ratio for both XRP and XLM read 0.94 and 0.93, respectively, on Thursday, nearing their lowest levels in over a month. The ratio being below one, indicates bearish sentiment, as traders are betting the assets' prices will fall.
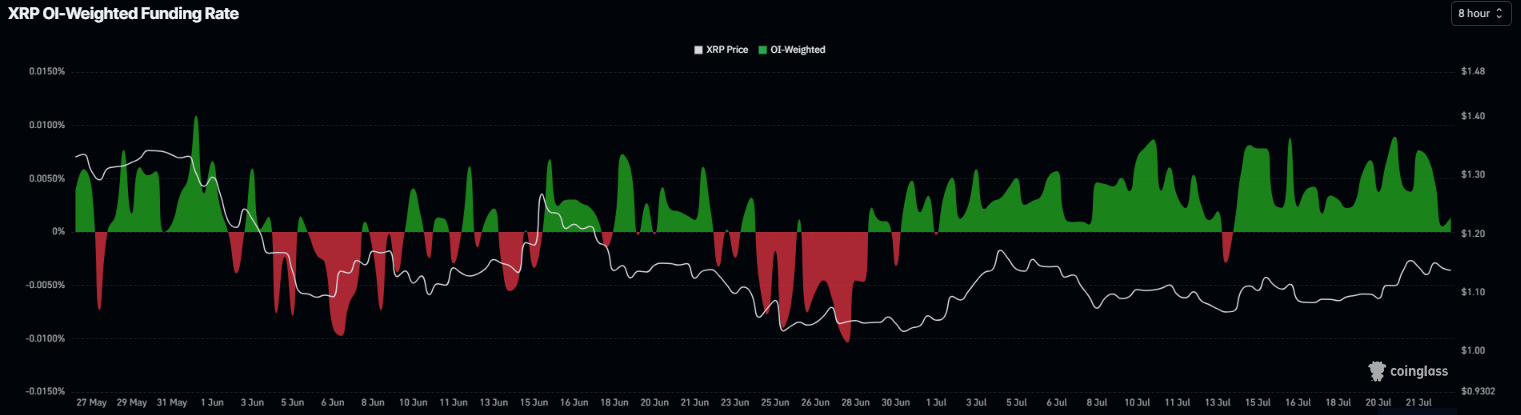
Meanwhile, the funding rates show a mixed bias. XRP funding rates flipped positive on July 14 and have remained in bullish territory, with a reading of 0.0014% on Thursday, indicating that longs are paying shorts and signaling bullish sentiment.
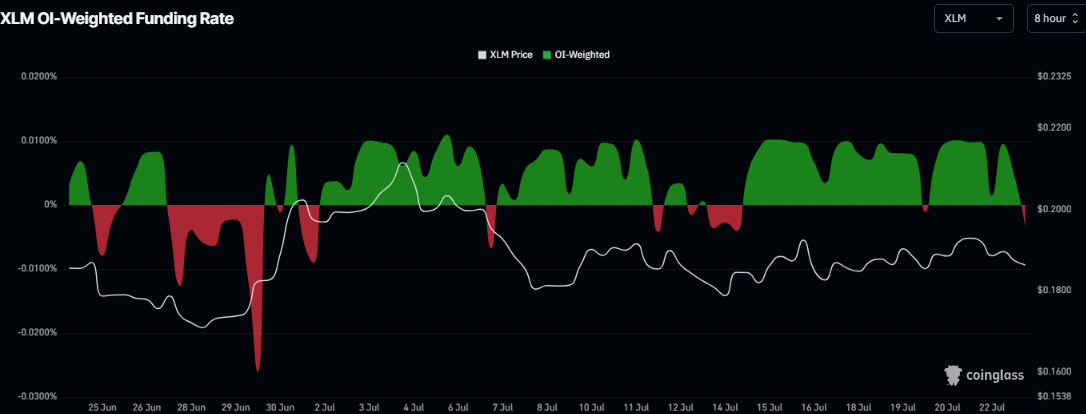
Meanwhile, XLM funding rates flipped negative on Thursday, reading -0.0035%, indicating that shorts are paying longs and signaling bearish sentiment.
XRP technical outlook: Close above 50-day could suggest a rally
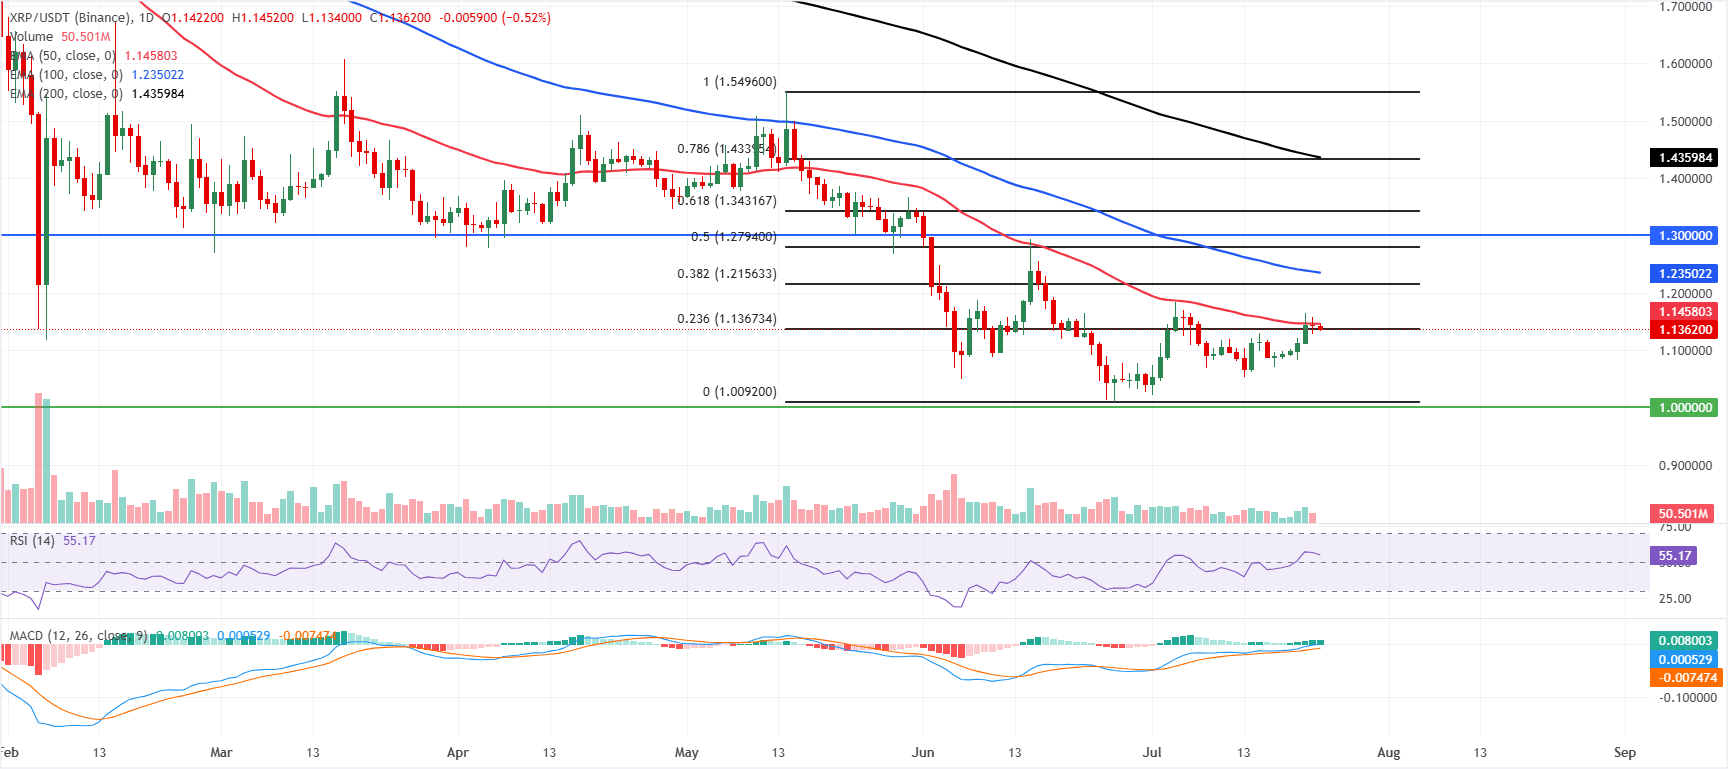
XRP trades at $1.136 on Thursday, maintaining a bearish bias as price remains below the short- and medium-term Exponential Moving Averages. The 50-day EMA at $1.145 is the first cap just overhead, with the 100-day EMA at $1.235 further up, underscoring a market that remains pressured despite the recent bounce toward the 23.6% Fibonacci retracement at $1.136, which now acts as a pivotal level.
Momentum is more constructive, with the Relative Strength Index (14) hovering near 55 and the Moving Average Convergence Divergence (MACD) line above zero, along with a positive, slightly expanding histogram, hinting at improving bullish attempts that remain constrained by overhead structure.
On the topside, immediate resistance is located at the 50-day EMA at $1.145, followed by a broader cluster formed by the 38.2% Fibonacci retracement at $1.215 and the 100-day EMA at $1.235.
On the downside, the 23.6% retracement at $1.136 serves as the immediate pivot; a sustained break lower would expose support at the Fibonacci anchor near $1.009, closely aligned with the horizontal floor at $1.000, where buyers would be expected to defend the broader uptrend base.
XLM technical outlook: Hovers around the key supports
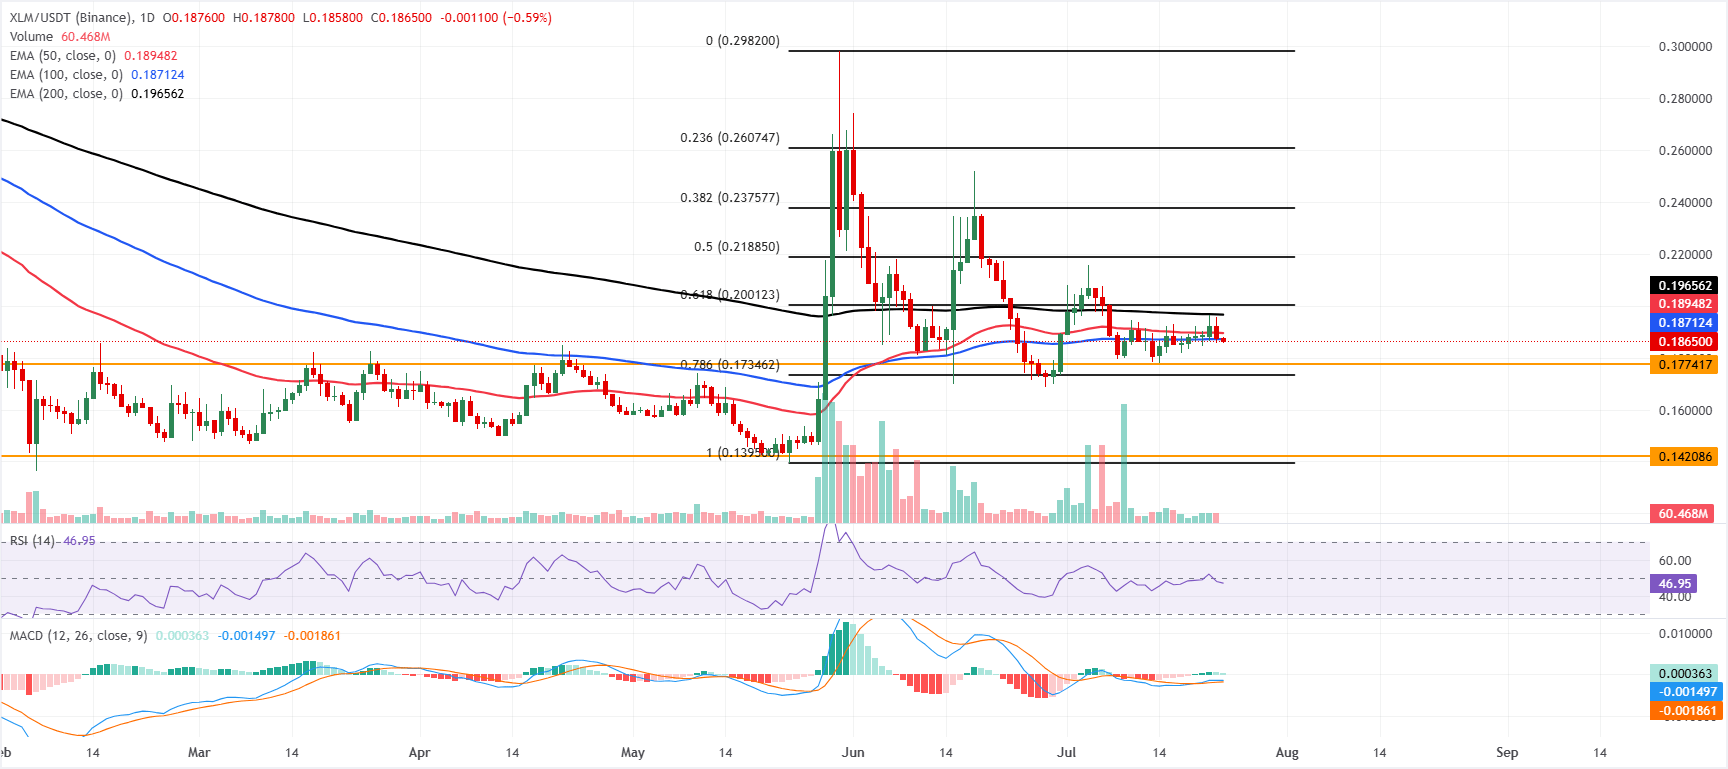
XLM price trades at $0.186 on Thursday, maintaining a mildly bearish tone as price holds beneath the 50-day, 100-day and 200-day EMAs at $0.189, $0.187 and $0.196 respectively. This layered EMA stack above spot hints that recent bounces remain corrective within a broader capped structure, even as the RSI at 46 stays in neutral territory and the MACD fluctuates just above zero with a modest positive reading, suggesting only tentative bullish momentum.
On the topside, initial resistance appears at the 100-day EMA near $0.187, followed by the 50-day EMA at $0.189 and the 200-day EMA at $0.196, ahead of the 61.8% Fibonacci retracement at $0.200; higher up, subsequent barriers are located at the 50% retracement at $0.218.
On the downside, immediate support is seen at the horizontal level around $0.177, reinforced by the 78.6% Fibonacci retracement at $0.173, with a deeper floor emerging at the prior horizontal base near $0.142.
(The technical analysis of this story was written with the help of an AI tool. Know more.)
Bài viết đề xuất


