

Pi Network: Steady decline risks a record low despite easing market drag

Nguồn Fxstreet
  • Pi Network extends losses on Monday for the third consecutive day, risking a steeper correction to a new record low. 
  • The long-to-short ratio plunges below 1, suggesting risk-off sentiment among traders.
  • The technical outlook for PI is bearish, with selling momentum building despite easing downside pressure in the broader crypto market.

Pi Network (PI) price edges below $0.1150 on Monday, extending its losses for the third straight day. Data shows an intense bearish bias among traders holding short-sided positions, reflecting weak retail support despite easing downside pressure across the crypto market. The technical outlook for PI is bearish, with selling pressure building despite indicators flashing oversold conditions.

Bearish bias persists in PI

Pi Network struggles to regain retail confidence despite easing of broader market risk-off sentiment. Bitcoin (BTC) shows a recovery to $63,000 on Monday, up from sub-$60,000 levels last week, while the Fear and Greed Index is at 29, up from Extreme Fear levels of 17 during the same period. Taken together, the data reaffirms a broader market recovery.
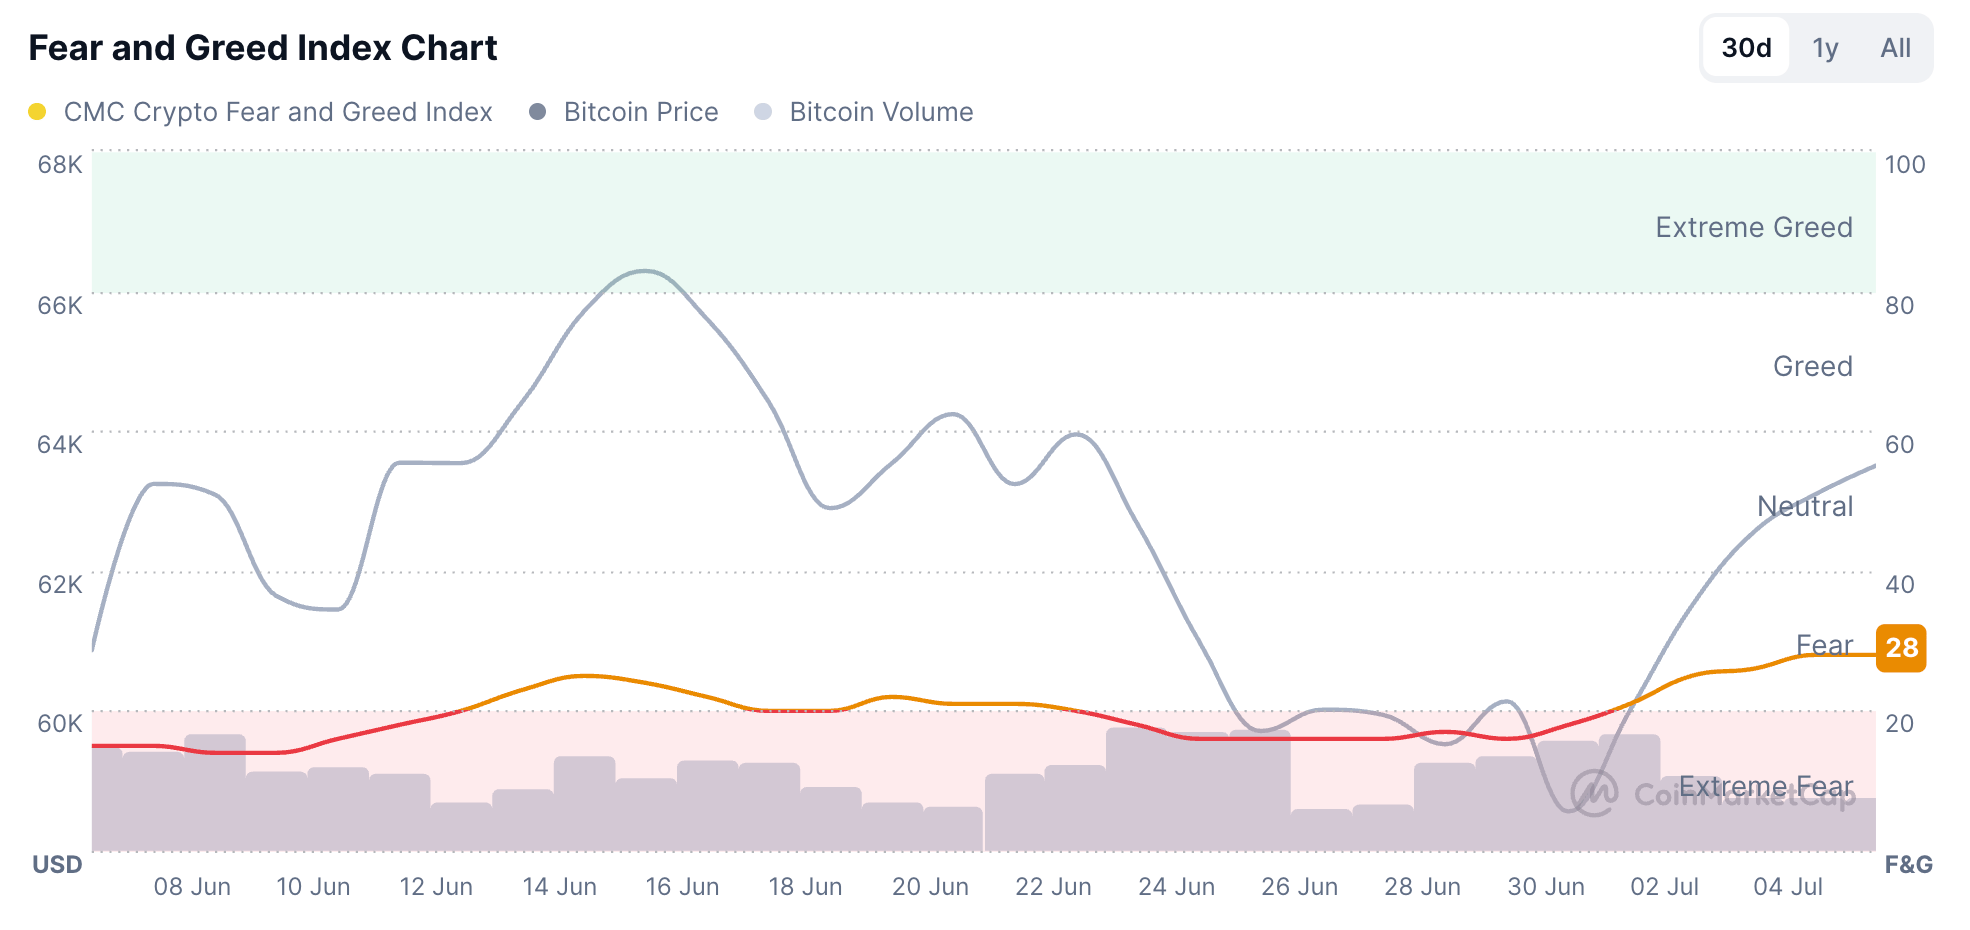
Fear and Greed Index. Source: CoinMarketCap

On the retail front, CoinAnk data shows the long-to-short ratio has dropped to 0.66 on Monday, reflecting clear sell-side dominance in positional buildup as traders anticipate further downside.  The lack of an immediate catalyst to boost retail demand supports the bearish bias.
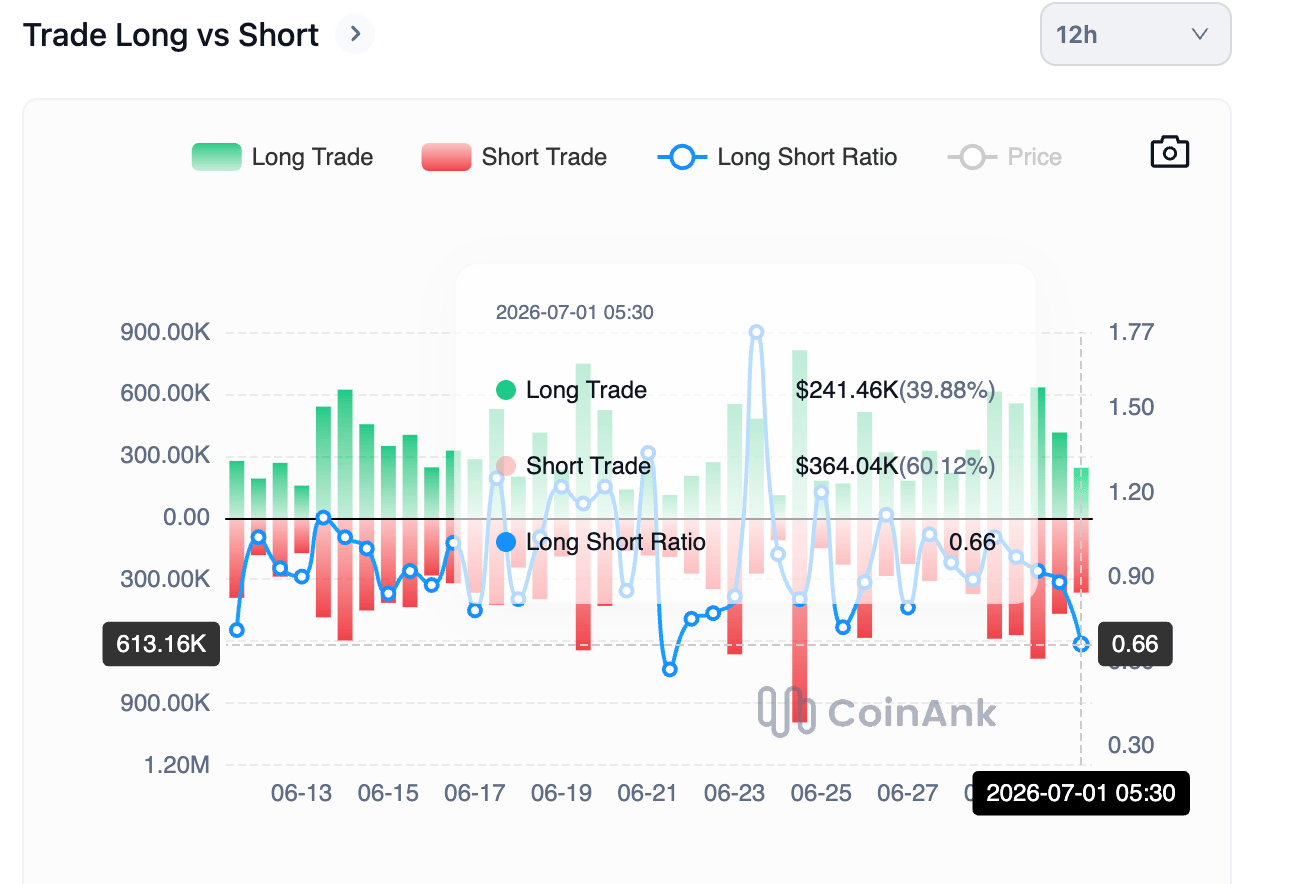
PI token long-to-short ratio chart. Source: CoinAnk


Pi Network risks forming a new lower leg

Pi Network extends losses on Monday, maintaining a steady declining under the influence of an overhead resistance trendline, near $0.1278, which continues to cap the broader structure. The 50-day Exponential Moving Average (EMA) at roughly $0.1345 and the 200-day EMA near $0.1793 hold significantly above the price, clear bearish phase, reaffirming the bearish long-term trend.

Momentum conditions on the daily timeframe are weak, as the Moving Average Convergence Divergence (MACD) continues to descend below its signal line in the negative territory. At the same time, the Relative Strength Index (RSI) around 29 hints at oversold conditions despite growing selling momentum.

Looking down, the record low of $0.1111 acts as the immediate support level, where a slip below could risk testing the S1 Pivot Point at $0.1010.

Chart Analysis PI/USD (baha Crypto)
PI/USD daily price chart.

On the topside, initial resistance is seen around the resistance trendline near $0.1278, where sellers could re-emerge on any corrective bounce.

(The technical analysis of this story was written with the help of an AI tool.)

Tuyên bố miễn trừ trách nhiệm: Chỉ dành cho mục đích thông tin. Hiệu suất trong quá khứ không đảm bảo cho kết quả trong tương lai.
placeholder
Vàng giảm xuống dưới 4.850$ khi Fed giữ lãi suất ổn địnhGiá vàng (XAU/USD) đối mặt với một số áp lực bán gần 4.830$ trong phiên giao dịch đầu ngày thứ Năm ở châu Á
Tác giả  FXStreet
3 tháng 19 ngày Thứ Năm
Giá vàng (XAU/USD) đối mặt với một số áp lực bán gần 4.830$ trong phiên giao dịch đầu ngày thứ Năm ở châu Á
placeholder
Dự báo giá bạc: XAG/USD giảm xuống gần mức 75,00$ khi Fed chuyển sang quan điểm diều hâuGiá bạc (XAG/USD) kéo dài mức lỗ trong ngày thứ ba liên tiếp, giao dịch quanh mức 74,20$/ounce troy trong giờ châu Á vào thứ Hai. Giá bạc giảm do cú sốc năng lượng ở Trung Đông đang đẩy lạm phát chung tăng cao, dẫn đến kỳ vọng lãi suất ngân hàng trung ương sẽ tăng.
Tác giả  FXStreet
5 tháng 18 ngày Thứ Hai
Giá bạc (XAG/USD) kéo dài mức lỗ trong ngày thứ ba liên tiếp, giao dịch quanh mức 74,20$/ounce troy trong giờ châu Á vào thứ Hai. Giá bạc giảm do cú sốc năng lượng ở Trung Đông đang đẩy lạm phát chung tăng cao, dẫn đến kỳ vọng lãi suất ngân hàng trung ương sẽ tăng.
placeholder
WTI tăng lên gần mức 93,00$ khi Iran phóng tên lửa về phía Kuwait, BahrainDầu thô West Texas Intermediate (WTI) tăng giá trong ngày thứ ba liên tiếp, giao dịch quanh mức 92,90$/thùng trong giờ châu Á vào thứ Tư
Tác giả  FXStreet
6 tháng 03 ngày Thứ Tư
Dầu thô West Texas Intermediate (WTI) tăng giá trong ngày thứ ba liên tiếp, giao dịch quanh mức 92,90$/thùng trong giờ châu Á vào thứ Tư
placeholder
Giá Bitcoin tăng vọt gần 64,000 USD khi phe bán khống bị thanh lýBitcoin (BTC) đã tăng vọt lên gần 64,000 USD vào đầu ngày 06/07/2024, chạm mức 63,900 USD trên CoinGecko, tiếp tục đà tăng vào cuối tuần và khiến hàng trăm triệu USD vị thế short bị thanh lý.Diễn biến
Tác giả  BeInCrypto
6 giờ trước
Bitcoin (BTC) đã tăng vọt lên gần 64,000 USD vào đầu ngày 06/07/2024, chạm mức 63,900 USD trên CoinGecko, tiếp tục đà tăng vào cuối tuần và khiến hàng trăm triệu USD vị thế short bị thanh lý.Diễn biến
placeholder
Vàng vật lộn để duy trì trên mức 4.200$; giảm nhẹ từ đỉnh hai tuần giữa lúc USD tăng giáVàng (XAU/USD) gặp khó khăn trong việc tận dụng đà tăng khiêm tốn trong phiên châu Á và giao dịch dưới mức cao nhất trong hai tuần mới, mức ngay trên mốc 4.200$ chạm vào thứ Hai này.
Tác giả  FXStreet
2 giờ trước
Vàng (XAU/USD) gặp khó khăn trong việc tận dụng đà tăng khiêm tốn trong phiên châu Á và giao dịch dưới mức cao nhất trong hai tuần mới, mức ngay trên mốc 4.200$ chạm vào thứ Hai này.
goTop
quote