


Crypto Today: Bitcoin and Ethereum edge higher, XRP pares losses as US and Iran agree to resume talks
- Bitcoin eyes a short-term breakout above $60,000 after the US and Iran halted attacks and committed to resume peace negotiations.
- Ethereum holds between $1,500 support and resistance at $1,600, reflecting growing stability following last week’s sell-off.
- XRP trades within a broader bearish trend defined by weak momentum indicators and declining major moving averages.
Bitcoin (BTC) is showing renewed signs of recovery, approaching the $60,000 mark at the time of writing on Monday. Among altcoins, Ethereum (ETH) is positioned for a potential breakout above $1,600, while Ripple (XRP) continues to face bearish pressure, holding just above the key $1.00 psychological support.
US and Iran halt attacks, agree to renew peace negotiations
The United States (US) and Iran exchanged fire near the Strait of Hormuz over the weekend. Iran’s Islamic Revolutionary Guard Corps (IRGC) reported strikes against US military installations in neighboring countries, such as Kuwait and Bahrain, in response to recent US attacks on Iranian targets.
Iran has doubled down on its demand for a full withdrawal of Israeli Forces from Lebanon as part of the final Memorandum of Understanding (MoU) with the US.
A US official confirmed on Sunday that both the US and Iran have agreed to de-escalate military actions and permit unrestricted movement of vessels through the Strait of Hormuz.
Ongoing technical discussions related to the MoU are expected to continue, with both parties scheduled to meet in Doha on Tuesday for further negotiations, according to Axios.
Sentiment in the broader crypto market has deteriorated further despite easing tensions between the US and Iran.
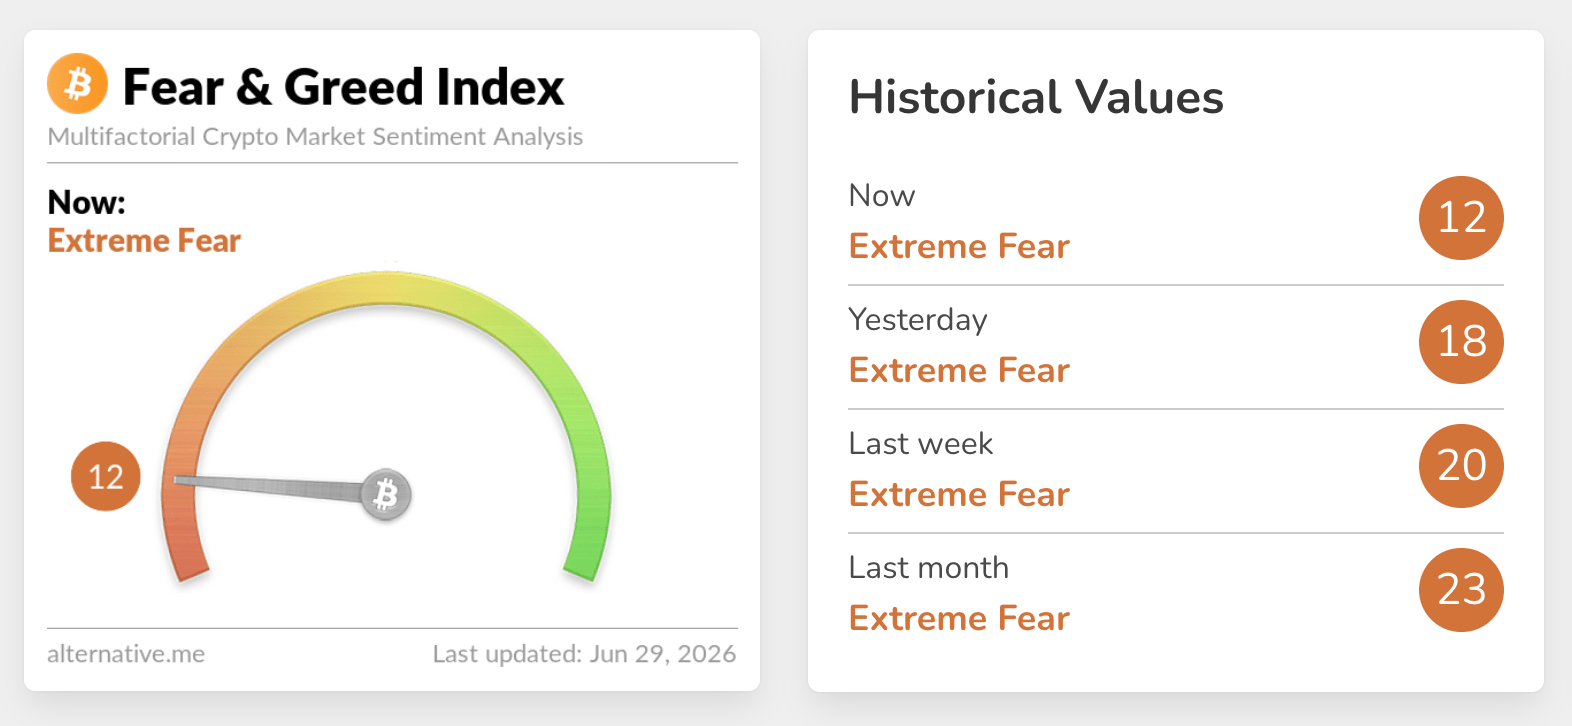
The crypto Fear & Greed Index is stuck in Extreme Fear territory at 12 on Monday, down from 18 the day before. This decline indicates that appetite for risk assets continues to diminish, weighed down by macro and geopolitical uncertainty.
Price analysis: Bitcoin builds momentum
Bitcoin trades at $59,888, rising slightly after last week's persistent sell-off. The Crypto King eyes a short-term breakout above the next hurdle at $60,000.
Meanwhile, the upside remains limited as BTC holds below the Bollinger middle band at $62,838, the 50-day, 100-day and 200-day Exponential Moving Averages (EMAs), which collectively reinforce the downside bias.
The Moving Average Convergence Divergence (MACD) histogram is marginally negative on the daily chart, while the Relative Strength Index (RSI) at 32 hovers just above oversold territory, hinting that bearish momentum is dominant but may be nearing exhaustion rather than showing fresh selling pressure.
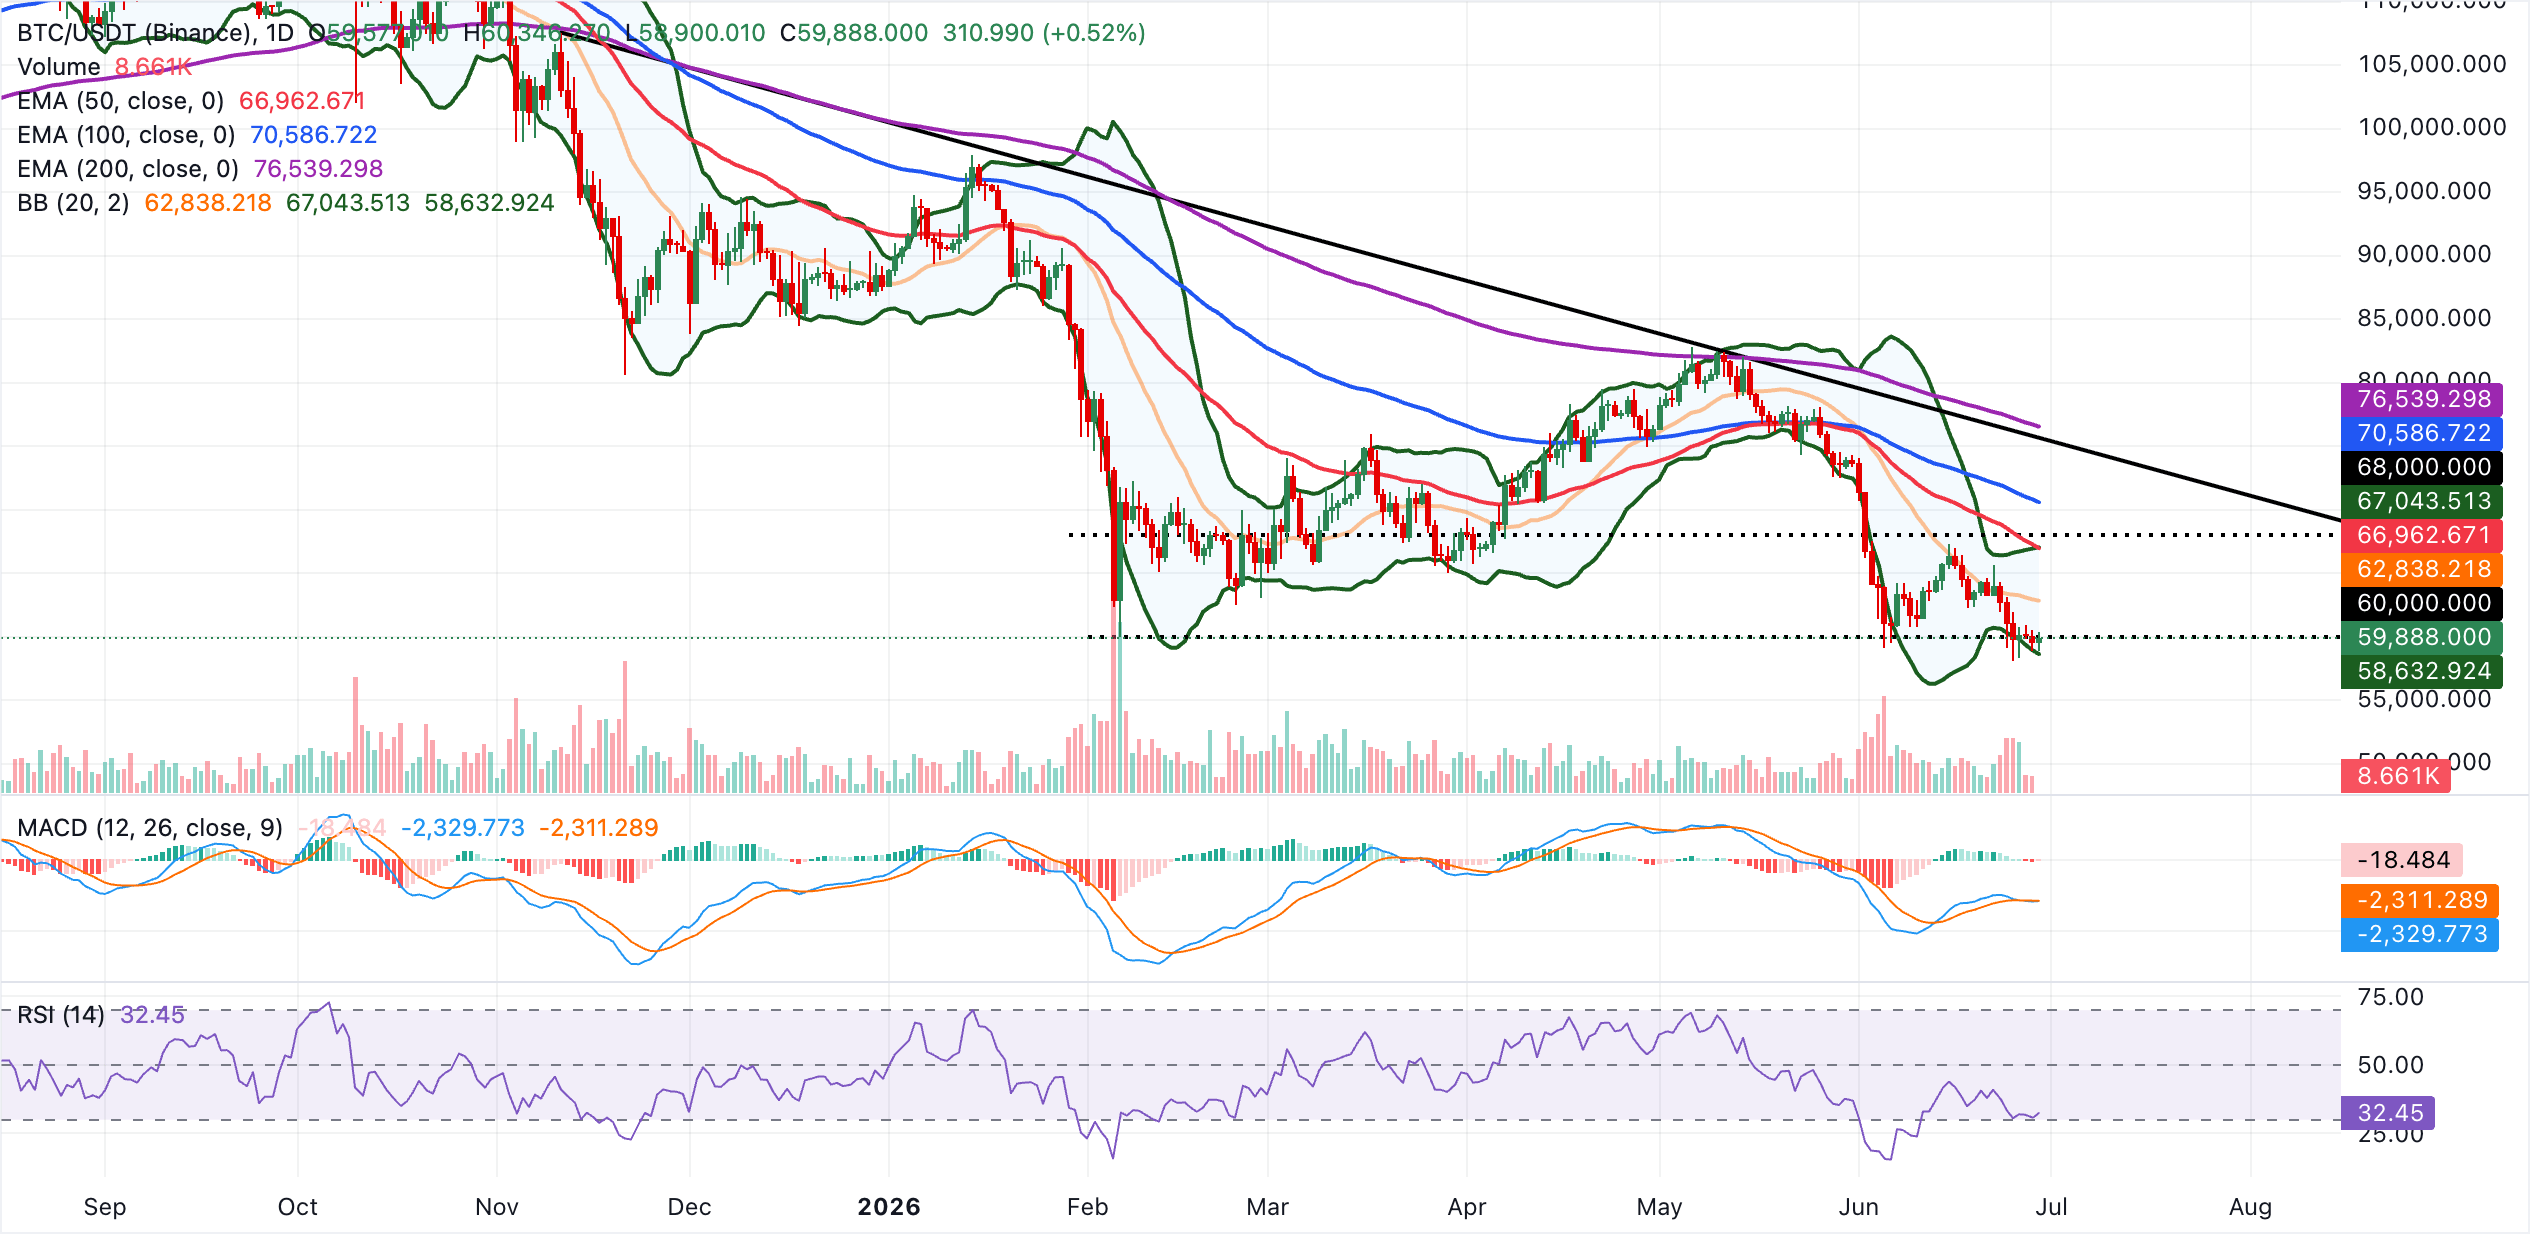
On the downside, immediate support aligns with the Bollinger lower band near $58,633, where sellers could pause before attempting deeper extension. Conversely, Bitcoin faces immediate resistance at the Bollinger middle band near $62,838, with additional hurdles at the 50-day EMA ($66,963) and the Bollinger upper band at $67,043. Should these levels be surpassed, further resistance is seen at the 100-day EMA ($70,587), the descending trendline at $75,625, and the 200-day EMA at $76,539, which marks a critical threshold for reversing the broader bearish trend.
Altcoins technical outlook: Ethereum rebounds as XRP seeks support
Ethereum trades at $1,574, edging slightly higher from previous week's dominant sell-off. Despite the mild gains, ETH holds below all major moving averages, which define a broader bearish trend.
Meanwhile, ETH sits below the Bollinger middle band at $1,673, highlighting ongoing downside pressure inside the volatility envelope, while the lower band at $1,528 offers the nearest cushion.
The MACD histogram holds in negative territory on the daily chart, hinting at weak bearish momentum rather than an impulsive selloff, as the RSI hovers around 30, flirting with oversold conditions that could slow the slide but not yet reverse the trend.
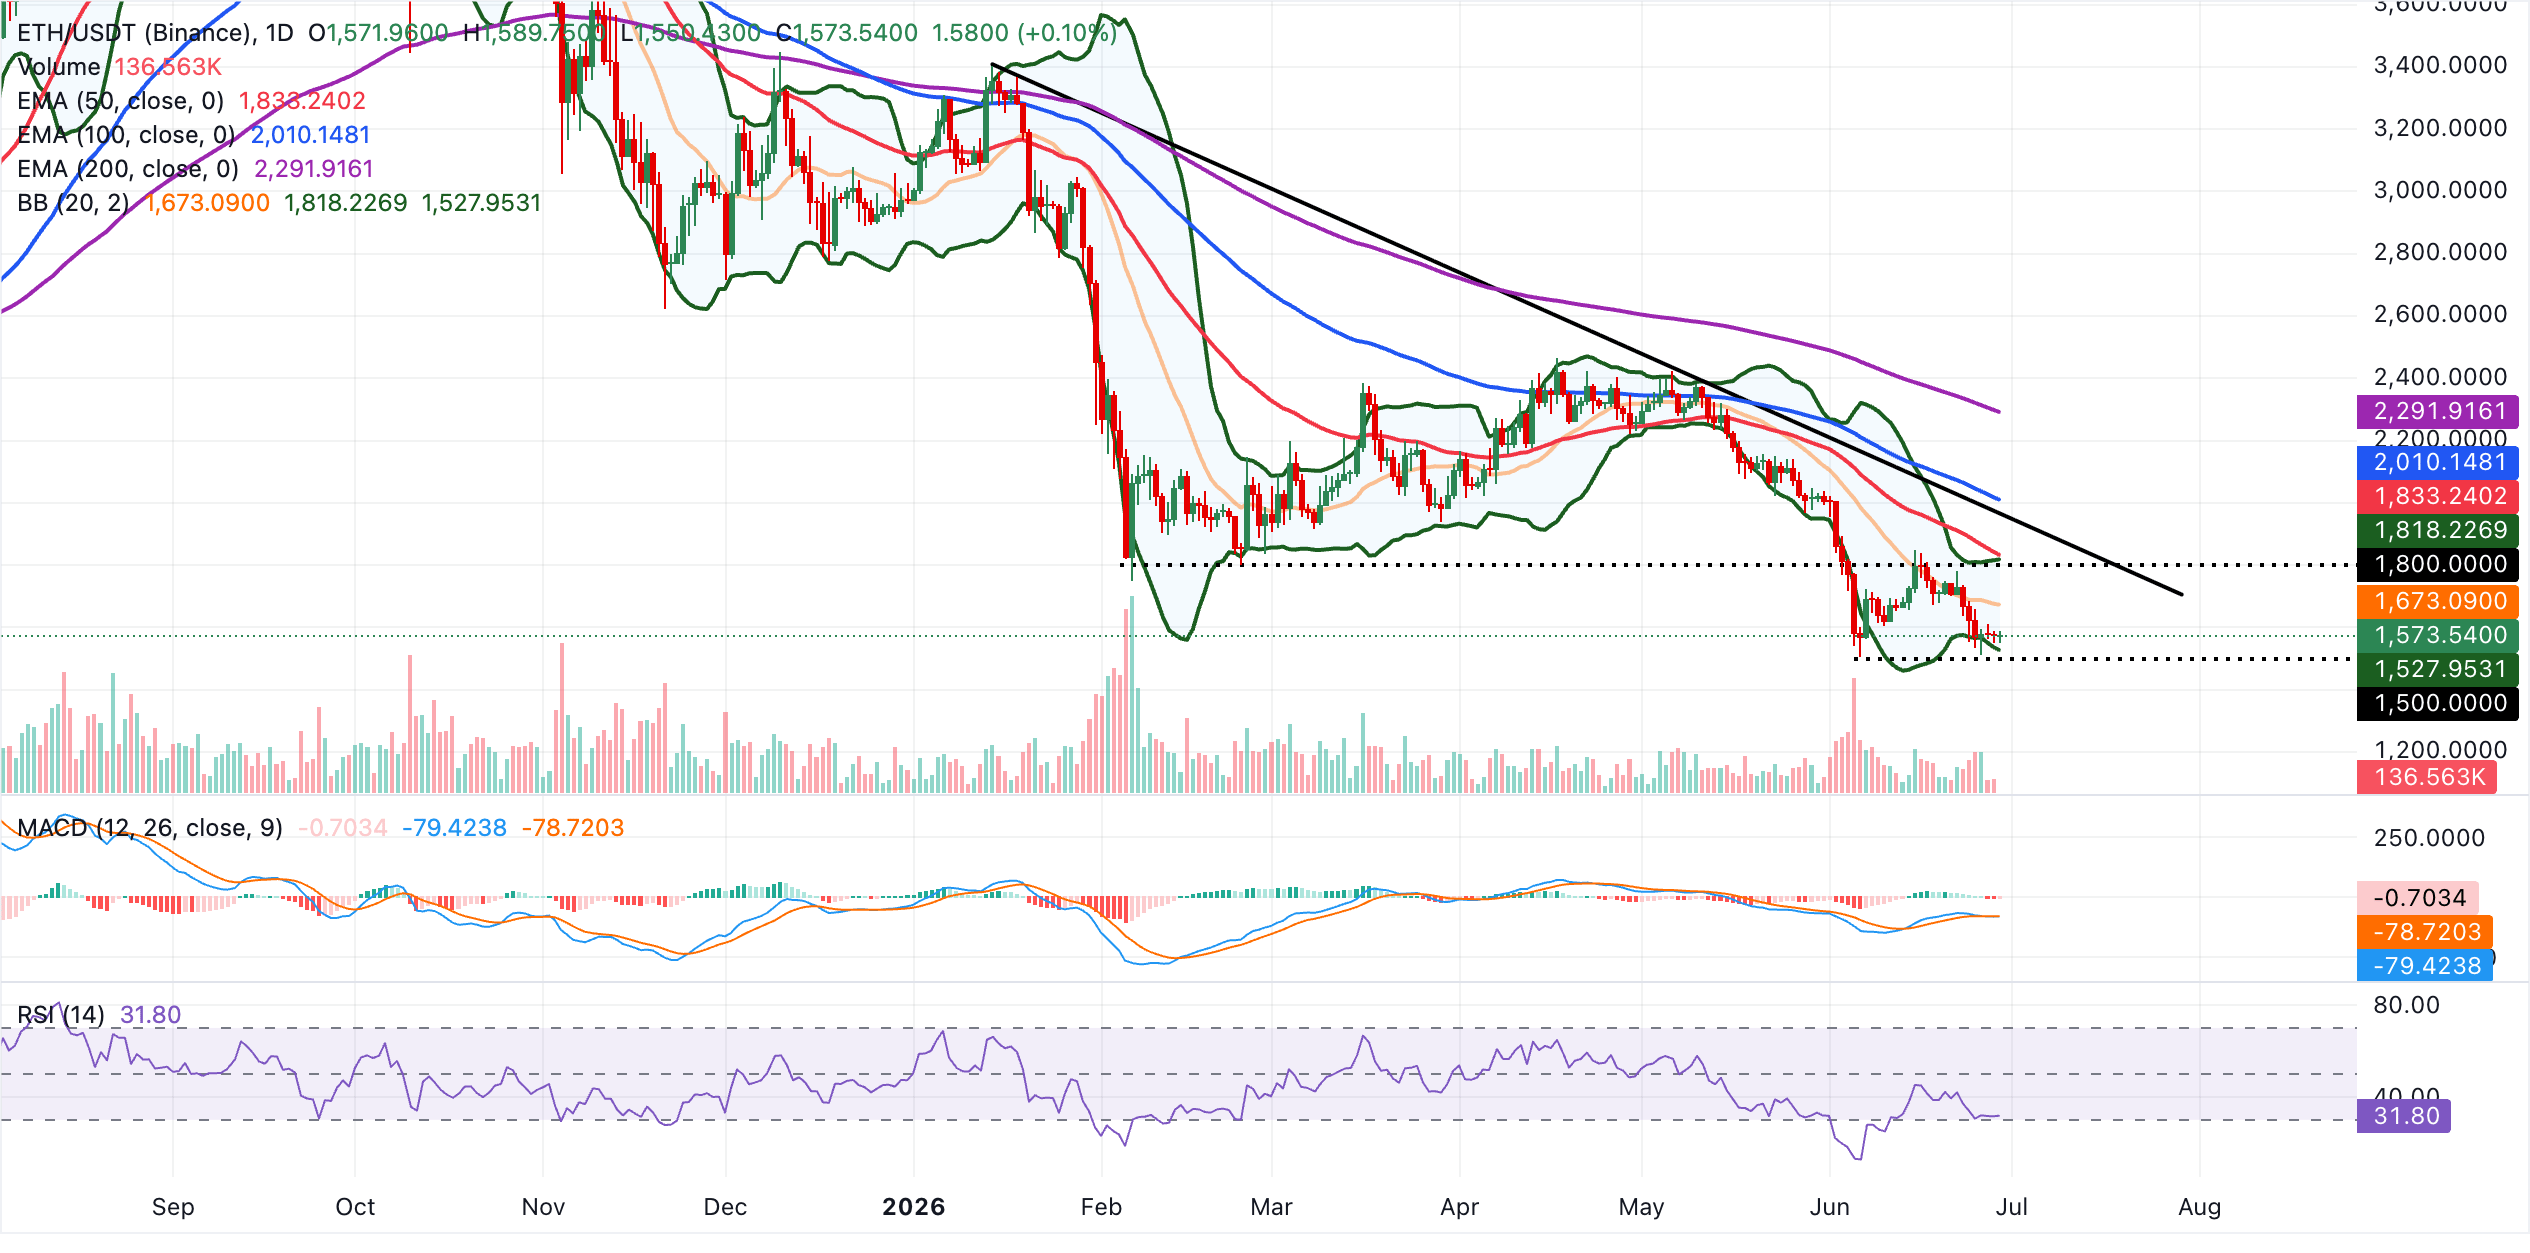
Initial resistance emerges at the Bollinger middle band near $1,673, followed by the upper band at $1,818 and the 50-day EMA at $1,833, which collectively cap any recovery attempts. Above these hurdles, a downward-sloping resistance trendline comes into play around the break price at $1,963, before the 100-day EMA at $2,010 and the 200-day EMA at $2,291 reinforce a heavier supply zone.
Looking down, immediate support lies at the Bollinger lower band around $1,528. A daily close below this floor would open the door to fresh lows, while holding above it would keep Ethereum in a weak, but stabilizing, consolidation within the lower half of its recent range.
XRP, on the other hand, trades at $1.04, extending its slide well below major moving averages, which are keeping the near-term bias firmly bearish. The remittance token is also trading beneath the Bollinger Bands’ middle boundary at $1.12 and the upper band near $1.24.
At the same time, the MACD indicator remains slightly negative on the daily chart, hinting that downside momentum persists even as the RSI near 32 approaches oversold territory.
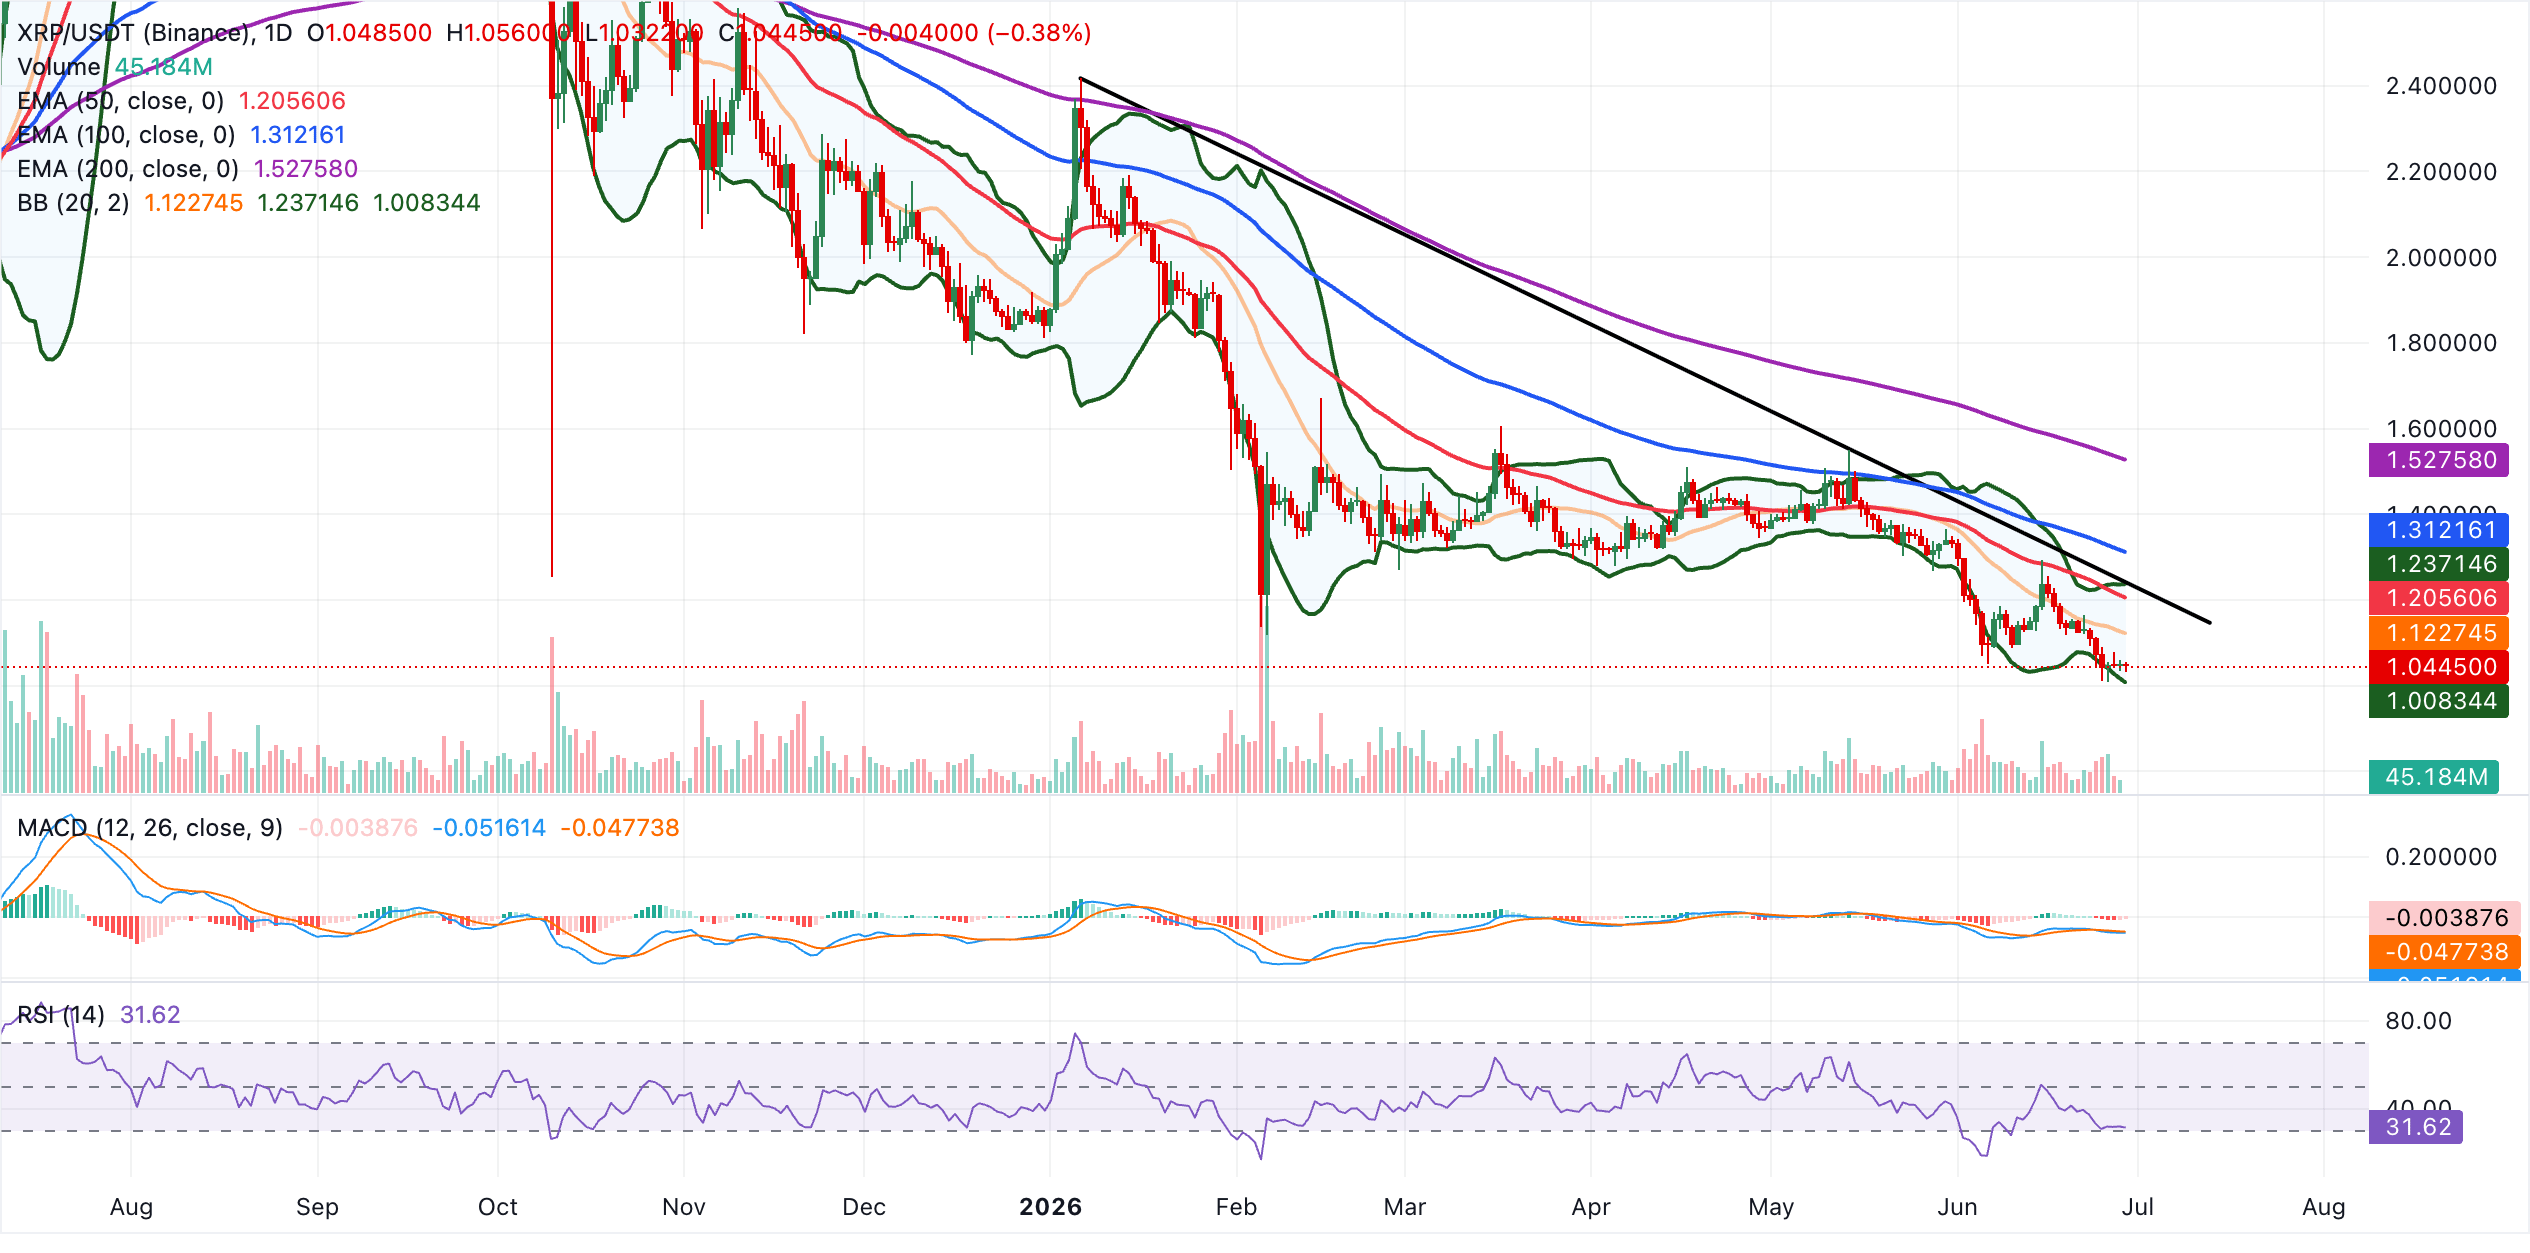
On the downside, immediate support lies around the Bollinger Bands’ lower boundary at $1.01, with the current level at $1.04 acting as a fragile pivot above that zone. On the topside, initial resistance is seen at the Bollinger middle band at $1.12, ahead of the upper band and the descending trendline break region clustered around $1.24. Further up, the 50-day EMA at $1.21, the 100-day EMA at $1.31 and the 200-day EMA at $1.53 define successive overhead barriers that would need to be reclaimed to ease the prevailing bearish pressure.
(The technical analysis of this story was written with the help of an AI tool.)
Bitcoin, altcoins, stablecoins FAQs
Bitcoin is the largest cryptocurrency by market capitalization, a virtual currency designed to serve as money. This form of payment cannot be controlled by any one person, group, or entity, which eliminates the need for third-party participation during financial transactions.
Altcoins are any cryptocurrency apart from Bitcoin, but some also regard Ethereum as a non-altcoin because it is from these two cryptocurrencies that forking happens. If this is true, then Litecoin is the first altcoin, forked from the Bitcoin protocol and, therefore, an “improved” version of it.
Stablecoins are cryptocurrencies designed to have a stable price, with their value backed by a reserve of the asset it represents. To achieve this, the value of any one stablecoin is pegged to a commodity or financial instrument, such as the US Dollar (USD), with its supply regulated by an algorithm or demand. The main goal of stablecoins is to provide an on/off-ramp for investors willing to trade and invest in cryptocurrencies. Stablecoins also allow investors to store value since cryptocurrencies, in general, are subject to volatility.
Bitcoin dominance is the ratio of Bitcoin's market capitalization to the total market capitalization of all cryptocurrencies combined. It provides a clear picture of Bitcoin’s interest among investors. A high BTC dominance typically happens before and during a bull run, in which investors resort to investing in relatively stable and high market capitalization cryptocurrency like Bitcoin. A drop in BTC dominance usually means that investors are moving their capital and/or profits to altcoins in a quest for higher returns, which usually triggers an explosion of altcoin rallies.
Bài viết đề xuất


