

Bitcoin Price Forecast: BTC nears make-or-break level ahead of US PCE data
- Bitcoin recovers slightly on Thursday after reaching a new yearly low of $59,103 the previous day.
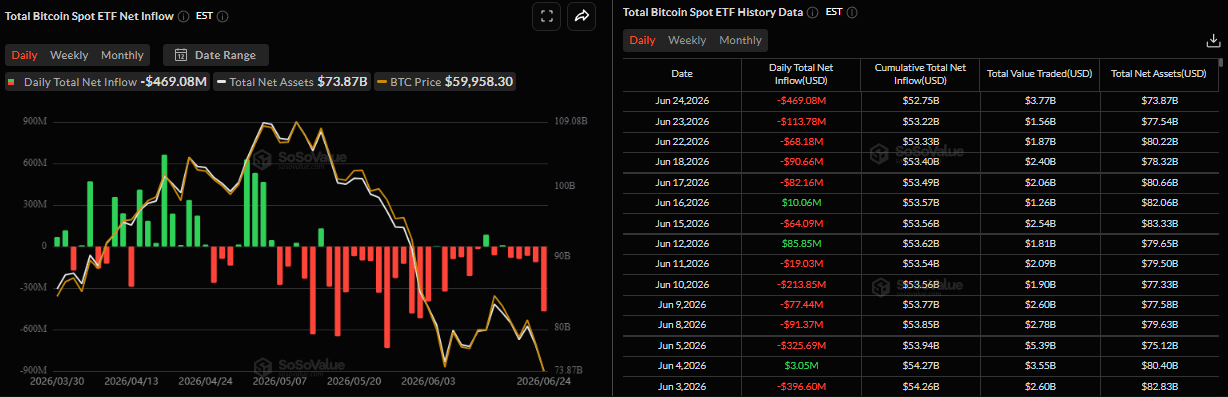
- Institutional selling intensifies with spot ETFs recording an outflow of $469.08 million on Wednesday, marking the fifth consecutive day of withdrawals.
- Market participants await the US PCE data on Thursday, which could provide cues about the Fed’s policy path.
Bitcoin (BTC) recovers slightly, trading at $61,700 on Thursday after reaching a new yearly low of $59,103 and a 21-month low the previous day. This bearish price action is supported by the ongoing institutional sell-off, which recorded an outflow of over $469 million on Wednesday. Meanwhile, traders are closely watching the release of the US Personal Consumption Expenditures (PCE) data on Thursday, the Federal Reserve’s (Fed) preferred inflation gauge, for signals on the future path of interest rates and broader risk appetite.
Institutional selling intensifies
Institutional demand continues to weaken so far this week. SoSoValue data show that spot BTC ETFs recorded an outflow of $469.08 million on Wednesday, following two days of outflows earlier this week. If these outflows continue and intensify over the coming days, BTC could see a deeper correction.
Why could US PCE data shape BTC’s next move?
Bitcoin has remained under pressure this week as traders assess mixed developments in the Middle East. While progress in the US-Iran peace negotiations initially improved market sentiment, ongoing tensions involving Israel and Lebanon have kept geopolitical uncertainty elevated.
Market participants now await the release of the US PCE Price Index data on Thursday, which is the Fed’s preferred inflation gauge. The data could provide fresh clues on the Fed’s interest-rate path and could significantly influence Bitcoin’s next directional move.
Meanwhile, inflation concerns have eased recently as Crude Oil prices declined sharply following the reopening of the Strait of Hormuz. Furthermore, a temporary 60-day sanctions waiver that authorizes the production, delivery, and sale of Iranian crude oil, petroleum, and petrochemical products dragged the black liquid to its lowest level since before the US-Iran war.
This should alleviate upstream pressure on consumer inflation, forcing traders to scale back their bets on Fed interest rate increases. The resultant decline in US Treasury bond yields caps any further appreciation of the US Dollar (USD). However, the improvement in the inflation outlook has done little to support Bitcoin, which extended its decline, falling to its lowest level since October 2024 on Wednesday.
According to CME Group’s FedWatch Tool, market participants are still pricing in over an 80% chance that the US central bank will raise borrowing costs by the end of this year, which continues to provide support for the US Dollar and limits demand for risk-sensitive assets.
In addition, a broader sell-off in global technology stocks earlier this week has further dampened investor sentiment. These combination of cautious risk appetite, persistent institutional selling and uncertainty surrounding the Fed’s policy outlook continues to weigh on BTC.
Bitcoin Price Forecast: Hits lowest level in 21 months
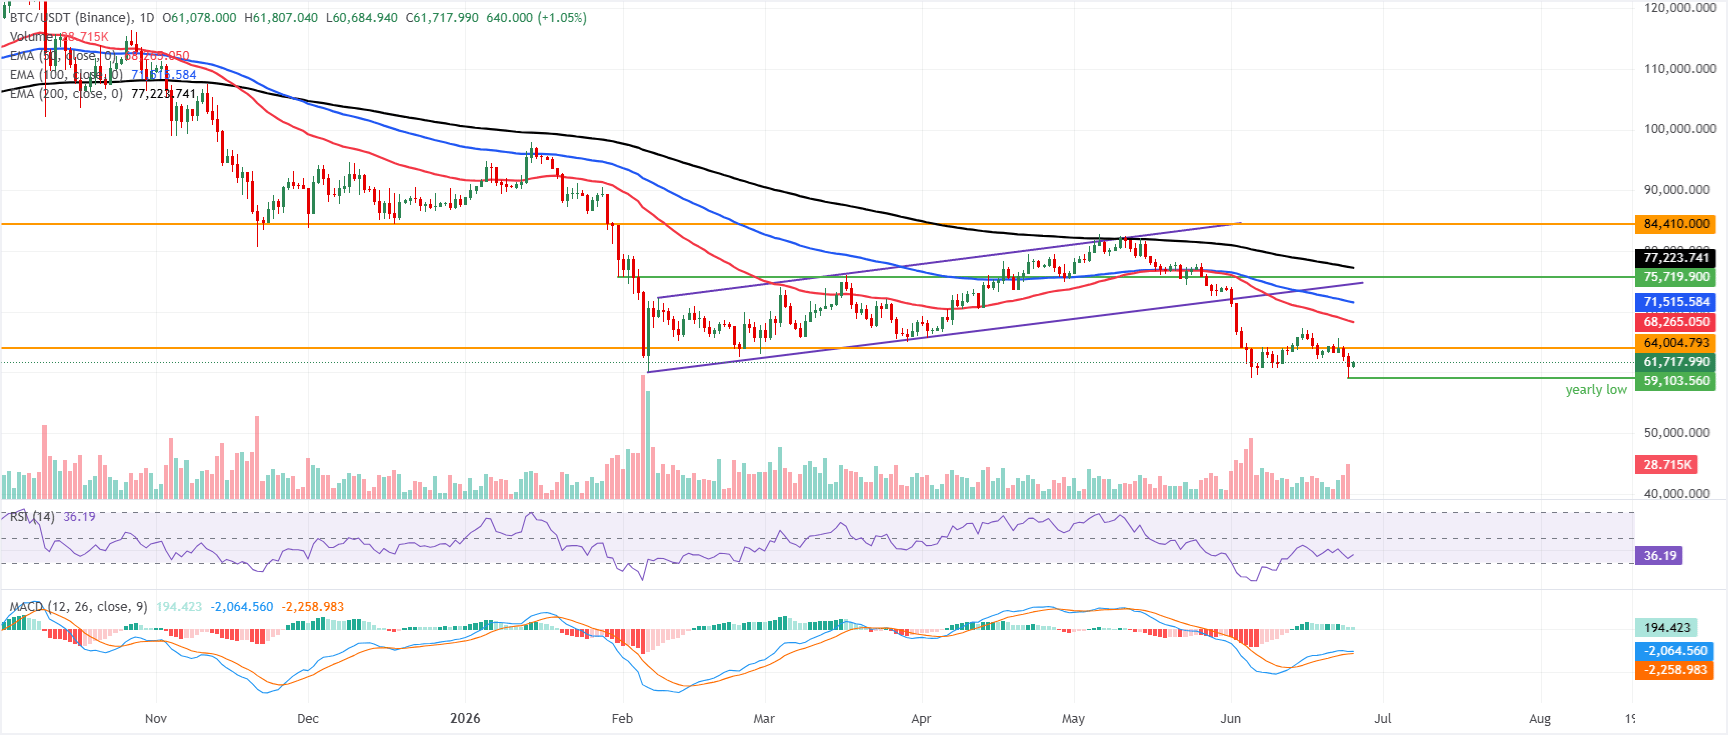
Bitcoin price recovers slightly, trading at $61,700 on Thursday after reaching the lowest level in 21 months, around $59,103 the previous day. BTC is holding a bearish near-term bias as price sits well below the 50-day, 100-day and 200-day Exponential Moving Averages (EMAs) clustered from roughly $68,265 to $77,223.
The Relative Strength Index (RSI) on the daily chart is hovering near 36, suggesting only tentative relief after a prior oversold stretch. At the same time, the Moving Average Convergence Divergence (MACD) remains modestly positive above zero, hinting at waning but not yet dominant downside momentum.
On the topside, initial resistance appears at the horizontal barrier near $64,004, ahead of the 50-day EMA around $68,2655 and the 100-day EMA at $71,515, with the longer-term bearish cap reinforced by the 200-day EMA near $77,223 and the major horizontal level at $84,410.
On the downside, the immediate focus stays on whether BTC can defend the key psychological level at $60,000, as a sustained break lower would expose further weakness.
(The technical analysis of this story was written with the help of an AI tool.)
Bitcoin, altcoins, stablecoins FAQs
Bitcoin is the largest cryptocurrency by market capitalization, a virtual currency designed to serve as money. This form of payment cannot be controlled by any one person, group, or entity, which eliminates the need for third-party participation during financial transactions.
Altcoins are any cryptocurrency apart from Bitcoin, but some also regard Ethereum as a non-altcoin because it is from these two cryptocurrencies that forking happens. If this is true, then Litecoin is the first altcoin, forked from the Bitcoin protocol and, therefore, an “improved” version of it.
Stablecoins are cryptocurrencies designed to have a stable price, with their value backed by a reserve of the asset it represents. To achieve this, the value of any one stablecoin is pegged to a commodity or financial instrument, such as the US Dollar (USD), with its supply regulated by an algorithm or demand. The main goal of stablecoins is to provide an on/off-ramp for investors willing to trade and invest in cryptocurrencies. Stablecoins also allow investors to store value since cryptocurrencies, in general, are subject to volatility.
Bitcoin dominance is the ratio of Bitcoin's market capitalization to the total market capitalization of all cryptocurrencies combined. It provides a clear picture of Bitcoin’s interest among investors. A high BTC dominance typically happens before and during a bull run, in which investors resort to investing in relatively stable and high market capitalization cryptocurrency like Bitcoin. A drop in BTC dominance usually means that investors are moving their capital and/or profits to altcoins in a quest for higher returns, which usually triggers an explosion of altcoin rallies.
Bài viết đề xuất


