


Crypto Today: Bitcoin, Ethereum, XRP rebound broadens despite continued US-Iran strikes
- Bitcoin ticks up toward $63,000 short-term resistance while traders ignore escalating geopolitical tensions amid continued exchange of fire between the US and Iran.
- Ethereum tests rebound strength above $1,650 as bulls eye a breakout beyond $1,800, with support from an improving technical structure.
- XRP holds steady above $1.12, building on rising momentum indicators.
Bitcoin (BTC) steadies its recovery on Thursday, edging higher toward $63,000 despite incessant capital outflows. Meanwhile, altcoins, including Ethereum (ETH) and Ripple (XRP), exhibit subtle rebound signs, trading above $1,650 and $1.12, respectively.
Investors pull capital as Middle East tensions escalate
Demand for risk assets remains significantly subdued as tensions in the Middle East fester, with the United States (US) and Iran exchanging fire. The strikes continued following US President Donald Trump's statement that Iran is taking too long to make a deal. Multiple targets were struck in Iran, with the US military describing them as “self-defense.”
Iran’s Islamic Revolutionary Guards Corps (IRGC) launched strikes against US military installations in Kuwait, Bahrain, and Jordan. Fox News also reported President Trump’s claim that Iranian officials requested a cessation of the most recent US attack.
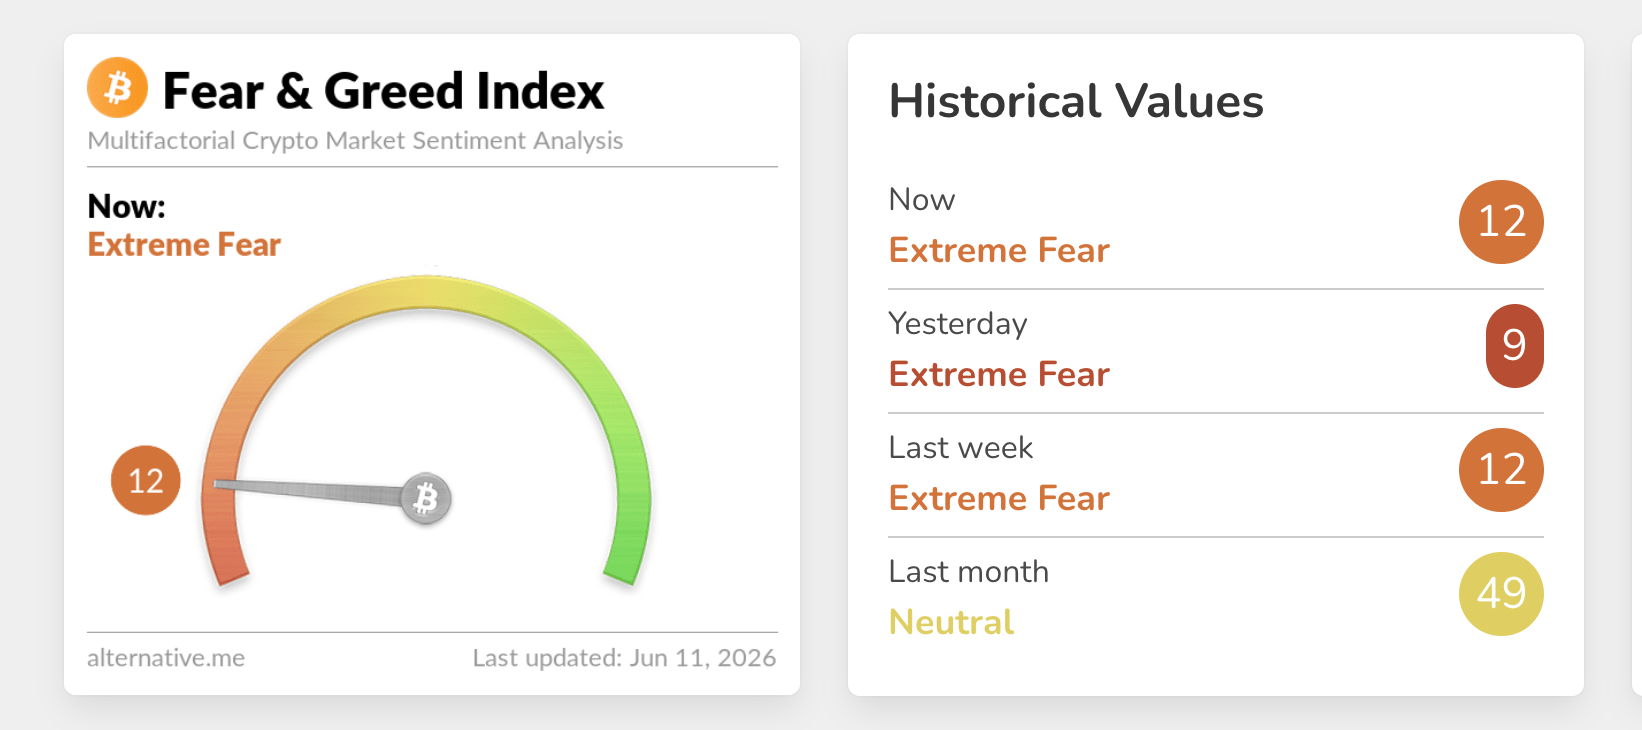
Risk-off sentiment remains sticky, as reflected in the crypto Fear & Greed Index, which holds at 12 in the Extreme Fear territory on Thursday, up slightly from 10 the day before. Sticky risk-off sentiment will likely limit the crypto market’s broader recovery, keeping investors on the sidelines.
Price analysis: Bitcoin regains momentum
Bitcoin trades at near $63,000 extending a bearish phase as it holds well beneath a dense band of moving average resistance. The 50-day Exponential Moving Average (EMA) at $71,677, the 100-day EMA at 7$4,003 and the 200-day EMA at $79,330 all sit comfortably above spot, suggesting the broader trend remains under downside pressure.
The latest SuperTrend reading at $68,416 also aligns overhead, reinforcing the view that any recovery attempts are likely to be capped while price trades below this cluster. Momentum tools are weak but mixed in tone, with the Relative Strength Index (RSI) hovering near 30 on the daily chart, hinting at oversold conditions. At the same time, the negative Moving Average Convergence Divergence (MACD histogram holds below the zero line on the same chart, aligning with the prevailing bearish momentum.
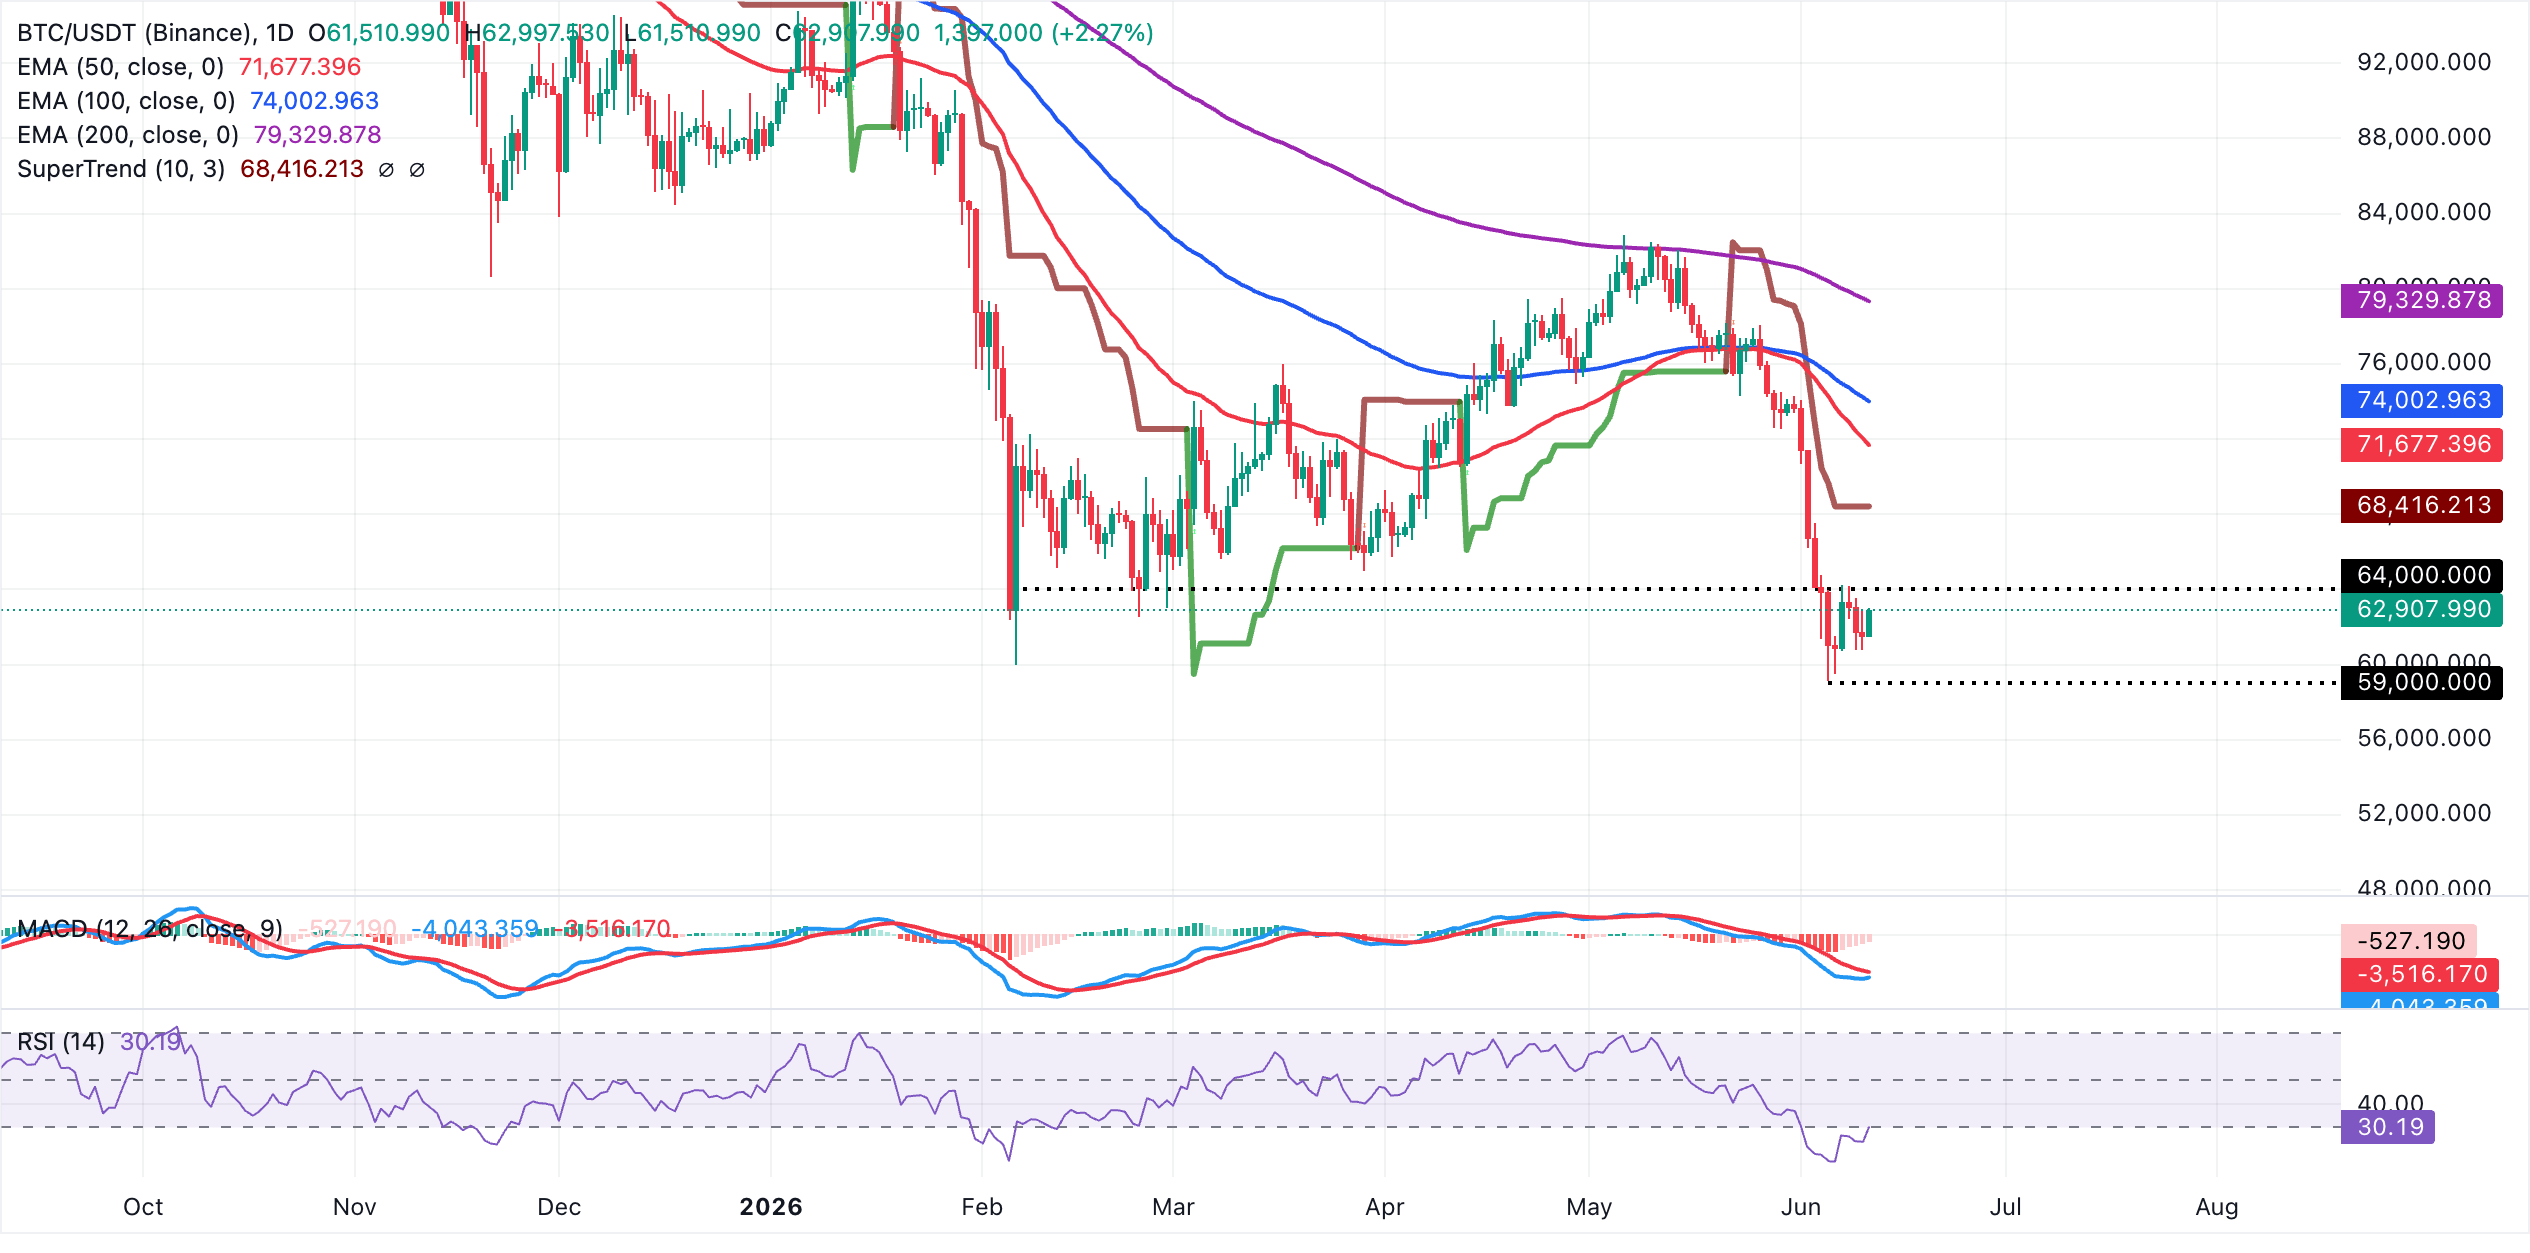
On the topside, initial resistance lies at the SuperTrend barrier near $68,416, where a daily close above would be needed to ease immediate selling pressure. Further up, the 50-day EMA at $71,677 and the 100-day EMA at $74,003 form the next key caps, ahead of a more strategic ceiling at the 200-day EMA around $79,330, which currently defines the upper boundary of the broader corrective structure. If the sell-off resumes, traders will seek to re-engage at key psychological levels $60,000 and $56,000.
Altcoins technical outlook: Ethereum and XRP uphold knee-jerk recovery
Ethereum trades at $1,662, extending a bearish phase with price holding well beneath the 50-day, 100-day and 200-day EMAs. The 50-day EMA at $2,012 is the first dynamic resistance, followed by the 100-day EMA at $2,158 and the 200-day EMA at $2,422, together suggesting that any rebound would face layered supply overhead.
Momentum conditions remain heavy, as the Moving Average Convergence Divergence (MACD) indicator stays in negative territory on the daily chart and the RSI hovers around the 30 mark on the daily chart, hinting at oversold but still pressured conditions rather than a confirmed bullish reversal.
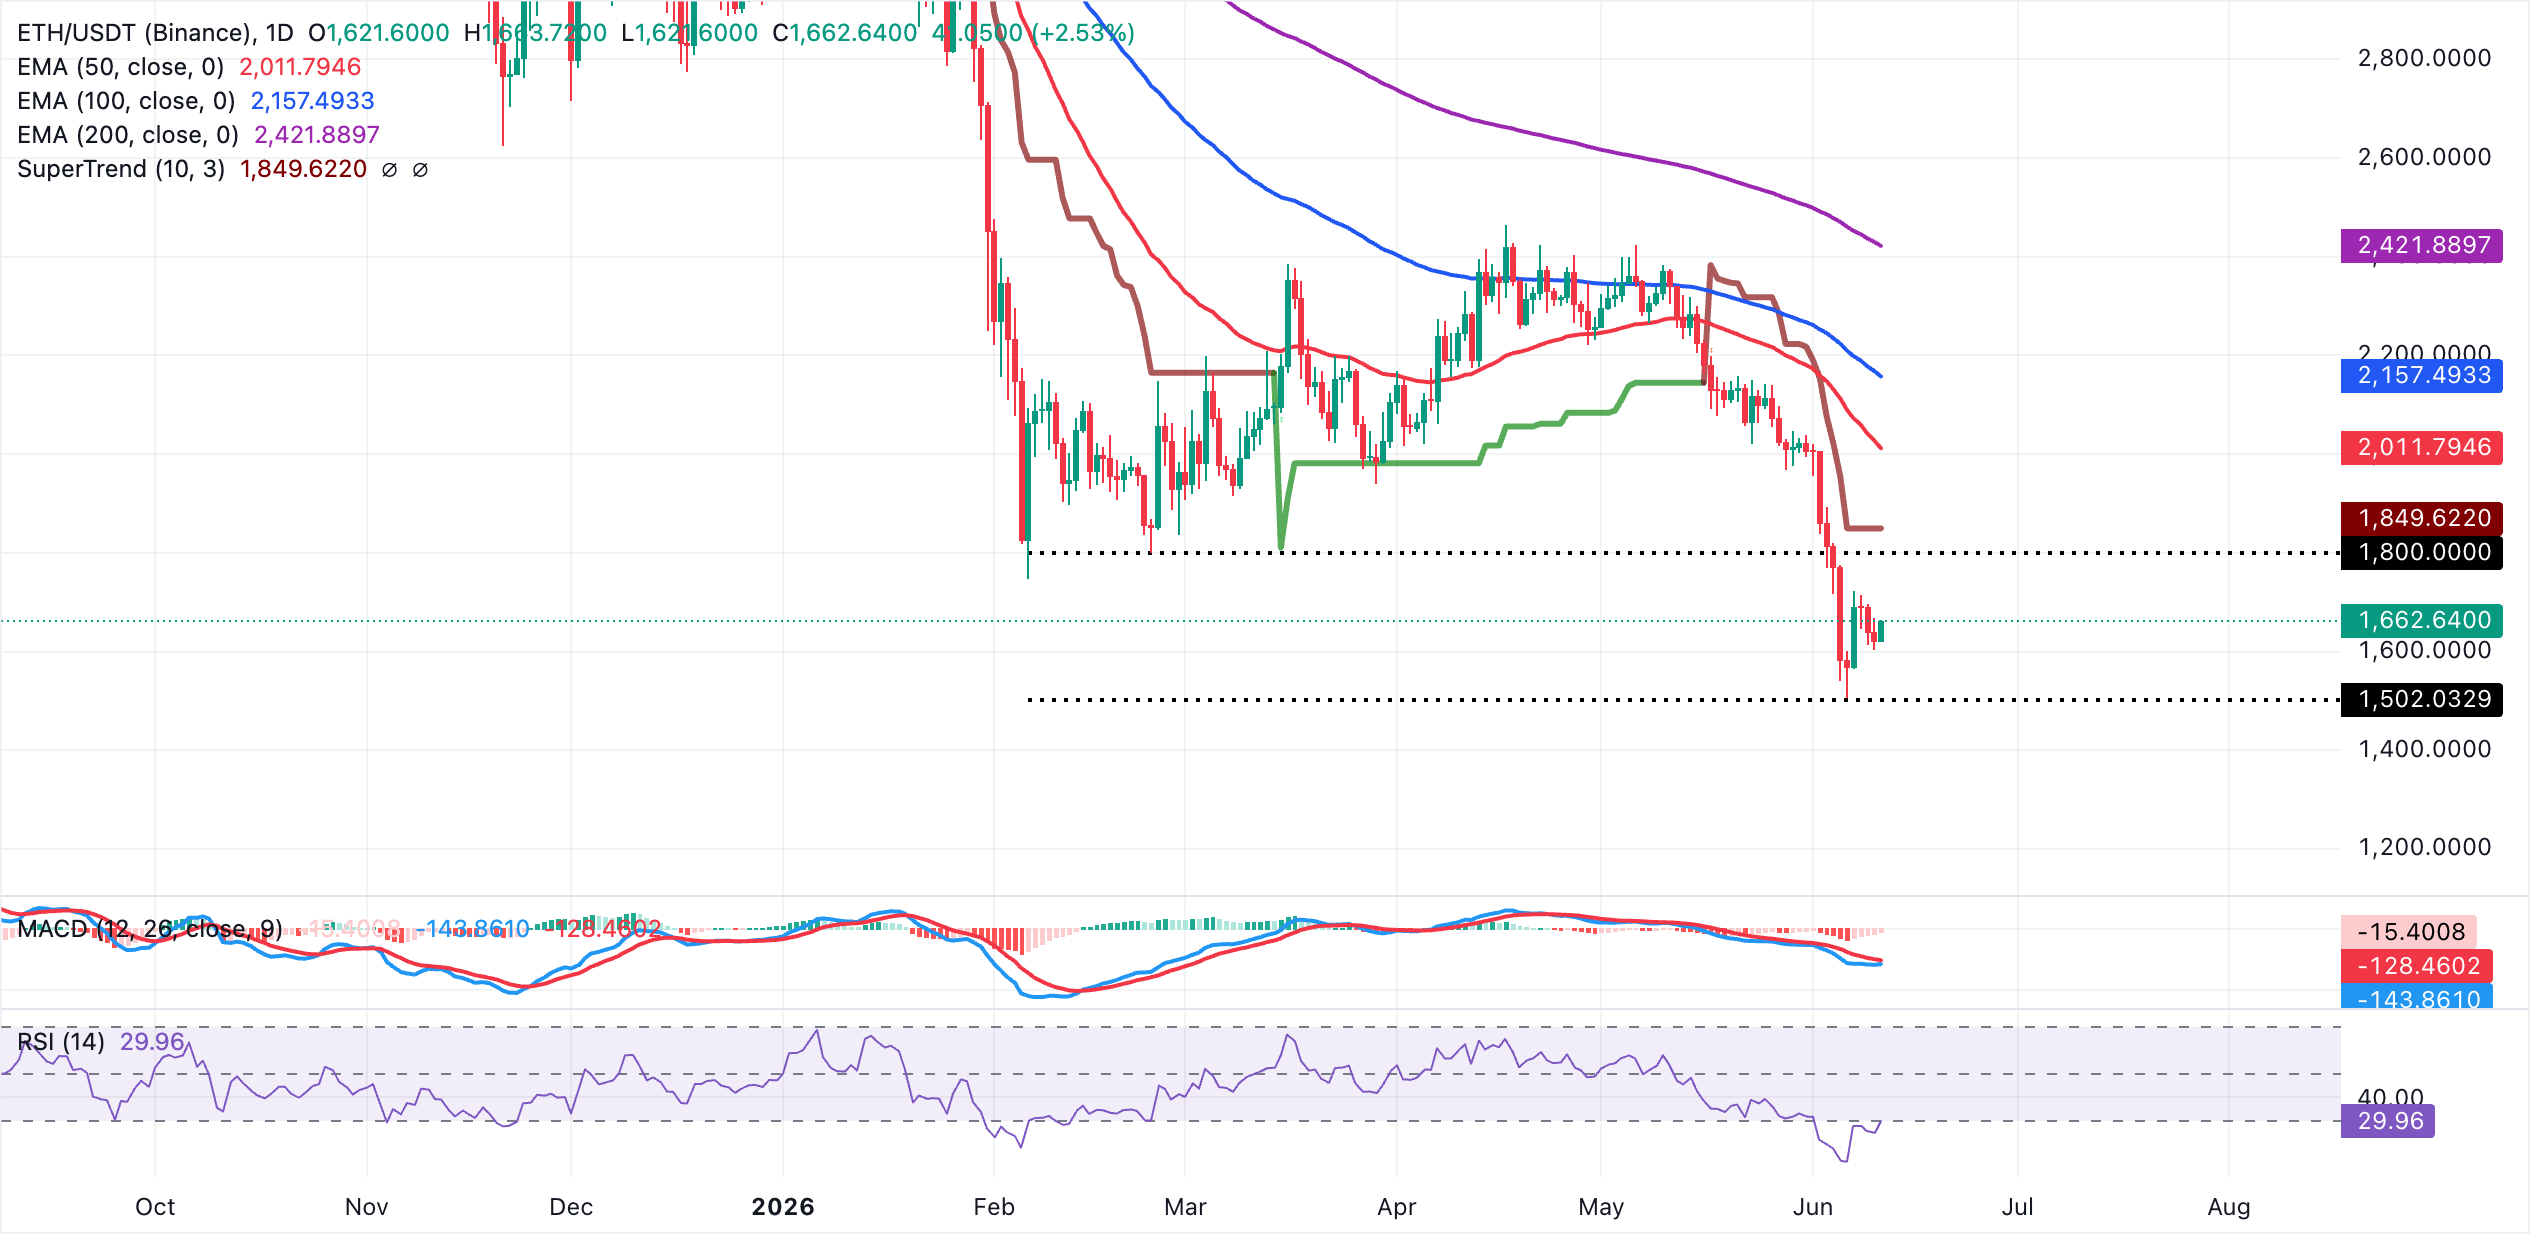
On the downside, the nearest psychological support lies at $1,600, followed by $1,500. Holding above these areas could encourage buyers to increase their exposure, anticipating a sustained breakout toward the SuperTrend line resistance at $1,850. On the topside, a daily close back above the 50-day EMA at $2,012 would be the first signal that sellers are losing control, opening the door toward the 100-day EMA at $2,158 and, if overcome, the more significant 200-day EMA at $2,422.
XRP, on the other hand, trades at $1.12, extending a bearish near-term bias as price remains decisively below the 50-day, 100-day and 200-day EMAs clustered from $1.30 to $1.61, while the SuperTrend line at $1.26 also caps the upside.
The RSI has recovered from oversold territory but holds near 32 on the daily chart, hinting that selling pressure is merely easing rather than reversing, and the negative MACD histogram reinforces a still-dominant downside momentum backdrop.
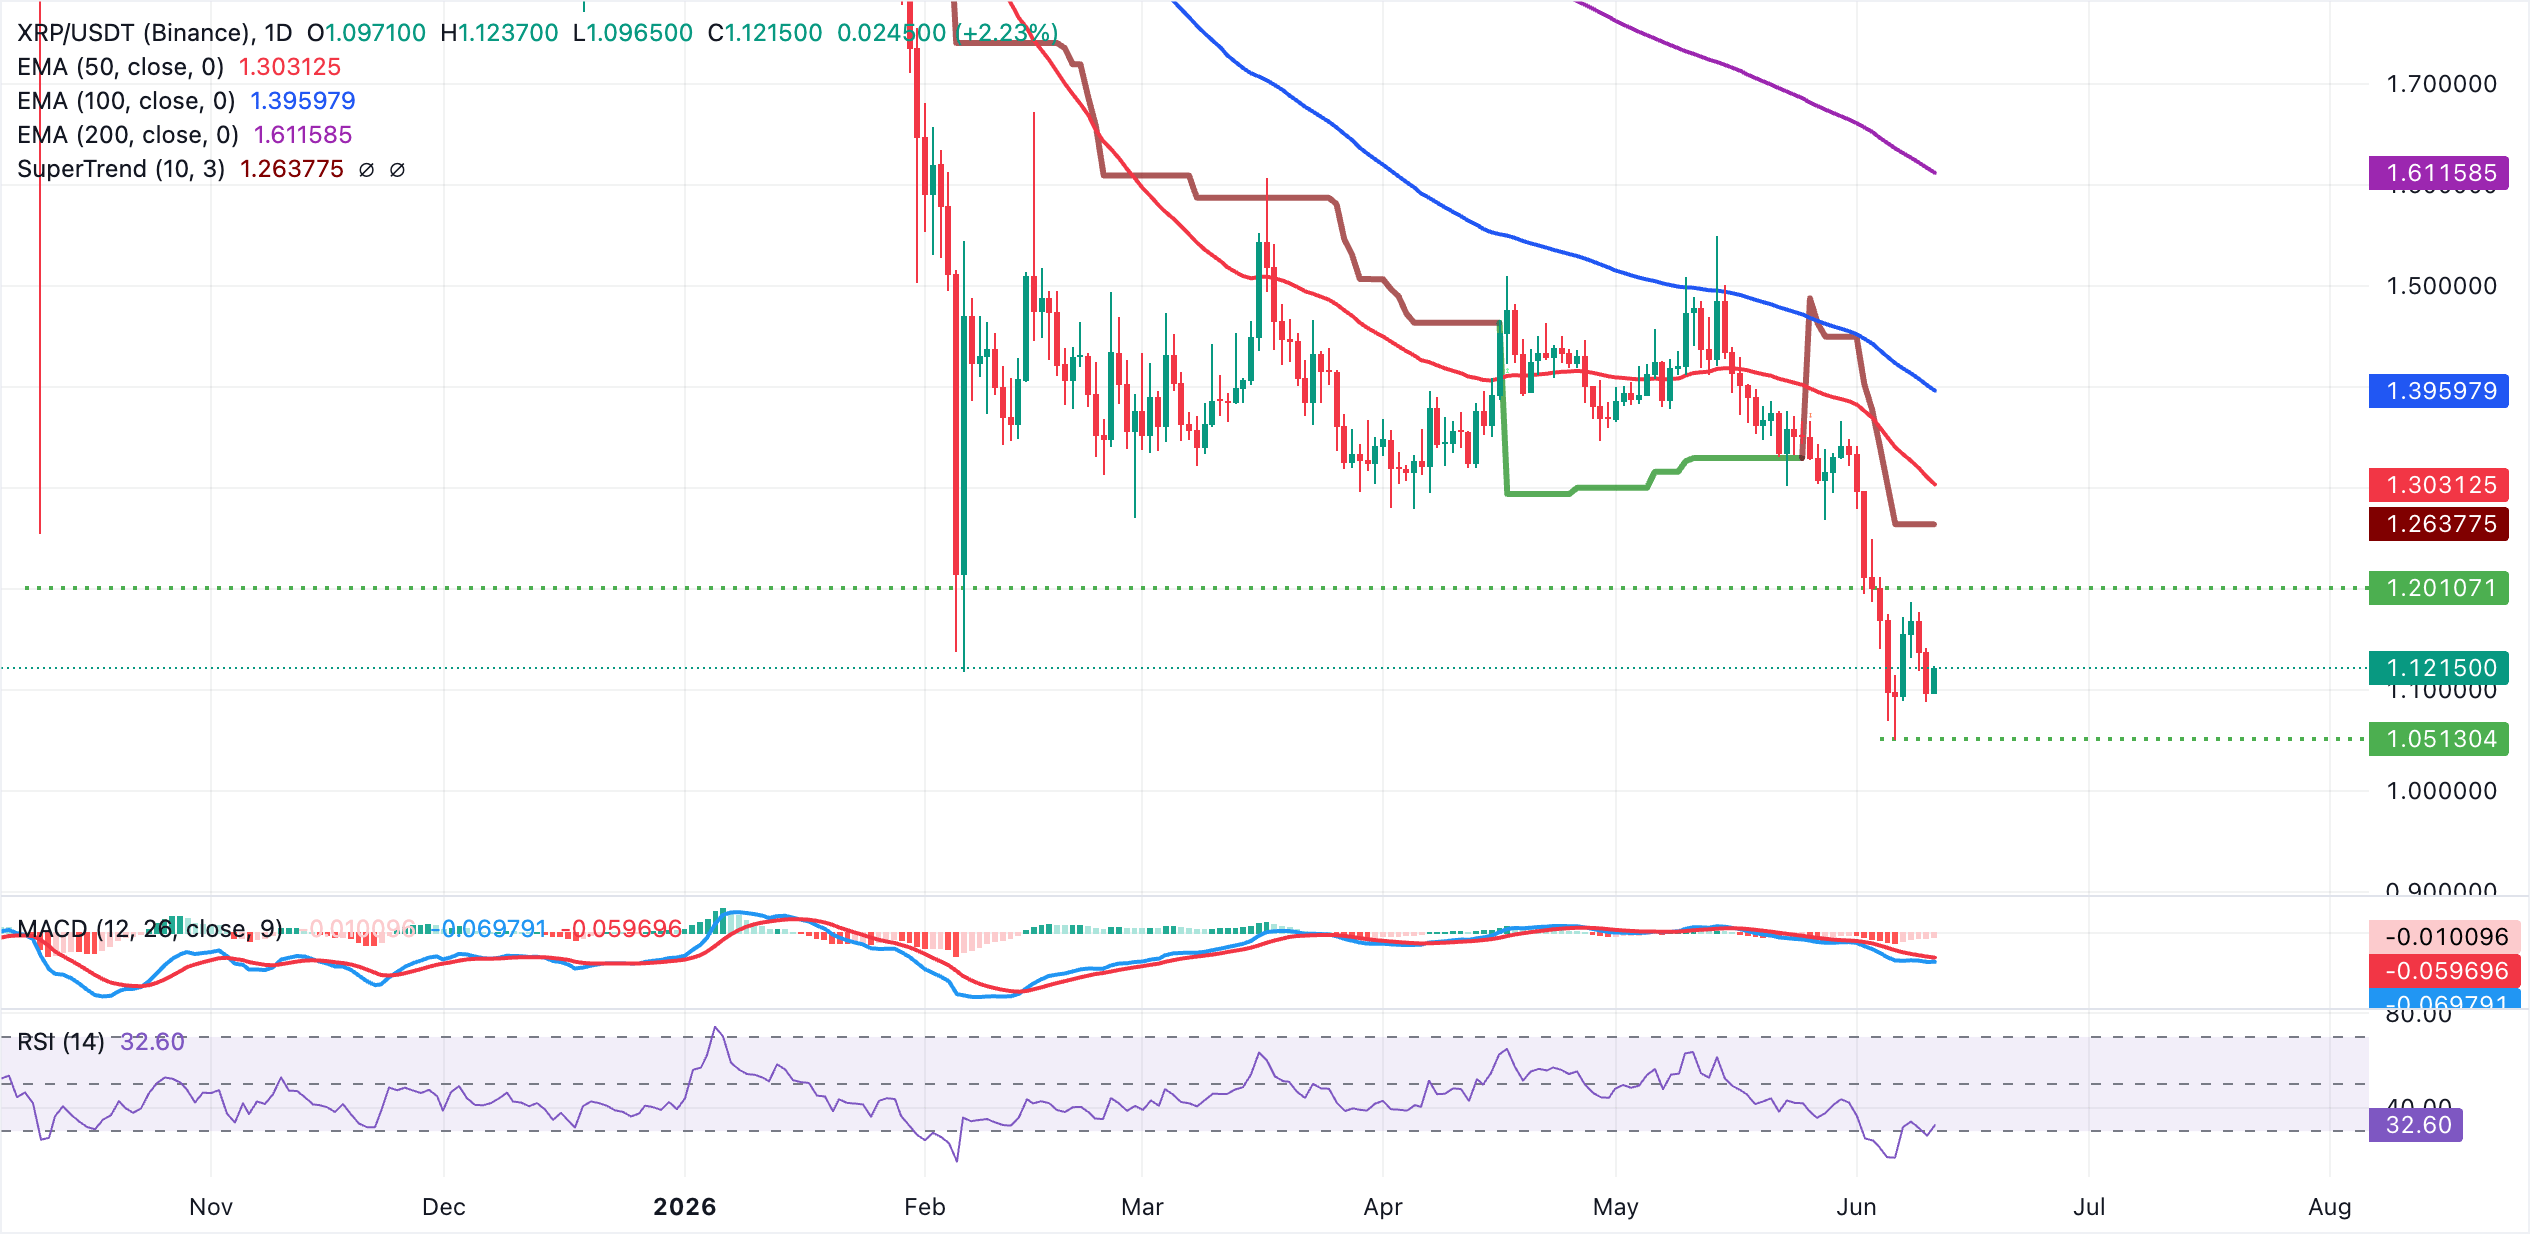
On the topside, initial resistance appears at the SuperTrend barrier around $1.26, ahead of the 50-day EMA at $1.30, where a daily close above would be needed to alleviate immediate downside pressure. Further up, the 100-day EMA at $1.40 and the 200-day EMA near $1.61 define a broader bearish structure. Unless XRP reclaims at least the lower of these medium and long-term averages, rebounds are likely to be treated as corrective within the prevailing downtrend.
(The technical analysis of this story was written with the help of an AI tool.)
Bitcoin, altcoins, stablecoins FAQs
Bitcoin is the largest cryptocurrency by market capitalization, a virtual currency designed to serve as money. This form of payment cannot be controlled by any one person, group, or entity, which eliminates the need for third-party participation during financial transactions.
Altcoins are any cryptocurrency apart from Bitcoin, but some also regard Ethereum as a non-altcoin because it is from these two cryptocurrencies that forking happens. If this is true, then Litecoin is the first altcoin, forked from the Bitcoin protocol and, therefore, an “improved” version of it.
Stablecoins are cryptocurrencies designed to have a stable price, with their value backed by a reserve of the asset it represents. To achieve this, the value of any one stablecoin is pegged to a commodity or financial instrument, such as the US Dollar (USD), with its supply regulated by an algorithm or demand. The main goal of stablecoins is to provide an on/off-ramp for investors willing to trade and invest in cryptocurrencies. Stablecoins also allow investors to store value since cryptocurrencies, in general, are subject to volatility.
Bitcoin dominance is the ratio of Bitcoin's market capitalization to the total market capitalization of all cryptocurrencies combined. It provides a clear picture of Bitcoin’s interest among investors. A high BTC dominance typically happens before and during a bull run, in which investors resort to investing in relatively stable and high market capitalization cryptocurrency like Bitcoin. A drop in BTC dominance usually means that investors are moving their capital and/or profits to altcoins in a quest for higher returns, which usually triggers an explosion of altcoin rallies.
Bài viết đề xuất


