

Ripple Forecast: XRP rebound takes a breather as addresses in profit rise to 65%
- XRP pressured below the $1.50 supply zones but holds $1.45 short-term support on Friday.
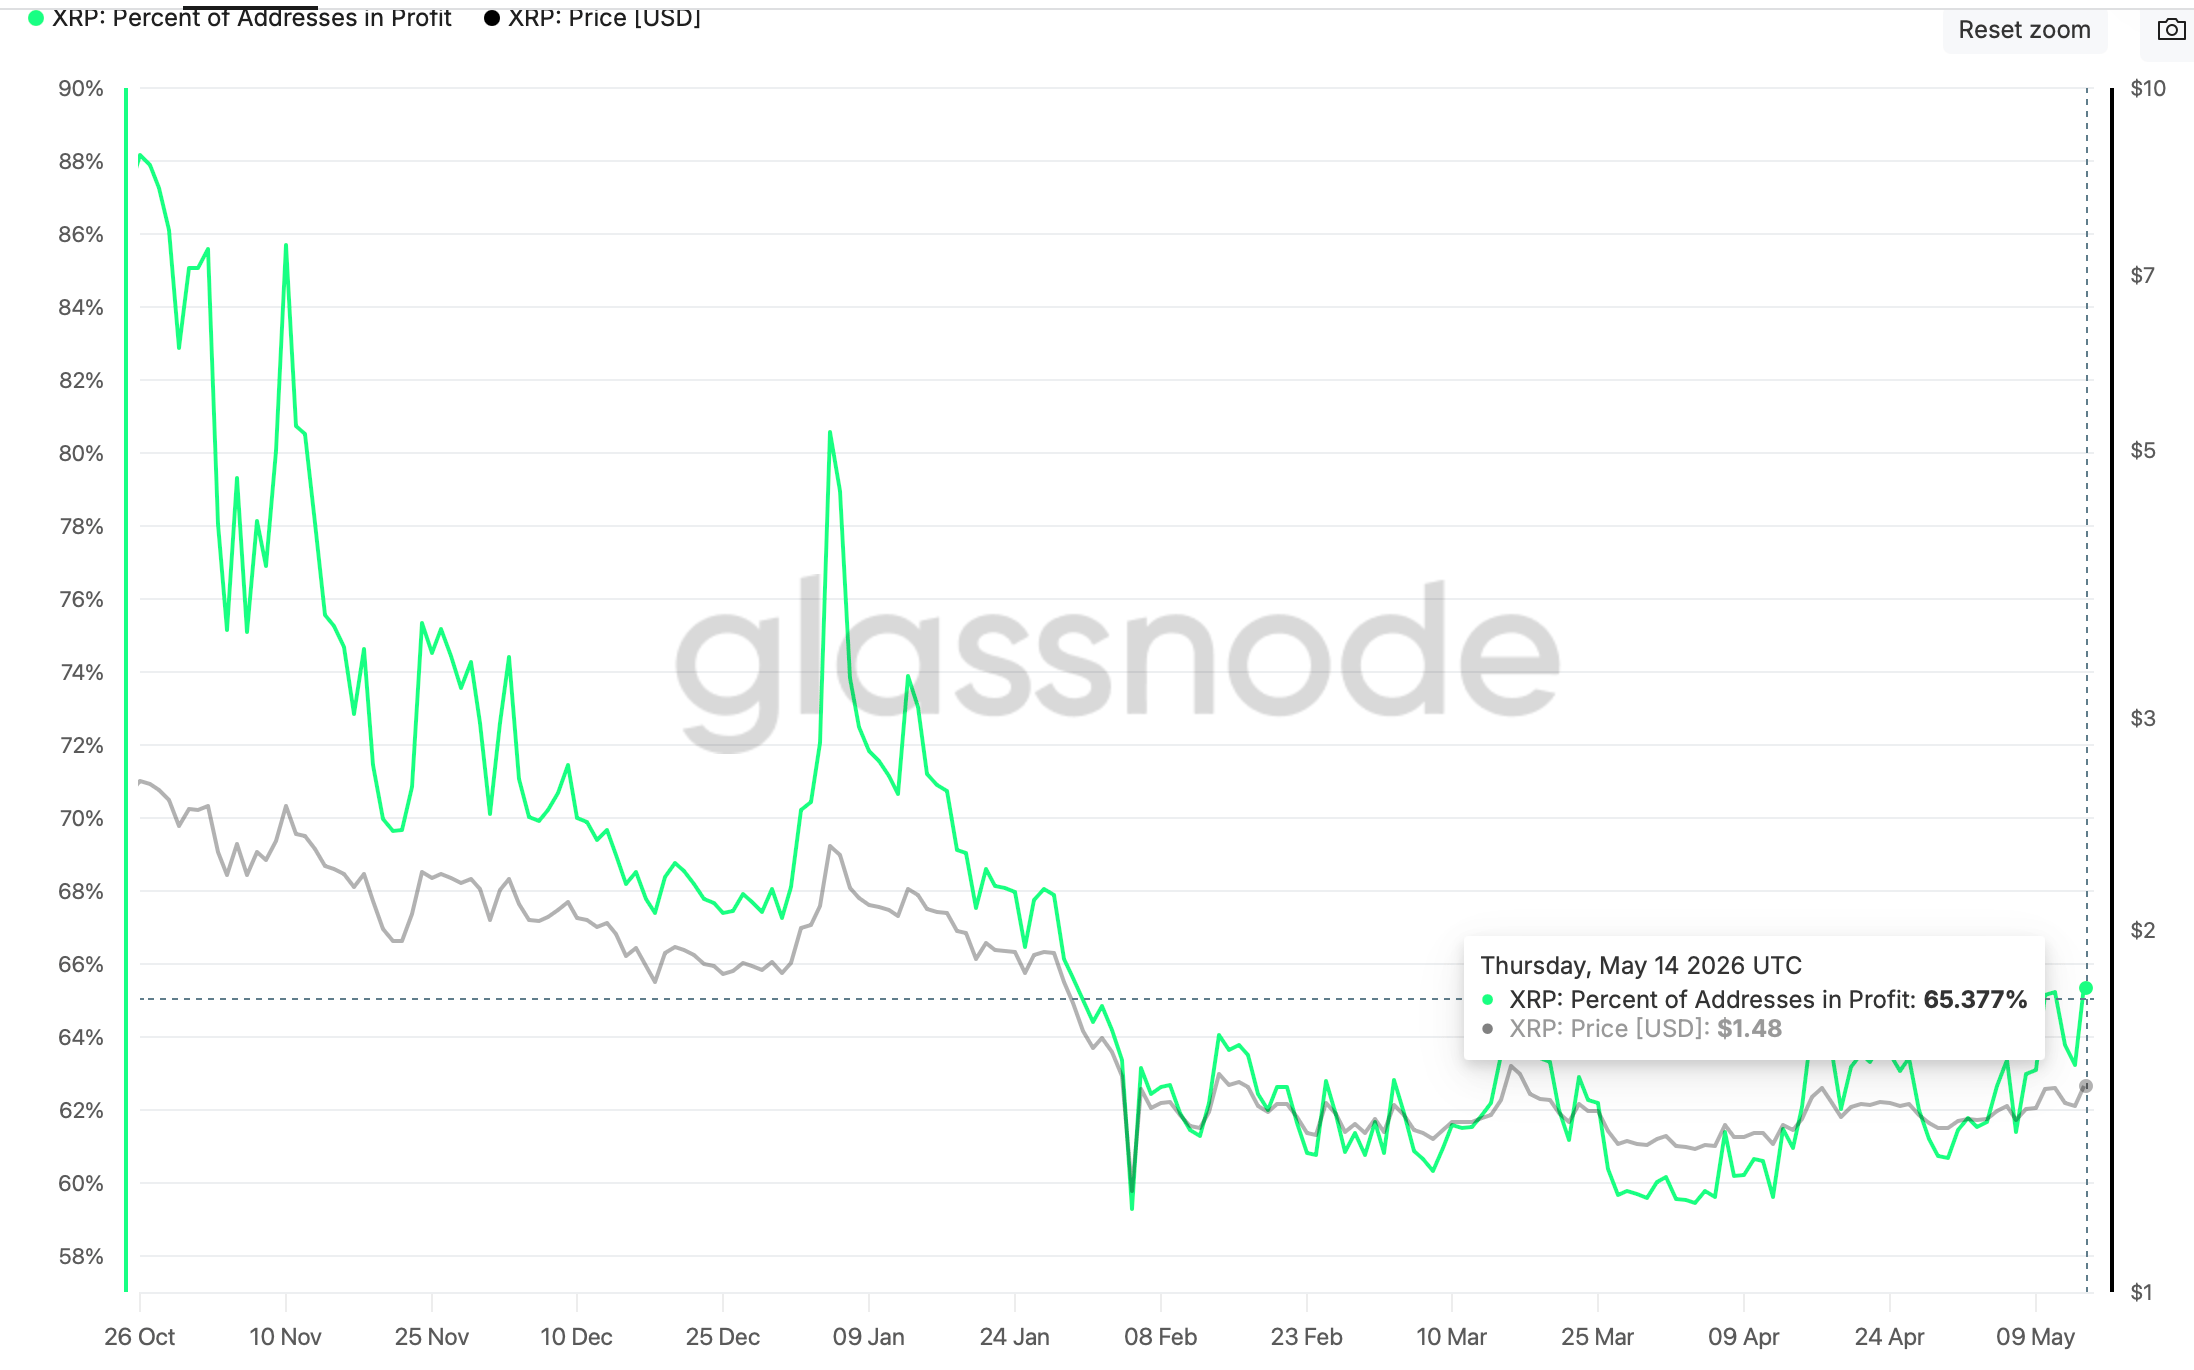
- The percentage of XRP addresses in profit rebounded to 65% on Thursday, reflecting a notable uptick in market risk appetite.
- XRP retail and institutional investors increase risk exposure as capital flows in through derivatives and spot ETFs.
Ripple (XRP) is grinding lower and testing support at $1.43 at the time of writing on Friday. It is pressured by strong bearish waves from the supply range at $1.50, which has capped its upside since Monday.
Despite the United States (US) Senate Banking Committee advancing the Digital Asset Market Clarity Act of 2025, commonly known as the Clarity Act, on Thursday, marking a major milestone for digital assets regulation in the country, sentiment remained largely constrained due to a lack of conviction in the broader crypto market’s recovery outlook.
XRP addresses in profit tick up amid capital inflows
The percentage of XRP addresses with unrealized profit rebounded to around 65% on Thursday, up from 63% the previous day. This increase coincided with XRP testing the $1.50 resistance and underscores a growing risk-on sentiment among market participants.
Still, traders should remain cautiously optimistic in case investors realize profits, which could weigh on the price amid a weakening technical environment.
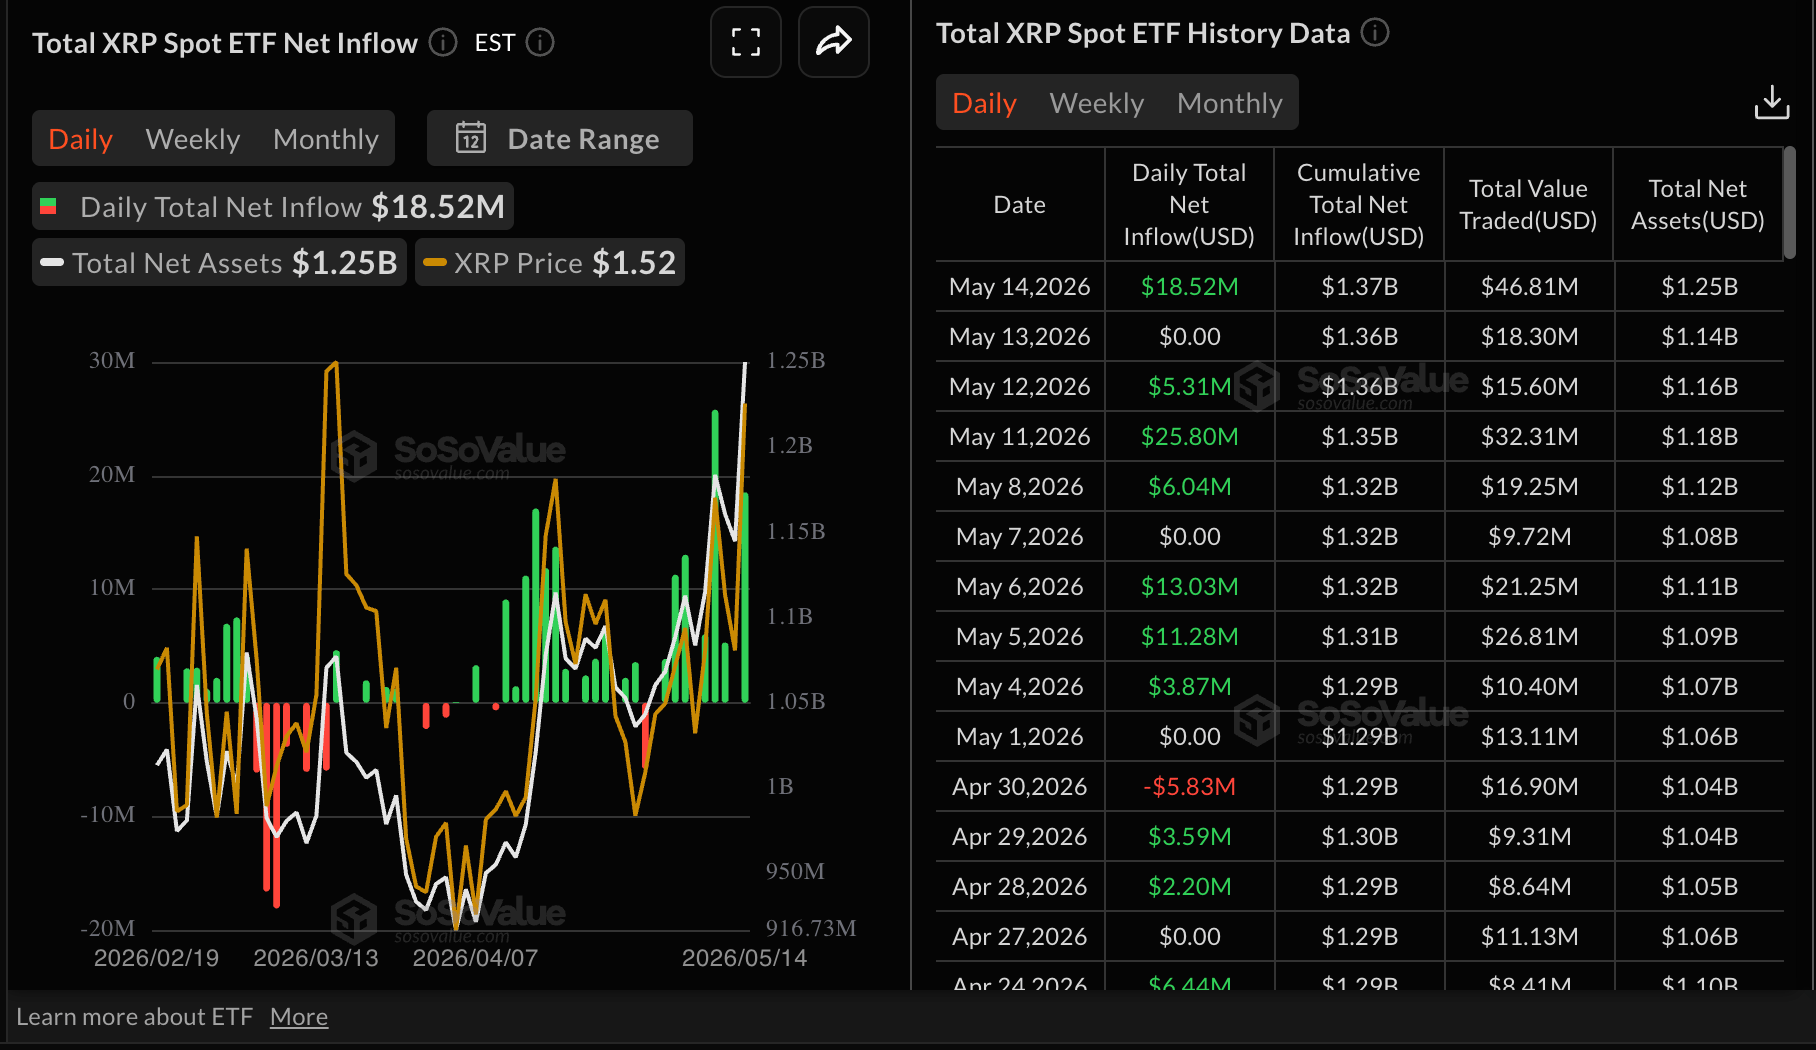
Institutional flows into XRP spot Exchange-Traded Funds (ETFs) rebounded sharply on Thursday, with nearly $19 million in fresh inflows following a brief pause the previous day. Demand for these ETFs has held steady, with cumulative inflows rising to $1.37 billion from $1.36 billion, while net assets under management increased to an average of $1.25 billion, up from $1.14 billion.
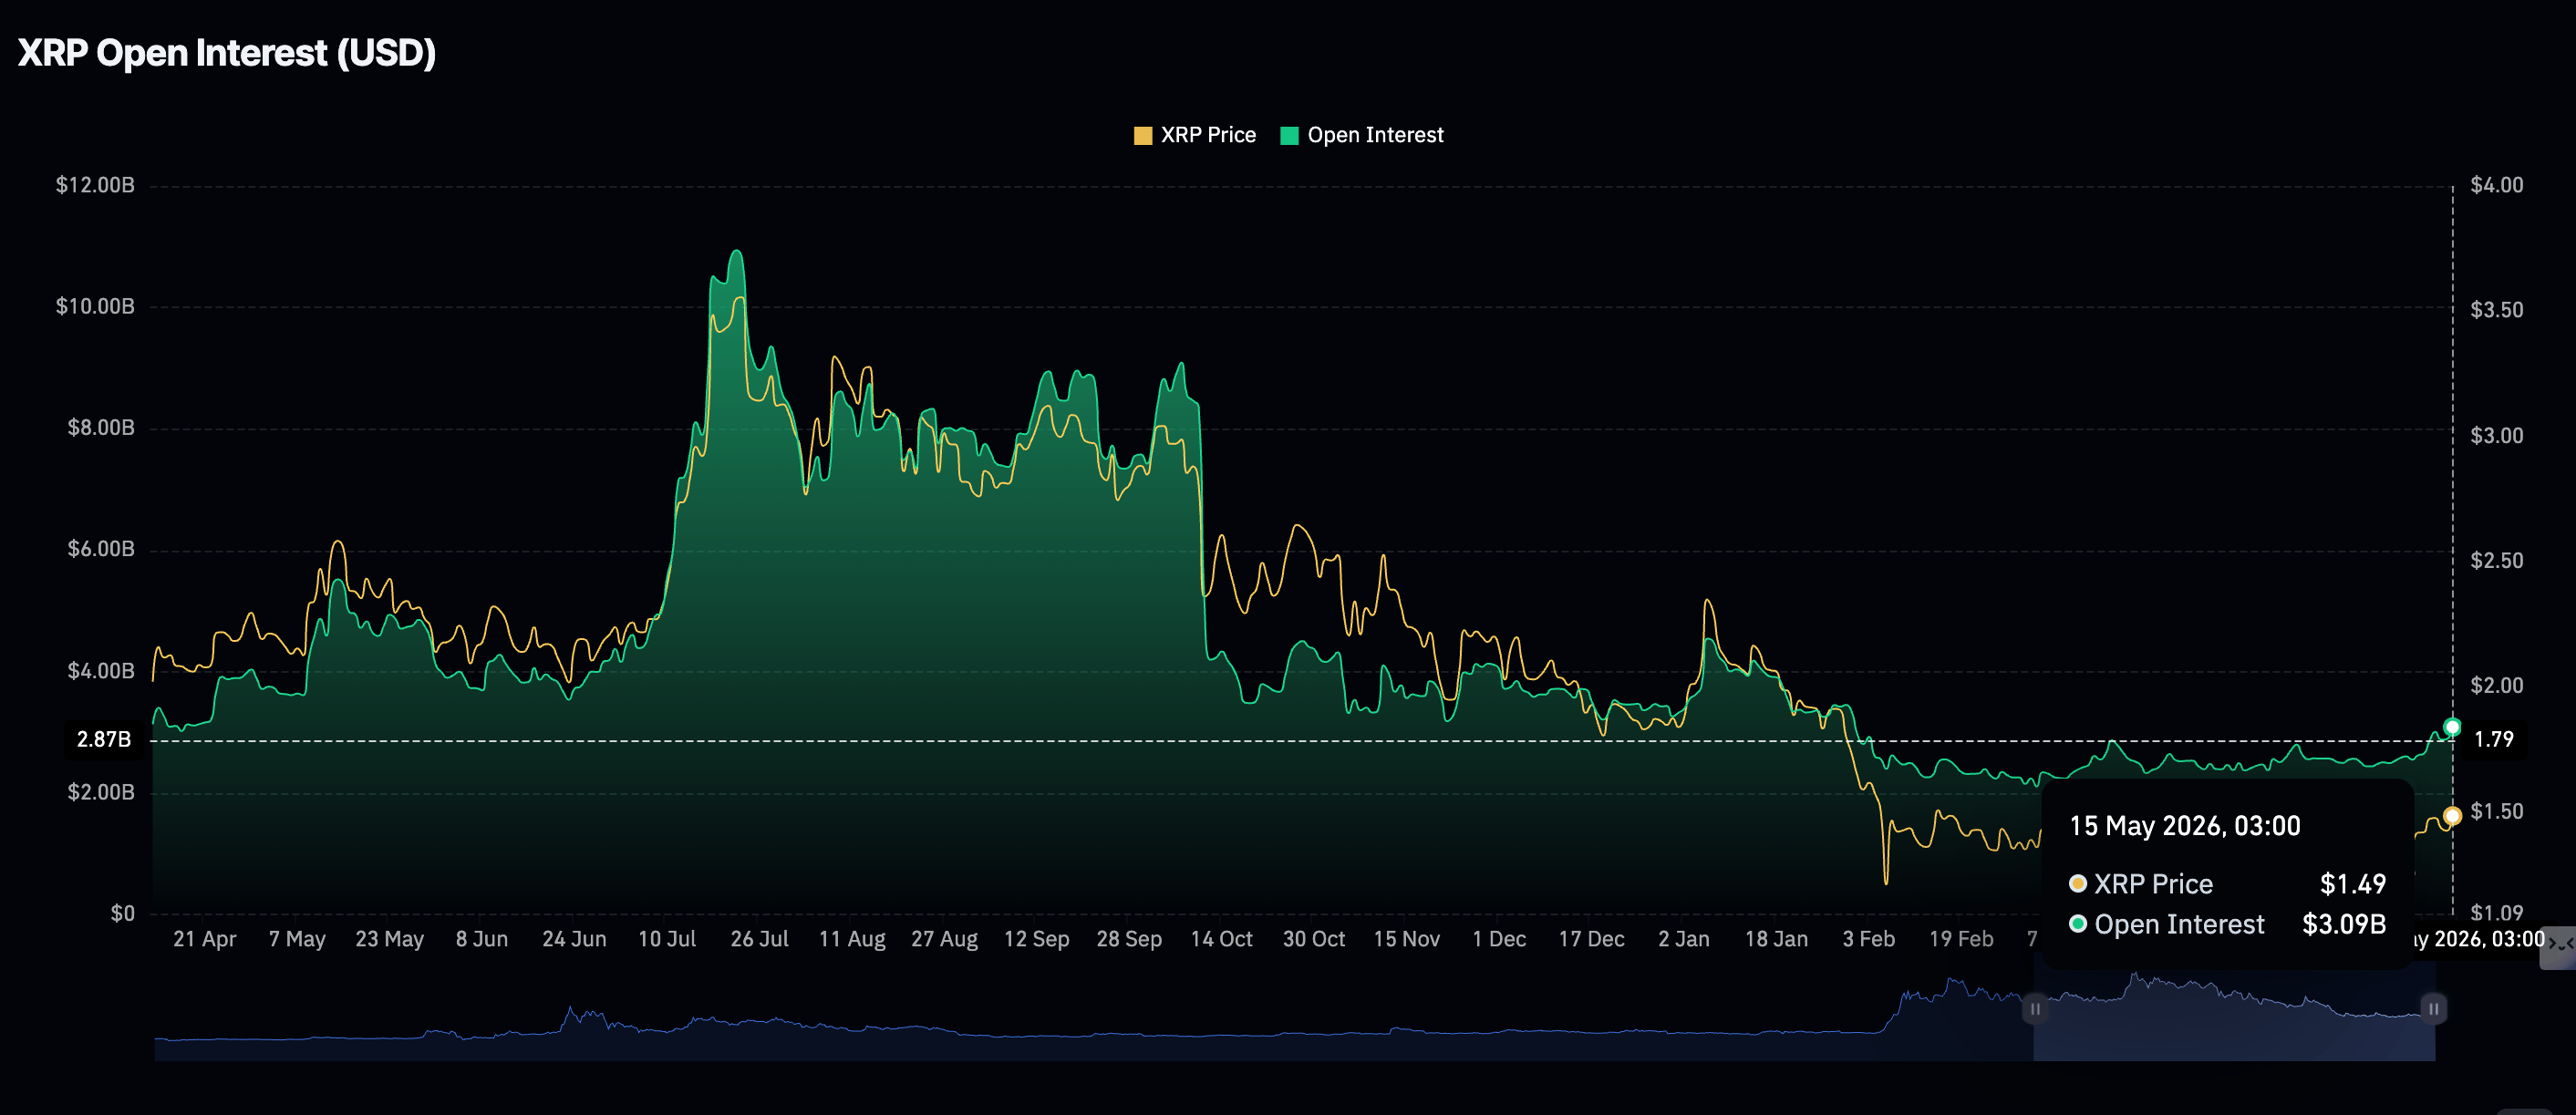
Retail participation in XRP derivatives continues to strengthen, as evidenced by a rise in futures Open Interest (OI) to an average of $3.09 billion on Thursday, up from $2.90 billion the previous day. This uptick in OI mirrors the broader improvement in risk appetite and highlights traders’ strong conviction in XRP’s potential to extend its upward trajectory.
Technical outlook: XRP wobbles as sellers tighten grip
XRP trades at $1.43, holding a neutral to mildly constructive bias as price trades above the 50-day Exponential Moving Average (EMA) at $1.42 while remaining capped beneath the 100-day EMA at $1.49 and the 200-day EMA at $1.70. This configuration suggests an ongoing consolidation within a broader corrective phase.
Momentum is mixed, as the Relative Strength Index (RSI) at 52 on the daily chart and a slightly positive Moving Average Convergence Divergence (MACD) histogram hint at limited directional conviction rather than a sustained impulsive move.
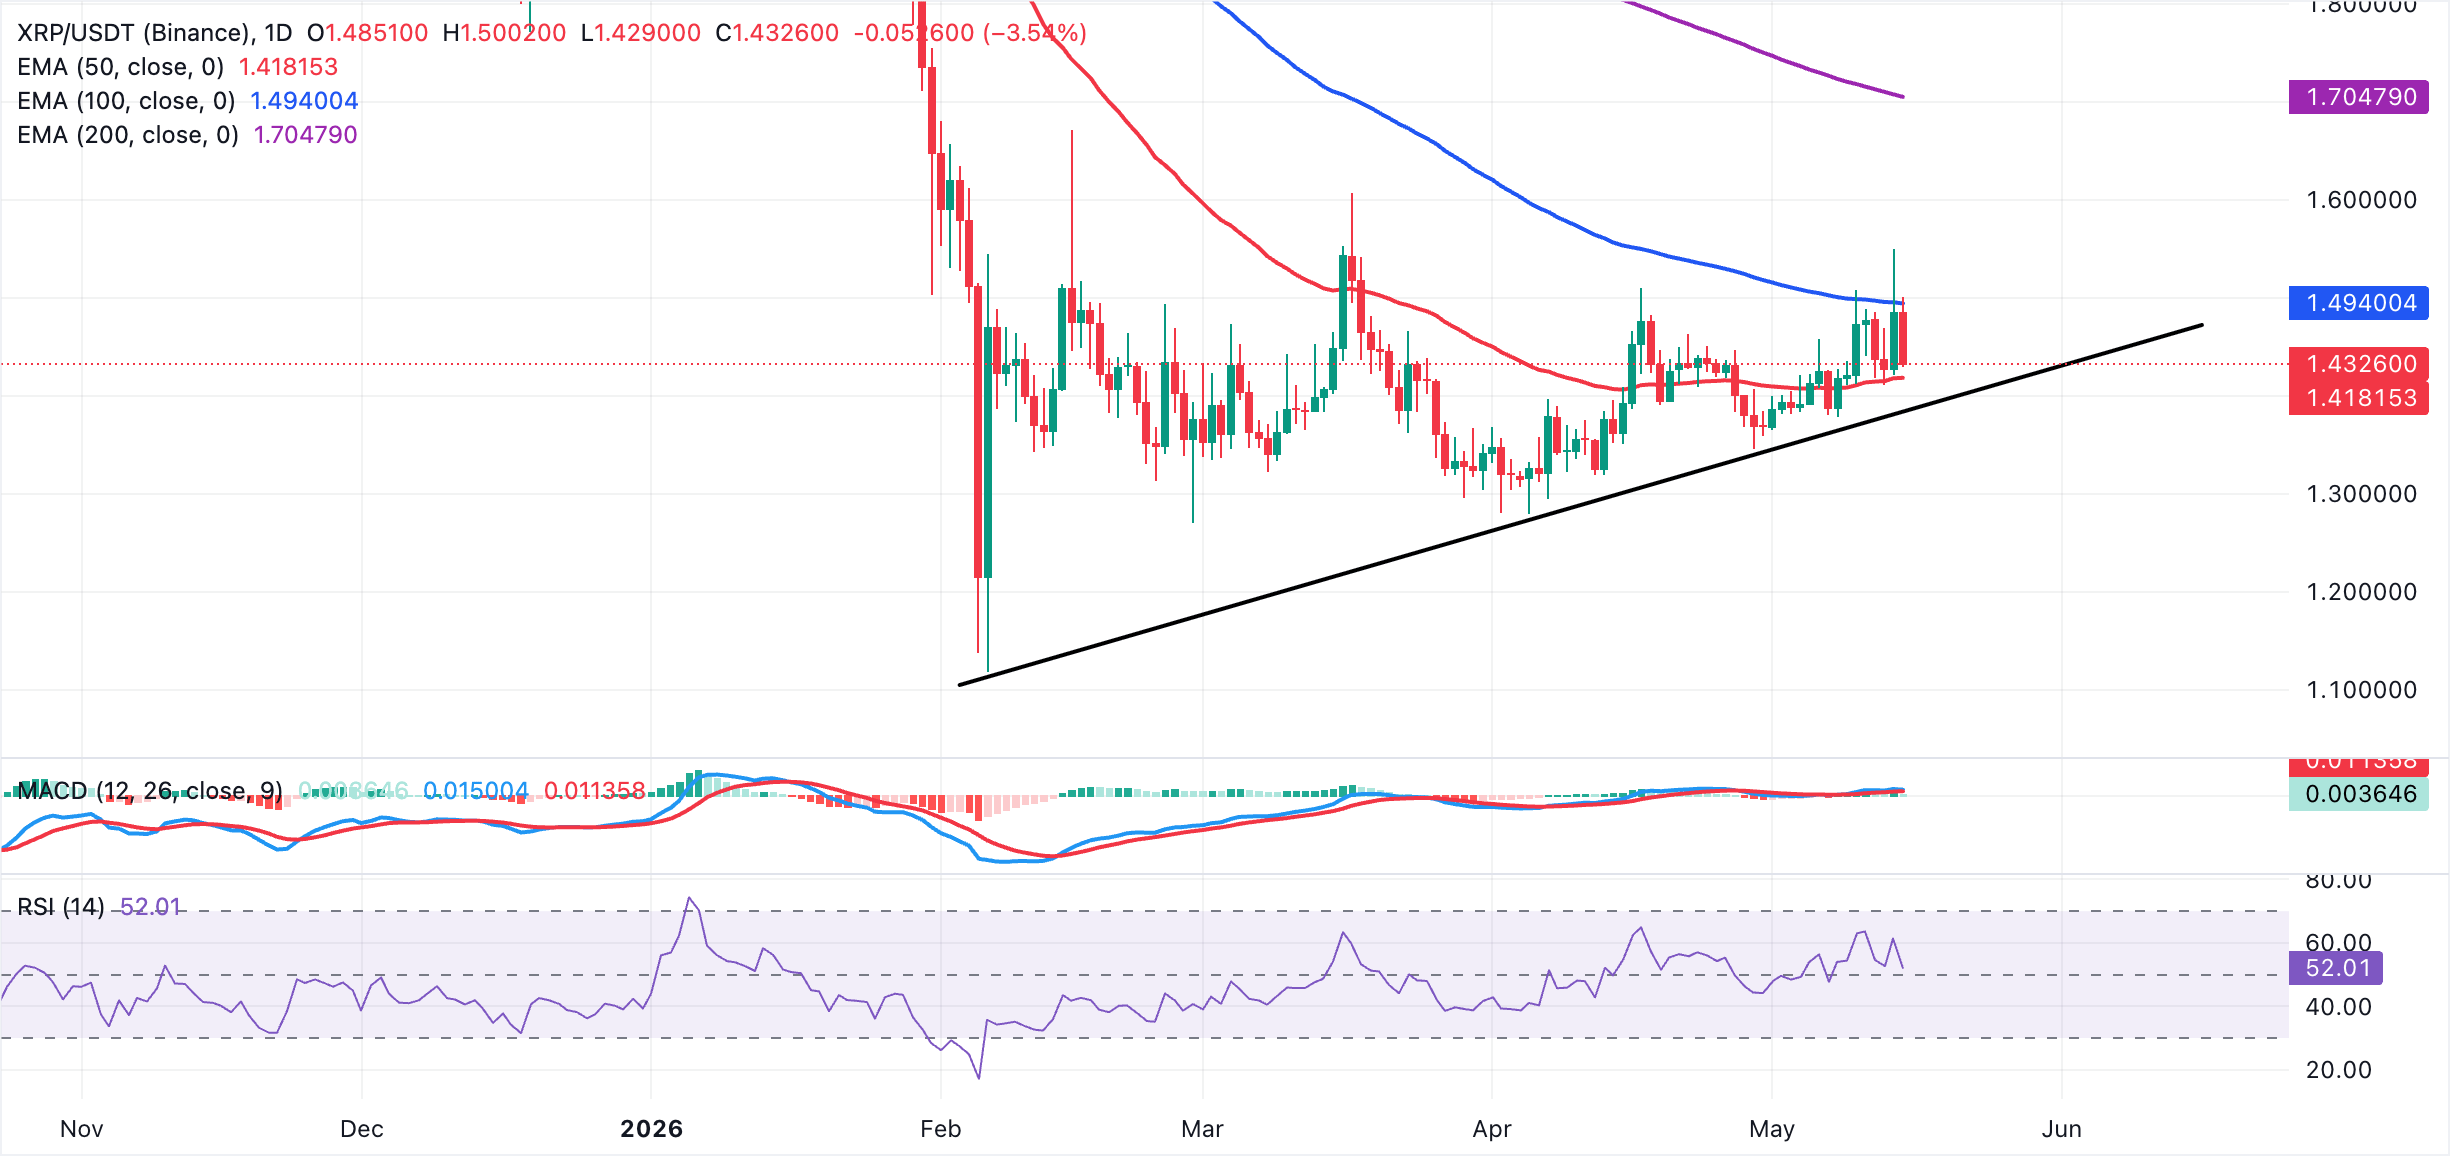
On the downside, immediate support lies at the 50-day EMA around $1.42, with the rising trendline zone near $1.39 serving as a more important floor. A daily close below that area would likely expose deeper losses. On the topside, initial resistance is seen at the 100-day EMA at $1.49, and only a sustained break above this level would open the door toward the more distant 200-day EMA near $1.70, where the broader bearish pressure would be more decisively challenged.
(The technical analysis of this story was written with the help of an AI tool.)
Cryptocurrency metrics FAQs
The developer or creator of each cryptocurrency decides on the total number of tokens that can be minted or issued. Only a certain number of these assets can be minted by mining, staking or other mechanisms. This is defined by the algorithm of the underlying blockchain technology. On the other hand, circulating supply can also be decreased via actions such as burning tokens, or mistakenly sending assets to addresses of other incompatible blockchains.
Market capitalization is the result of multiplying the circulating supply of a certain asset by the asset’s current market value.
Trading volume refers to the total number of tokens for a specific asset that has been transacted or exchanged between buyers and sellers within set trading hours, for example, 24 hours. It is used to gauge market sentiment, this metric combines all volumes on centralized exchanges and decentralized exchanges. Increasing trading volume often denotes the demand for a certain asset as more people are buying and selling the cryptocurrency.
Funding rates are a concept designed to encourage traders to take positions and ensure perpetual contract prices match spot markets. It defines a mechanism by exchanges to ensure that future prices and index prices periodic payments regularly converge. When the funding rate is positive, the price of the perpetual contract is higher than the mark price. This means traders who are bullish and have opened long positions pay traders who are in short positions. On the other hand, a negative funding rate means perpetual prices are below the mark price, and hence traders with short positions pay traders who have opened long positions.
Bài viết đề xuất


