

Ripple Price Forecast: XRP range capped amid lagging retail, institutional demand
- XRP trades within a narrow range, with resistance at $1.54 and support at $1.25.
- XRP’s recovery stalls amid low retail demand, with futures Open Interest holding below $2.40 billion.
- XRP faces reduced investor risk appetite amid prevailing risk-off market sentiment and subdued ETF activity.
Ripple (XRP) is trading above $1.40 at the time of writing on Tuesday amid renewed uncertainty over the war in the Middle East. XRP ended higher on Monday from the weekly open of $1.38, after United States (US) President Donald Trump expressed optimism that talks with Iran are underway.
However, the Strait of Hormuz, a major shipping channel, remains restricted with Iran denying the talks with the US. Moreover, Israel has vowed to keep striking Iran to protect its interests in any ceasefire or deals that may arise.
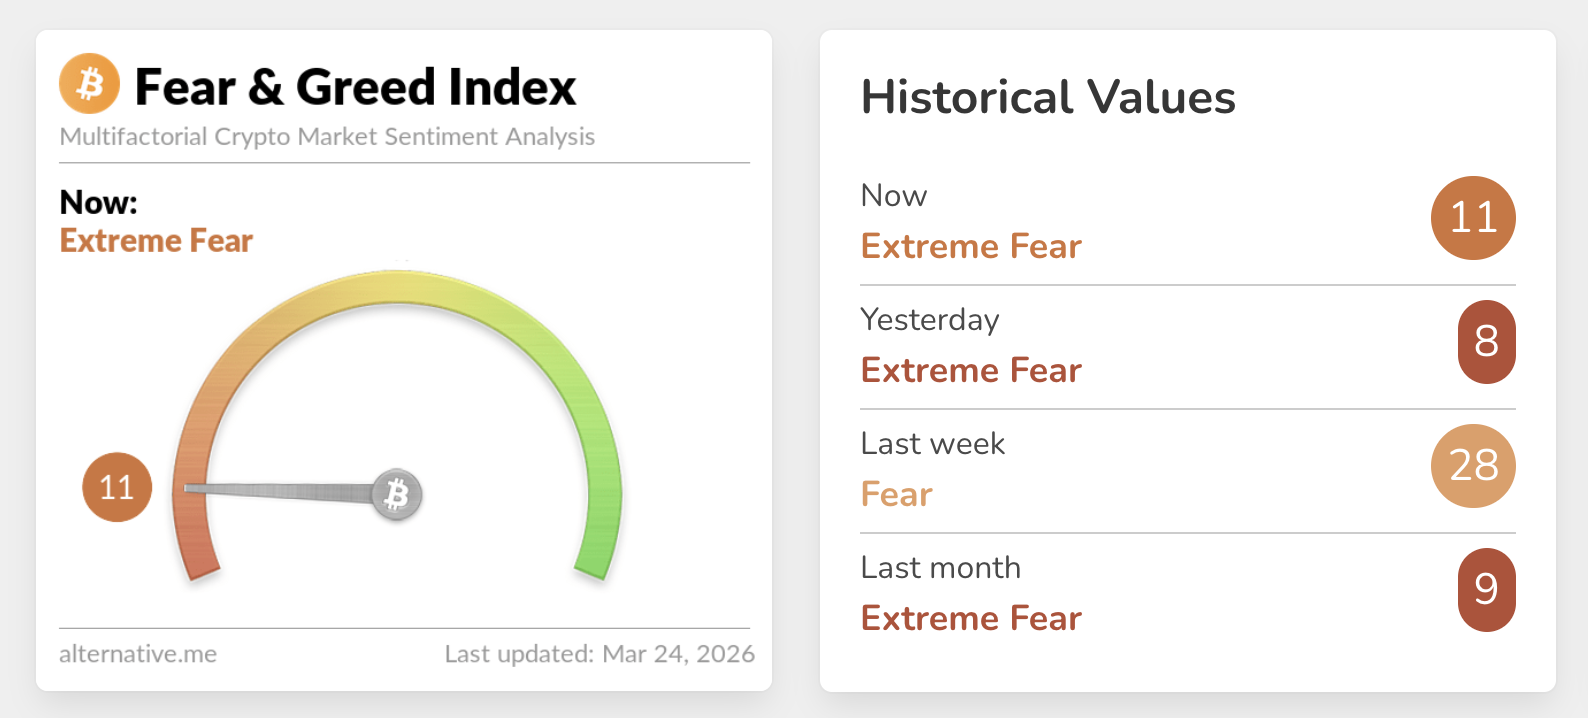
Sentiment across the crypto market remains weak, as reflected by the Fear & Greed Index, which is holding at 11 in extreme fear territory. The index improved marginally amid Trump’s war optimism, but its impact on risk appetite appears to lag.
XRP struggles for direction as retail and institutional demand cools
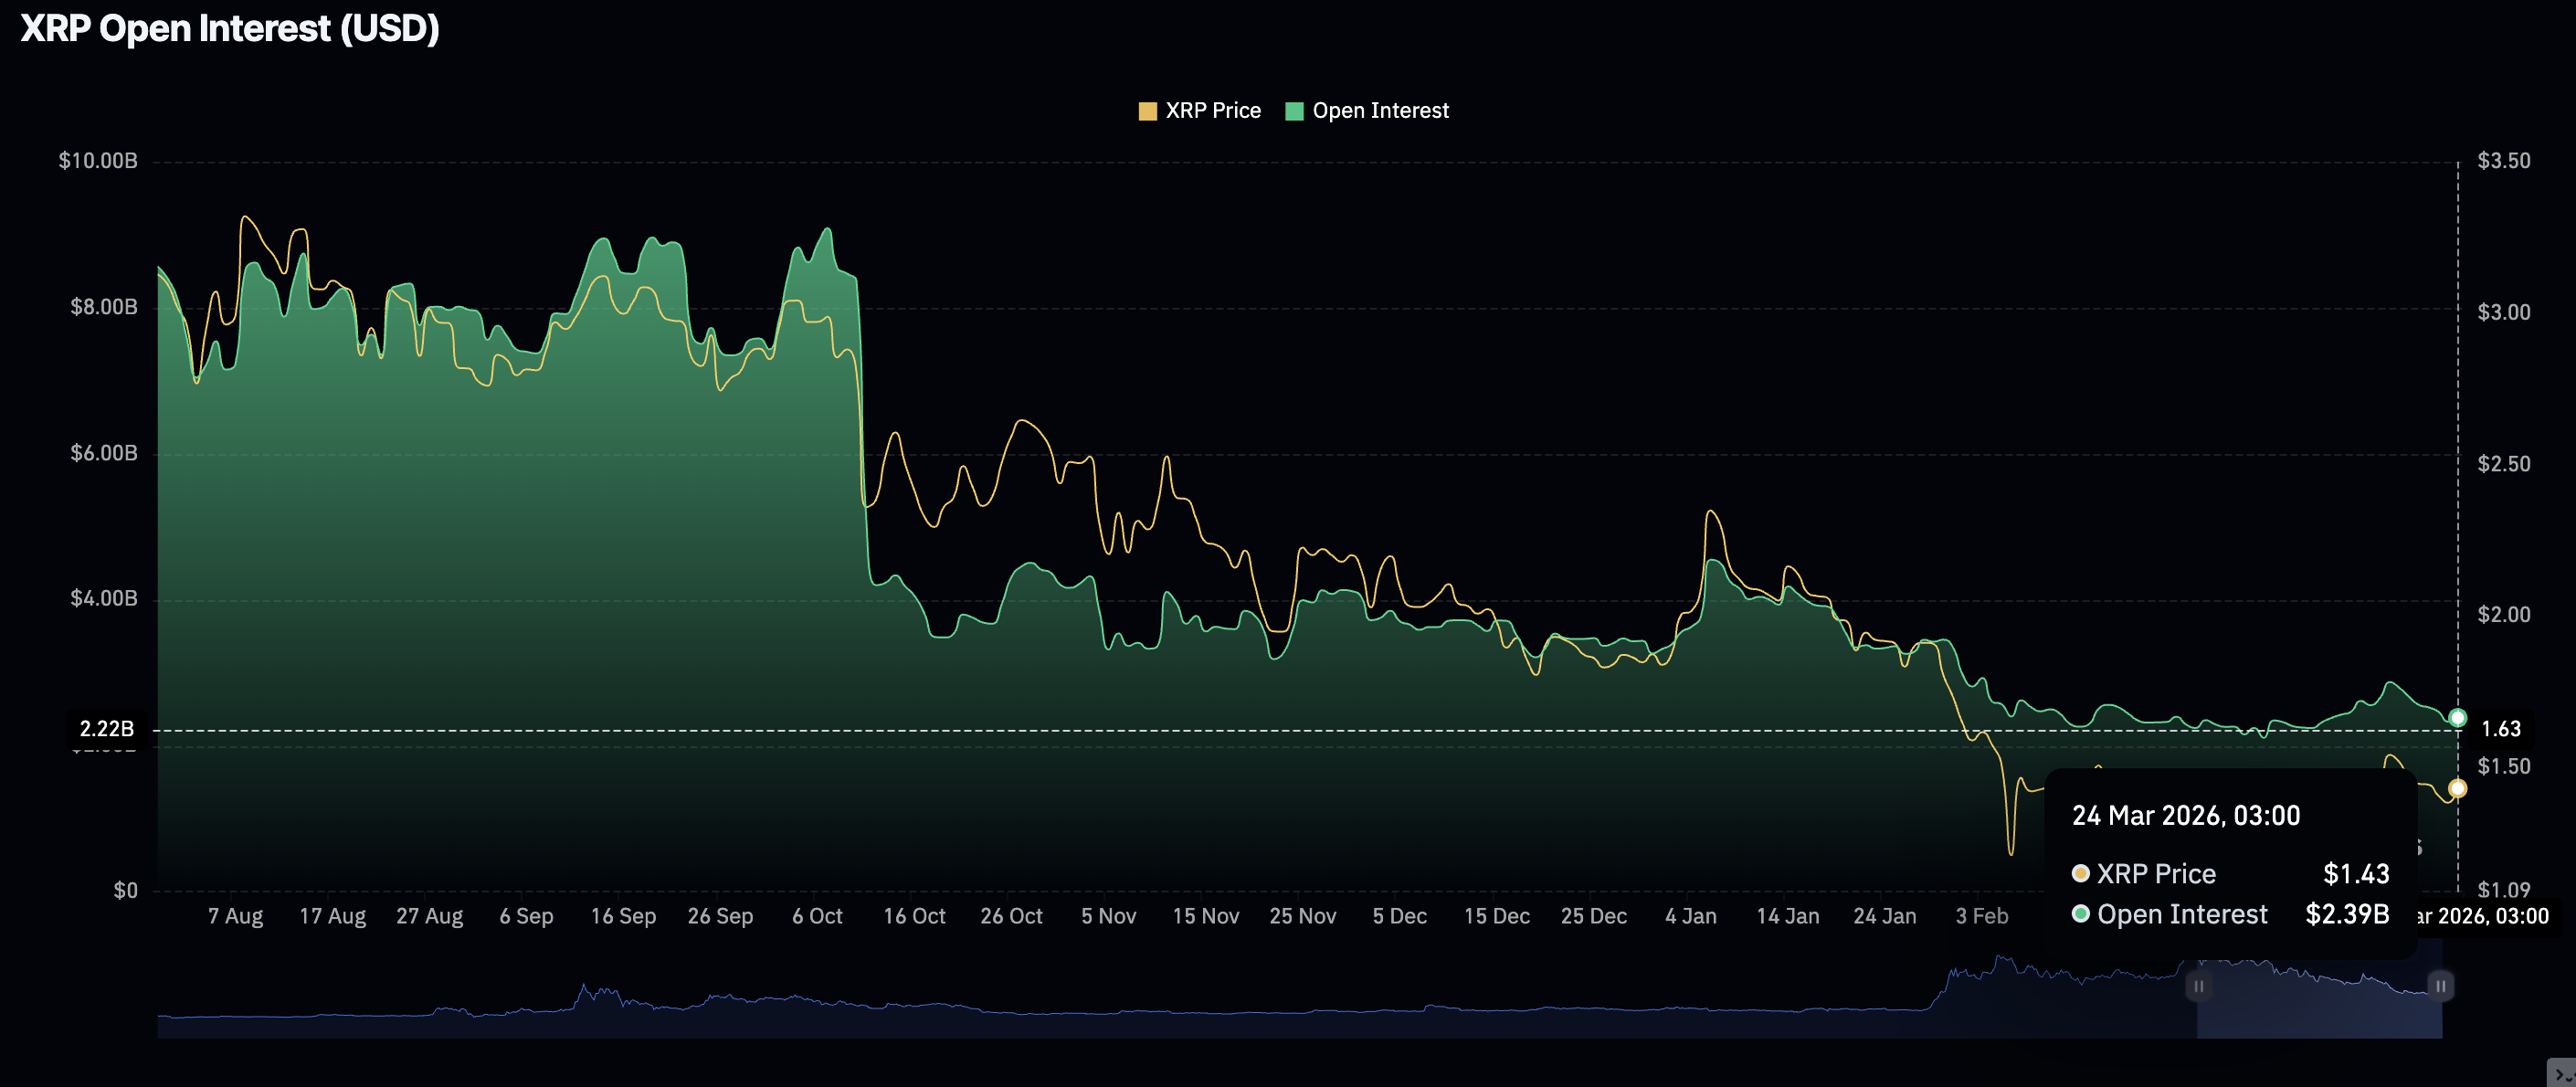
Interest in XRP derivatives has taken a backseat, with futures Open Interest (OI) holding around $2.39 billion on Tuesday and Monday. Looking back, the OI had increased to $2.87 billion on March 17, but faded amid persistent risk-off sentiment.
CoinGlass data also shows that retail interest sits significantly below the record $10.94 billion, a level that coincided with XRP hitting $3.66, its current record high in July. If derivatives demand fails to steadily recover, it would mean an uphill battle for XRP’s recovery.
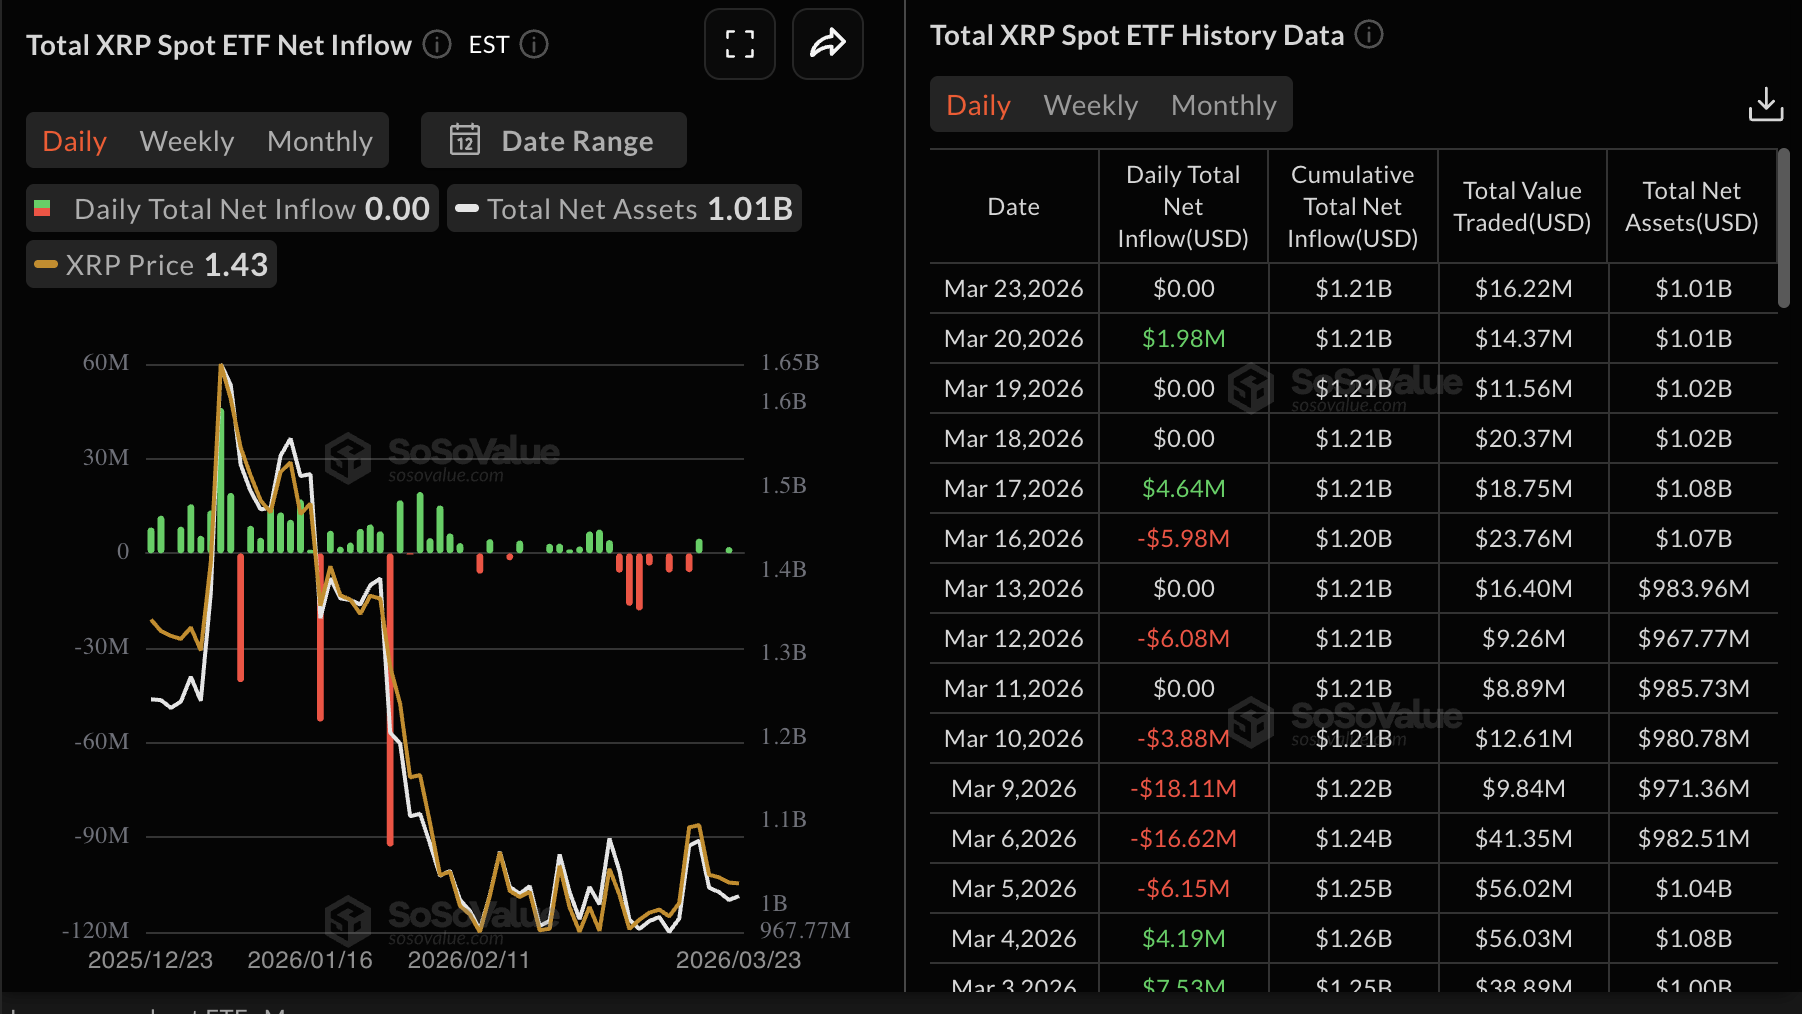
Similarly, demand for XRP spot Exchange-Traded Funds (ETFs) also lagged, with muted activity on Monday. Although XRP recorded inflows of $1.98 million on Friday, the overall sentiment still lags. SoSoValue data shows that there have been only two days of inflows into US-listed ETFs since March 6. Cumulative inflows stand at $1.21 billion, and net assets under management at $1.01 billion.
A CoinShares report on crypto-related capital flows, released on Monday, stated that the Federal Reserve’s (Fed) hawkish stance on interest rate cuts in 2026 continues to weigh on the market, along with uncertainty driven by the Middle East war.
“Digital asset investment products recorded US$230m in inflows last week, marking a notable slowdown compared to prior weeks. While the prevailing view attributes this to the increasingly protracted Iran conflict weighing on sentiment, we believe the more likely cause is the market’s “hawkish pause” interpretation of the US Federal Reserve’s Wednesday meeting,” CoinShare report stated.
Technical outlook: XRP rebound slows amid lagging technicals
XRP hovers above $1.40 amid a broadly bearish outlook, with the price below a long-standing descending trendline. Major moving averages appear to be capping potential rebounds from $1.49. The SuperTrend indicator highlights the dynamic resistance at $1.58, further limiting recovery attempts.
Meanwhile, the Parabolic SAR has flipped below the spot price near $1.36 on the daily chart, tempering downside momentum but not yet establishing a clear uptrend as the Moving Average Convergence Divergence (MACD) indicator fades toward the zero line, pointing to weakening bullish pressure after the recent spike to $1.54.
The Relative Strength Index (RSI) stabilizes at the high 40s, reinforcing a neutral outlook rather than a decisive uptrend. XRP could remain vulnerable to selling pressure if the RSI remains below the 50 midline.
-1774354191204-1774354191206.png)
Initial resistance lies at the 50-day Exponential Moving Average (EMA) around $1.49, followed by the recent swing high near $1.54. A break above these levels is required to reopen the path toward the 100-day EMA at $1.67 and later the 200-day EMA at $1.92.
On the downside, immediate support is seen in the $1.38–$1.40 zone, which guards the Parabolic SAR at $1.36. Failure to hold above this supply area could trigger an extended decline toward the lower end of the range at $1.25.
Crypto ETF FAQs
An Exchange-Traded Fund (ETF) is an investment vehicle or an index that tracks the price of an underlying asset. ETFs can not only track a single asset, but a group of assets and sectors. For example, a Bitcoin ETF tracks Bitcoin’s price. ETF is a tool used by investors to gain exposure to a certain asset.
Yes. The first Bitcoin futures ETF in the US was approved by the US Securities & Exchange Commission in October 2021. A total of seven Bitcoin futures ETFs have been approved, with more than 20 still waiting for the regulator’s permission. The SEC says that the cryptocurrency industry is new and subject to manipulation, which is why it has been delaying crypto-related futures ETFs for the last few years.
Yes. The SEC approved in January 2024 the listing and trading of several Bitcoin spot Exchange-Traded Funds, opening the door to institutional capital and mainstream investors to trade the main crypto currency. The decision was hailed by the industry as a game changer.
The main advantage of crypto ETFs is the possibility of gaining exposure to a cryptocurrency without ownership, reducing the risk and cost of holding the asset. Other pros are a lower learning curve and higher security for investors since ETFs take charge of securing the underlying asset holdings. As for the main drawbacks, the main one is that as an investor you can’t have direct ownership of the asset, or, as they say in crypto, “not your keys, not your coins.” Other disadvantages are higher costs associated with holding crypto since ETFs charge fees for active management. Finally, even though investing in ETFs reduces the risk of holding an asset, price swings in the underlying cryptocurrency are likely to be reflected in the investment vehicle too.
(The technical analysis of this story was written with the help of an AI tool.)
Bài viết đề xuất


