

Crypto Today: Bitcoin, Ethereum, XRP recovery at risk as Iran denies any dialogue with the US
- Bitcoin remains above $70,000, but upside potential appears limited amid renewed uncertainty over war in the Middle East.
- Ethereum’s rebound encounters 50-day EMA resistance as ETF outflows extend.
- XRP holds support above $1.40, but further gains seem limited amid subdued retail participation.
The cryptocurrency market remains on edge on Tuesday, following a sharp recovery the previous day. Bitcoin (BTC) is holding above $70,000, Ethereum (ETH) above $2,100, and Ripple (XRP) above $1.40. Despite the subtle gains, further recovery appears limited amid concerns about the war in the Middle East.
Iran denies talks with the US, putting Bitcoin’s recovery at risk
The Middle East war continues to take center stage with Iran refuting claims made by United States (US) President Donald Trump that the two nations are engaging in talks.
Trump said that talks with Iran are “very good and productive” and will continue amid a five-day pause on planned strikes on Iranian power plants and energy infrastructure.
“As talks continue this week, I’ve ordered a five-day pause on any military strikes against Iranian energy infrastructure, contingent on progress,” the US President said on Monday.
Following Trump’s optimism for a deal with Iran on opening the Strait of Hormuz, a shipping channel used to move at least 20% of the world’s Oil supplies, pressure eased in global markets.
WTI Crude Oil prices, which briefly fell sharply to $84, have returned above $90, reflecting renewed uncertainty over the direction of the war. Bitcoin is holding above $70,000, but its upside potential appears limited after Iran denied that it is in dialogue with the US. Moreover, Israel intends to continue strikes on Iran and Lebanon, saying that it needs to protect its interests in any potential ceasefire or peace deal.
Ethereum, XRP under pressure as institutional and retail demand cools
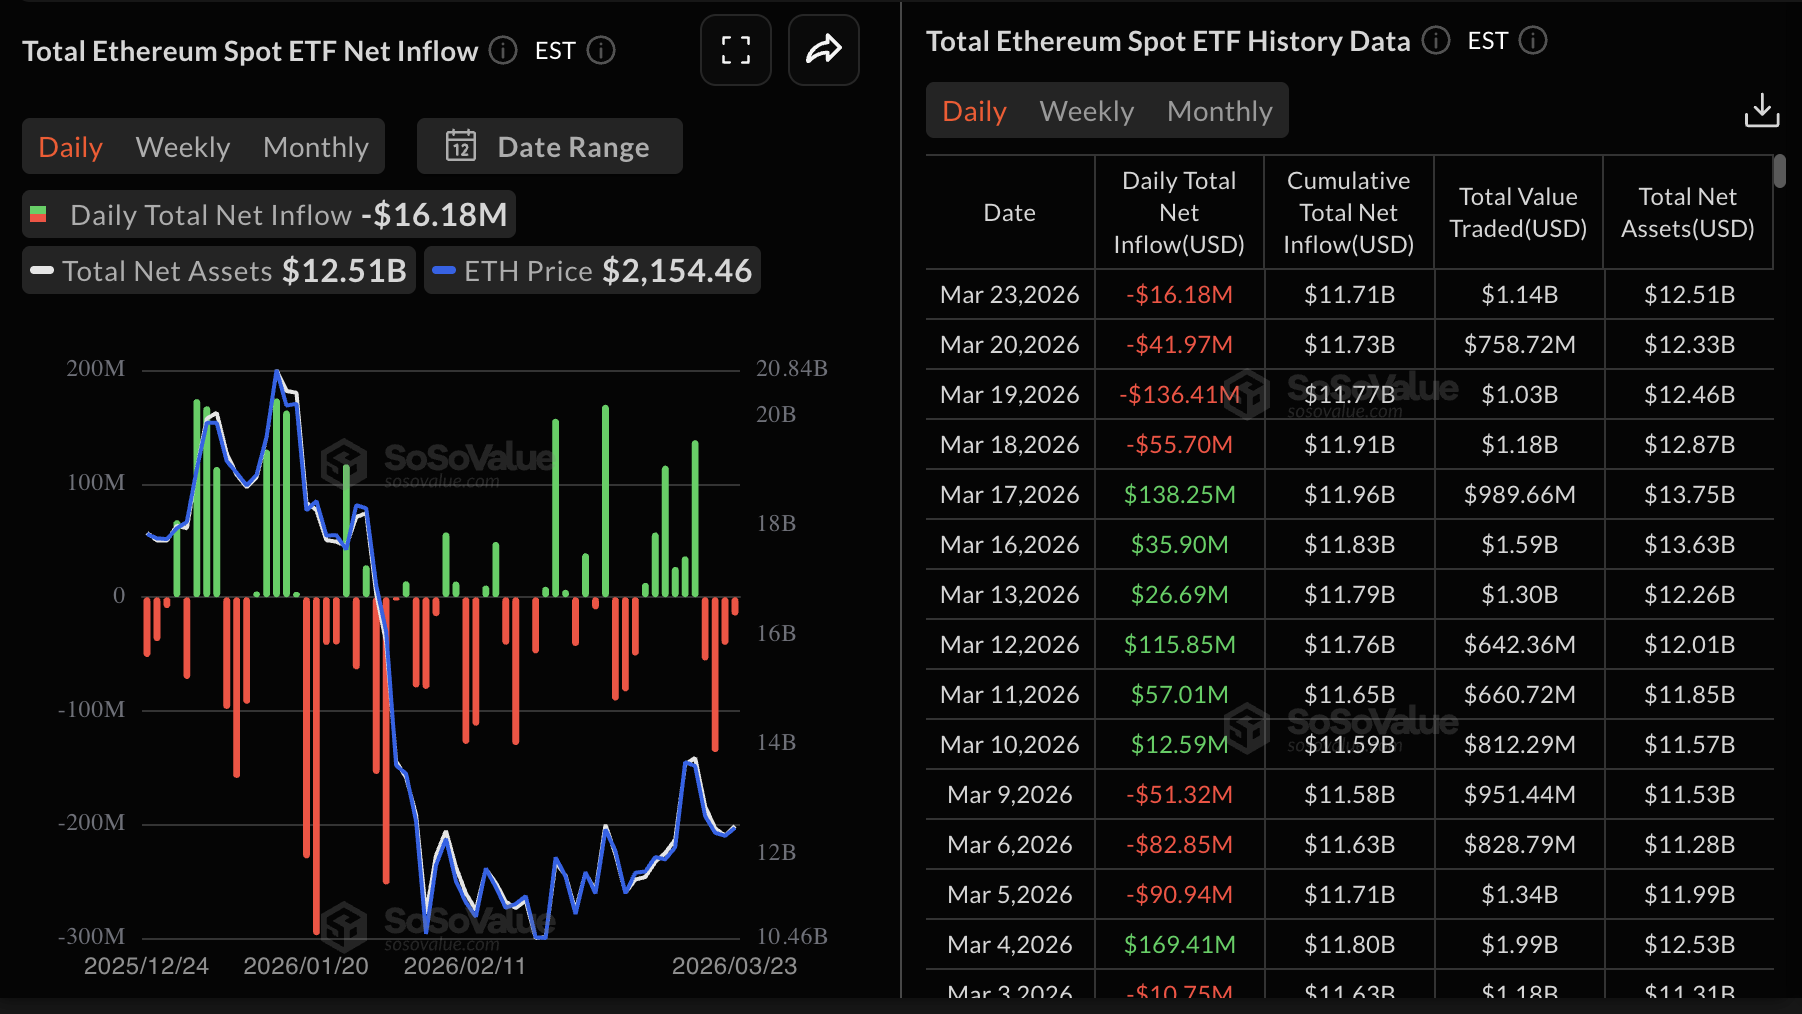
Ethereum continues to face a persistent capital exit from spot Exchange Traded Funds (ETFs). US-listed ETFs saw approximately $16 million in outflows on Monday, extending the negative streak for the fourth consecutive day. SoSoValue data shows net assets under management averaging $12.51 billion while cumulative inflows stand at $11.71 billion. The outflow streak suggests that risk appetite for Ethereum investment products remains low, which may cap sustained recovery in the short- to medium-term.
Retail interest in XRP remains on the back foot, as seen in futures Open Interest (OI), which holds at $2.39 billion on Tuesday. Looking back, the XRP futures OI averaged $10.94 billion in July, coinciding with the $3.66 record high. This massive gap suggests that investors lack confidence in XRP’s ability to sustain rallies, which could explain the need to reduce exposure.
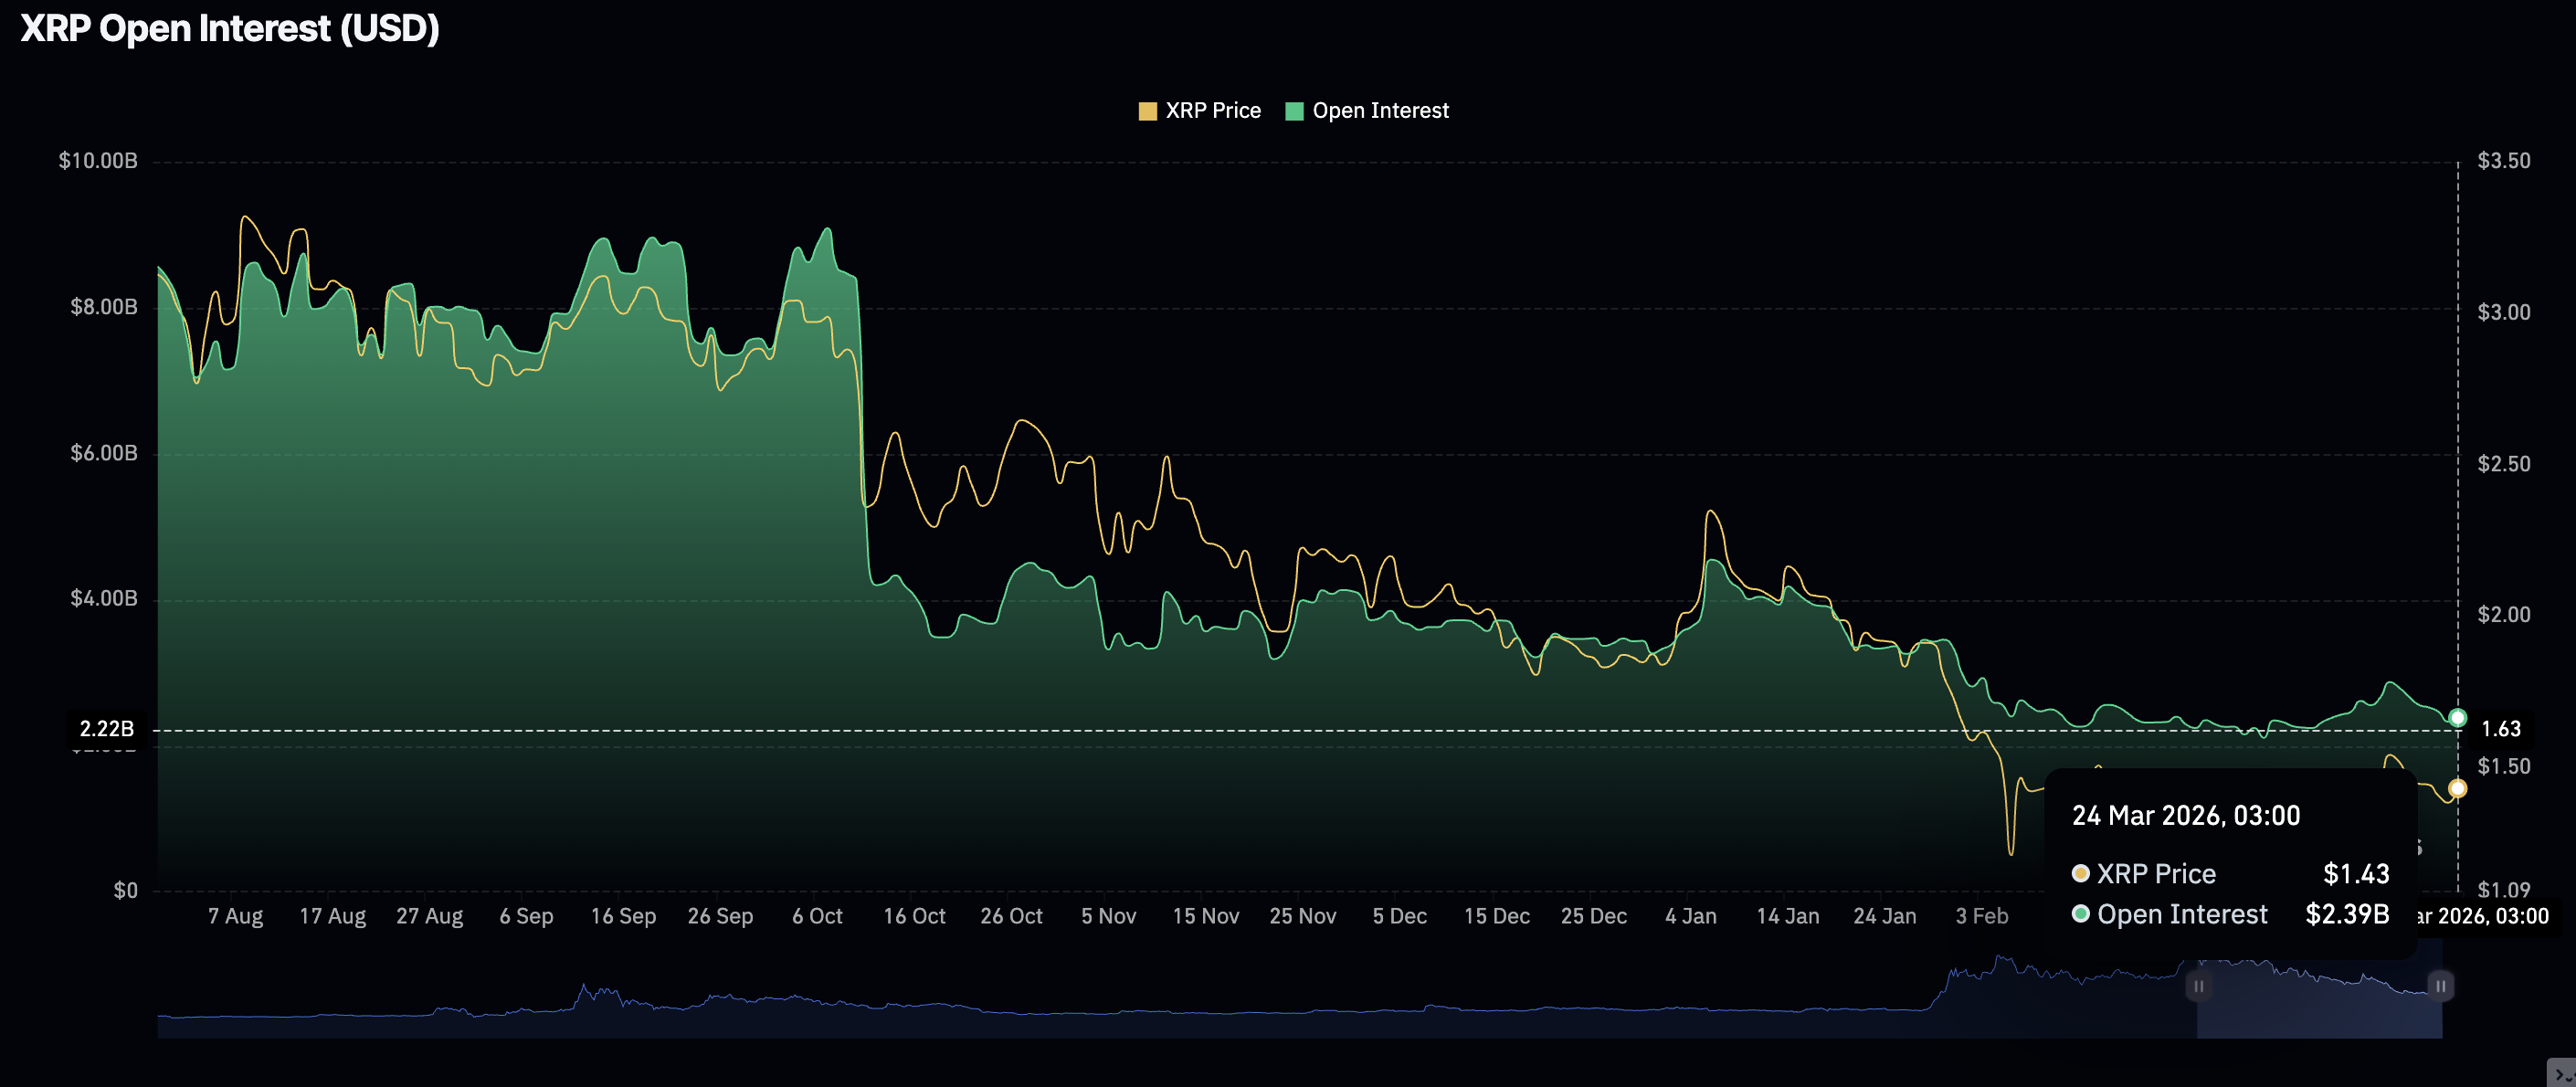
Chart of the day: Bitcoin holds key support
Bitcoin trades above $70,000, rising from the weekly open at $67,859. Its near-term bias remains neutral, with a bearish tilt, as price holds below the 50-day, 100-day, and 200-day Exponential Moving Averages (EMAs), keeping the broader trend downward.
The Moving Average Convergence Divergence (MACD) indicator hovers below the signal line on the daily chart, but has retreated toward the zero mark, indicating moderate upside momentum rather than a strong rally.
Immediate support lies near $70,000, aligning with the recent swing lows and sitting above the weekly open at $67,859. A sustained break below $67,859 would expose Bitcoin to the SuperTrend indicator's dynamic support at $66,188.
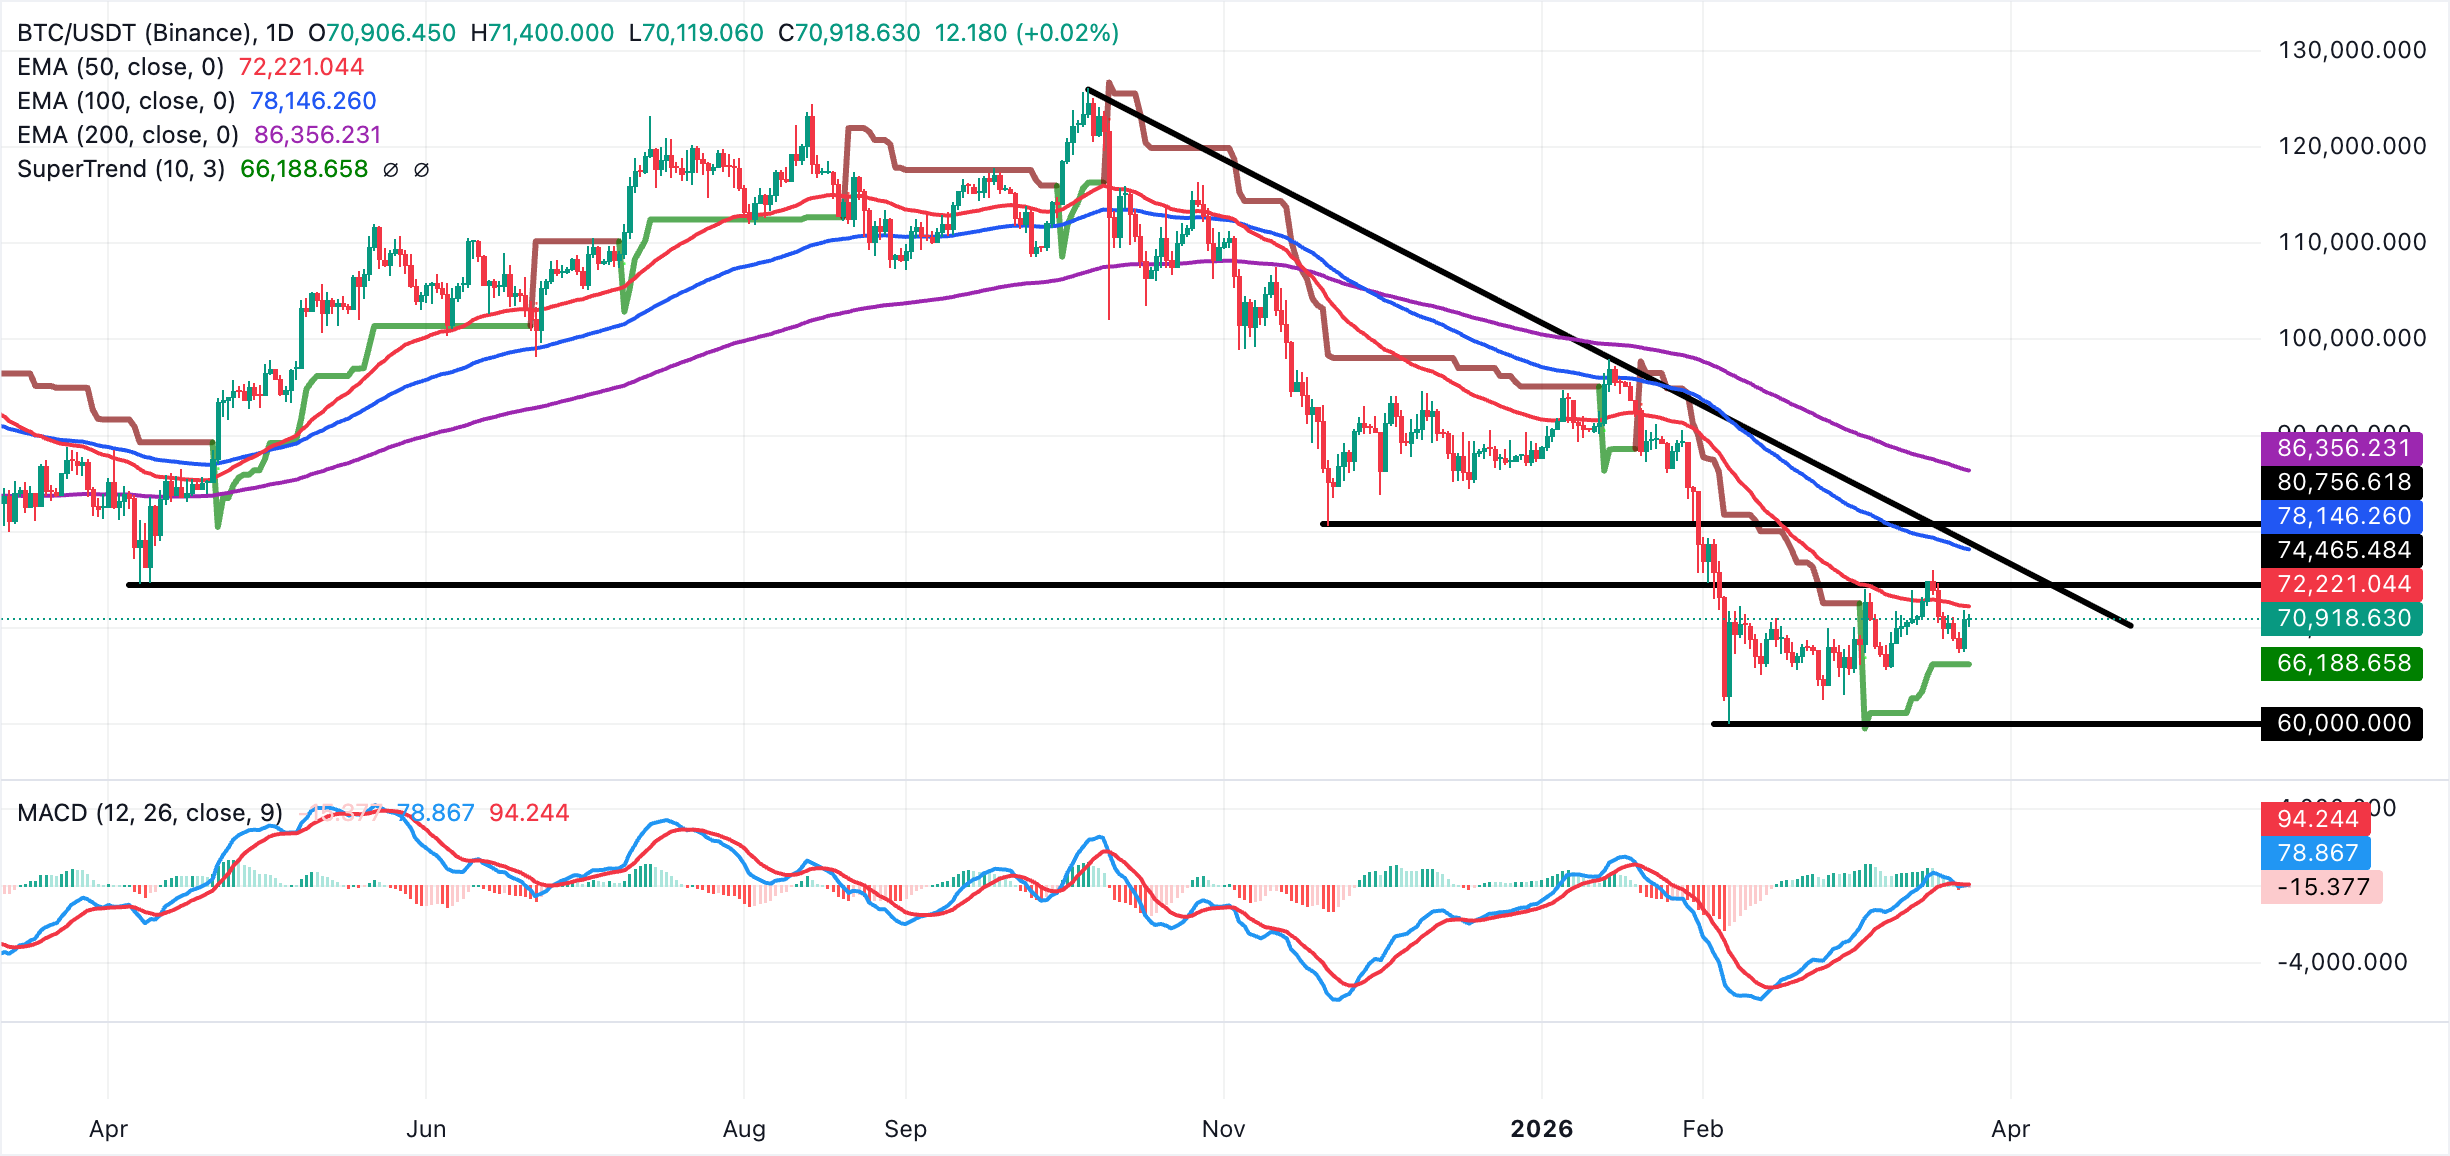
On the upside, initial resistance lies at $72,221, the 50-day EMA, followed by a horizontal supply zone roughly at $74,465 and the March high at $76,000. A decisive break above that hurdle would reopen the path toward the $78,000 region, which lies just below the 100-day EMA.
Altcoins technical outlook: Ethereum steadies, XRP struggles
Ethereum is holding above $2,100 amid a neutral near-term bias. The SuperTrend indicator's buy signal and dynamic support at $1,981 aligns with a potential bullish turnaround. Still, daily candles remain below the 50-day, 100-day, and 200-day EMAs, clustered between roughly $2,197 and $2,786, suggesting the dominant trend remains corrective even as downside momentum fades.
Meanwhile, the MACD indicator is holding marginally above the signal line on the daily chart, suggesting only modest bullish momentum rather than a decisive trend resumption.
Initial resistance lies at the 50-day EMA near $2,200, followed by the previous week's high at $2,386 and the 100-day EMA at $2,465. On the downside, immediate support sits at the weekly open of $2,054, and the SuperTrend baseline is around $1,981. A drop through this demand exposes deeper support toward $1,900.
-1774347017498-1774347017503.png)
XRP is trading above $1.42, down from the daily high of $1.44. The remittance token aligns with a broader bearish trend, with the price capped well below the descending trendline resistance. Similarly, the 50-day, 100-day and 200-day EMAs, clustered between $1.49 and $1.92, appear to be limiting XRP's recovery potential
The MACD holds marginally above the signal line on the daily chart and is near the zero mark, while histogram bars contract, suggesting fading bullish momentum, which may keep risks skewed toward renewed downside rather than a sustained recovery.
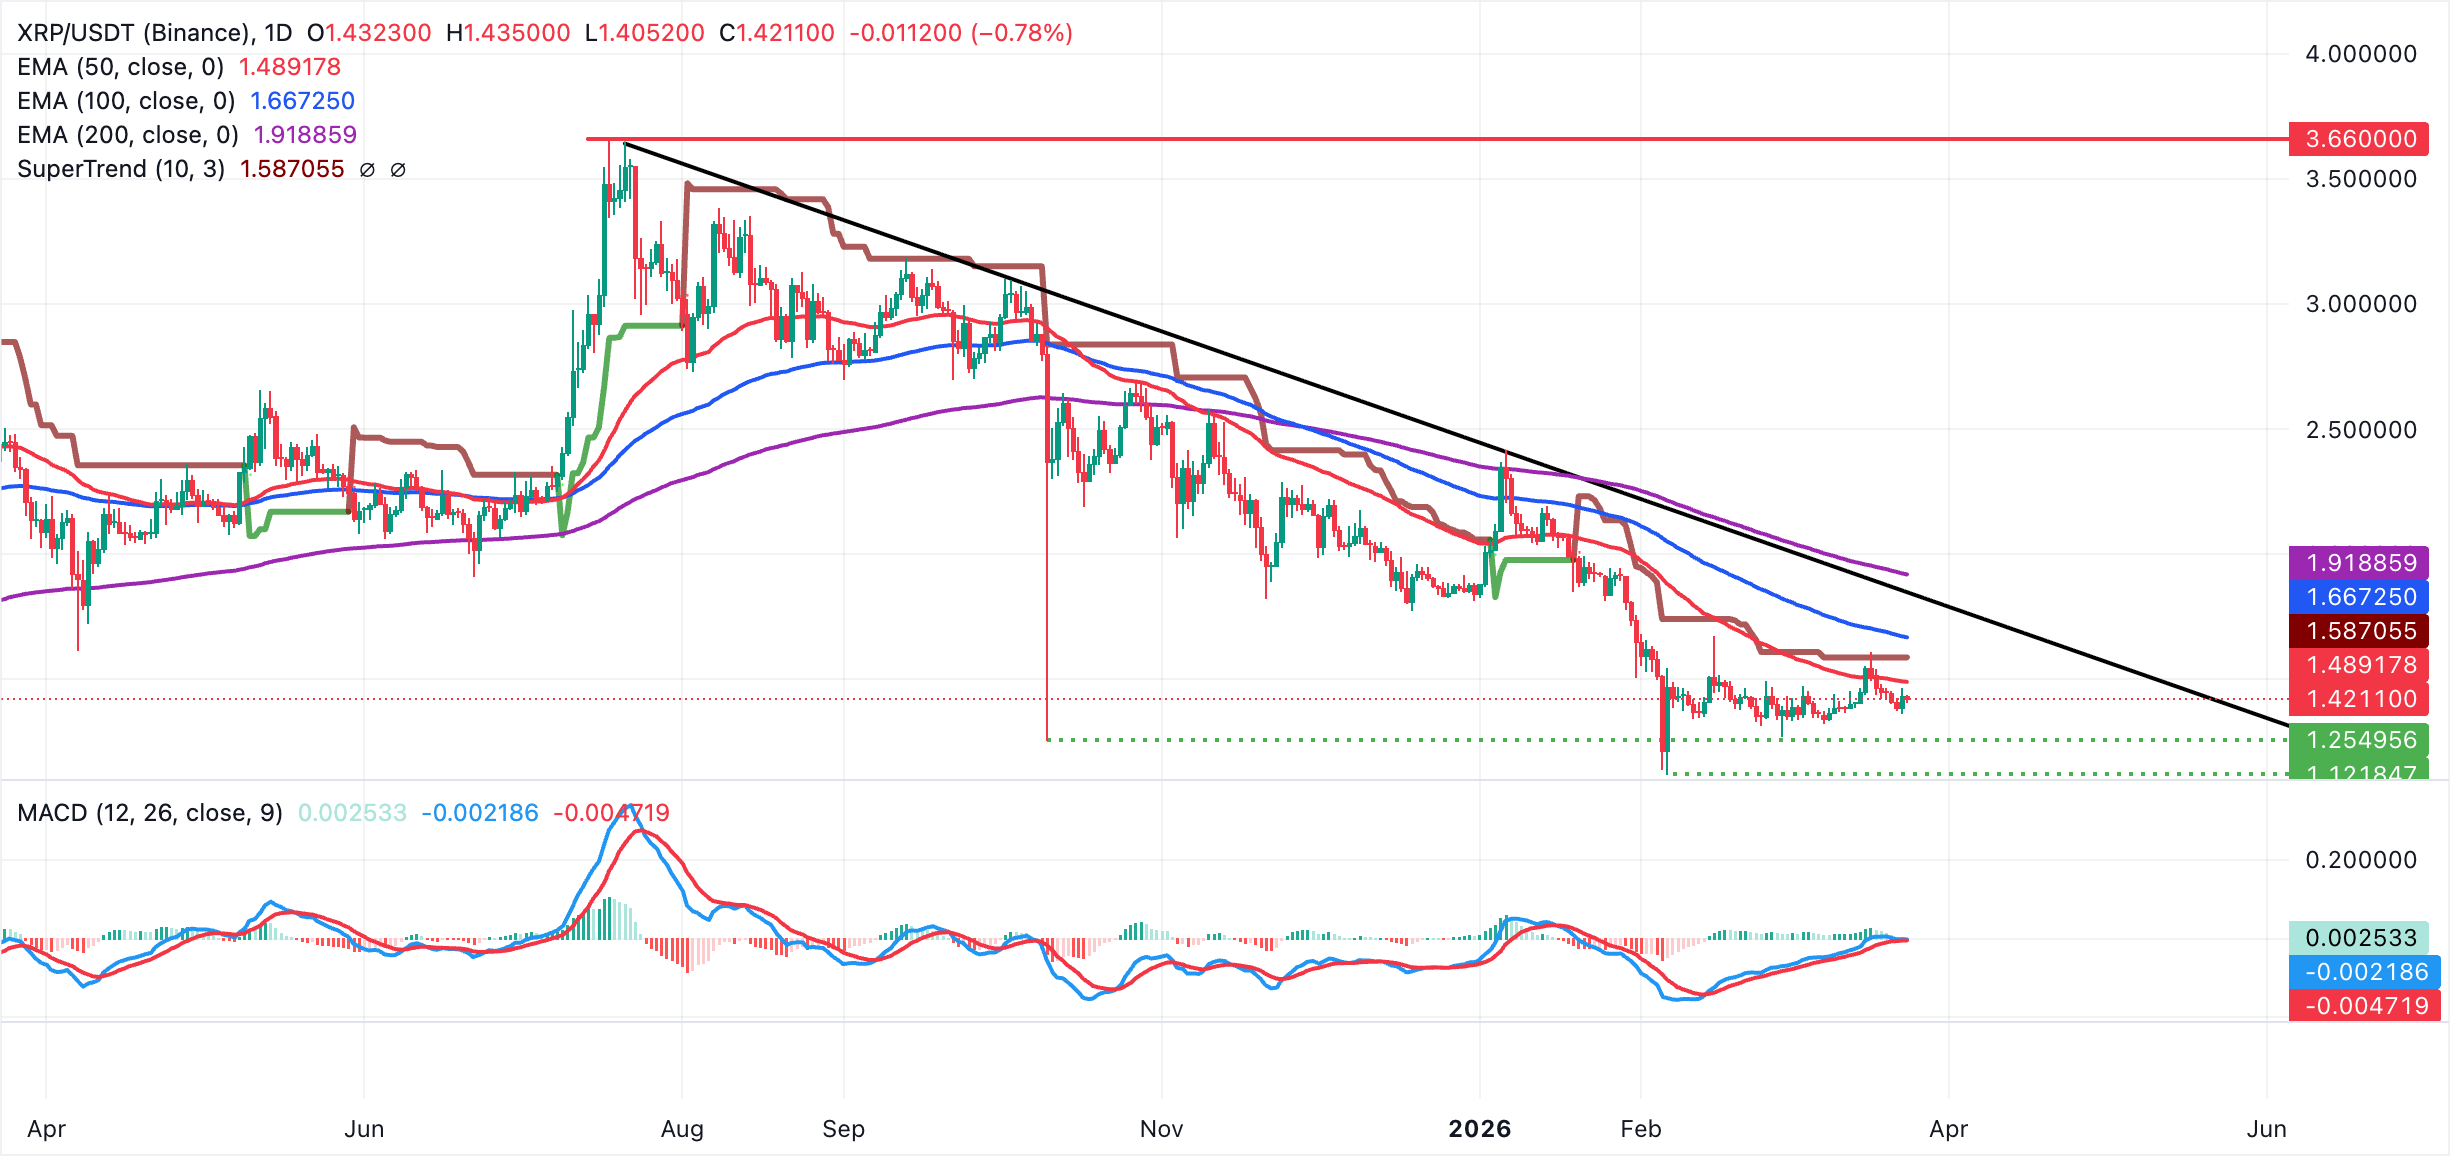
Meanwhile, initial resistance emerges around the 50-day EMA at $1.49, followed by the 100-day EMA at $1.67 and then the 200-day EMA around $1.92, where the longer-term moving average strengthens the cap on advances. On the downside, immediate support sits at the pivotal $1.40 area, where a break would expose the weekly open at $1.38 and Monday's low at $1.36.
Crypto ETF FAQs
An Exchange-Traded Fund (ETF) is an investment vehicle or an index that tracks the price of an underlying asset. ETFs can not only track a single asset, but a group of assets and sectors. For example, a Bitcoin ETF tracks Bitcoin’s price. ETF is a tool used by investors to gain exposure to a certain asset.
Yes. The first Bitcoin futures ETF in the US was approved by the US Securities & Exchange Commission in October 2021. A total of seven Bitcoin futures ETFs have been approved, with more than 20 still waiting for the regulator’s permission. The SEC says that the cryptocurrency industry is new and subject to manipulation, which is why it has been delaying crypto-related futures ETFs for the last few years.
Yes. The SEC approved in January 2024 the listing and trading of several Bitcoin spot Exchange-Traded Funds, opening the door to institutional capital and mainstream investors to trade the main crypto currency. The decision was hailed by the industry as a game changer.
The main advantage of crypto ETFs is the possibility of gaining exposure to a cryptocurrency without ownership, reducing the risk and cost of holding the asset. Other pros are a lower learning curve and higher security for investors since ETFs take charge of securing the underlying asset holdings. As for the main drawbacks, the main one is that as an investor you can’t have direct ownership of the asset, or, as they say in crypto, “not your keys, not your coins.” Other disadvantages are higher costs associated with holding crypto since ETFs charge fees for active management. Finally, even though investing in ETFs reduces the risk of holding an asset, price swings in the underlying cryptocurrency are likely to be reflected in the investment vehicle too.
(The technical analysis of this story was written with the help of an AI tool.)
Bài viết đề xuất


