


Top Crypto Losers: Zcash, Stacks, BNB drop further as Bitcoin weakens
- Zcash hovers close to $250 on Thursday after an eight-day decline of 35%.
- Stacks steadies above $0.28 following a 10% decline on Wednesday.
- BNB falls below $700 after losing more than 7% the previous day.
Zcash (ZEC), Stacks (STX), and BNB (formerly Binance Coin) are among the biggest losers over the last 24 hours as Bitcoin (BTC) approaches $72,000 on Thursday. The correction is driven by multiple factors, including massive, steady outflows from institutions and large-wallet investors, broader-market risk-off sentiment, and the delay in the Digital Asset Clarity Act. Technically, the downside risk persists for Zcash, Stacks, and BNB amid intense bearish momentum.
Bitcoin risks further loss toward $70,000
Bitcoin trades near $72,000, with a more than 1% loss at press time on Thursday, extending the decline for the third consecutive day. The major crypto is far below the 50- and 200-day Exponential Moving Averages (EMAs), which are sloping lower in a bearish configuration.
The declining trend in Bitcoin reflects a downside extension of a bearish flag pattern breakout, approaching the 61.8% trend-based Fibonacci extension level at $69,743, measured between the October 6 high of $126,199 and the November 21 low at $80,600, with a third higher leg at the January 15 high of $97,924.
The Moving Average Convergence Divergence (MACD) and signal line extend into negative territory as the MACD histogram widens, indicating strengthening downward momentum.
The Relative Strength Index (RSI) at 22 indicates an oversold condition, suggesting a potential rebound that would encounter overhead supply.
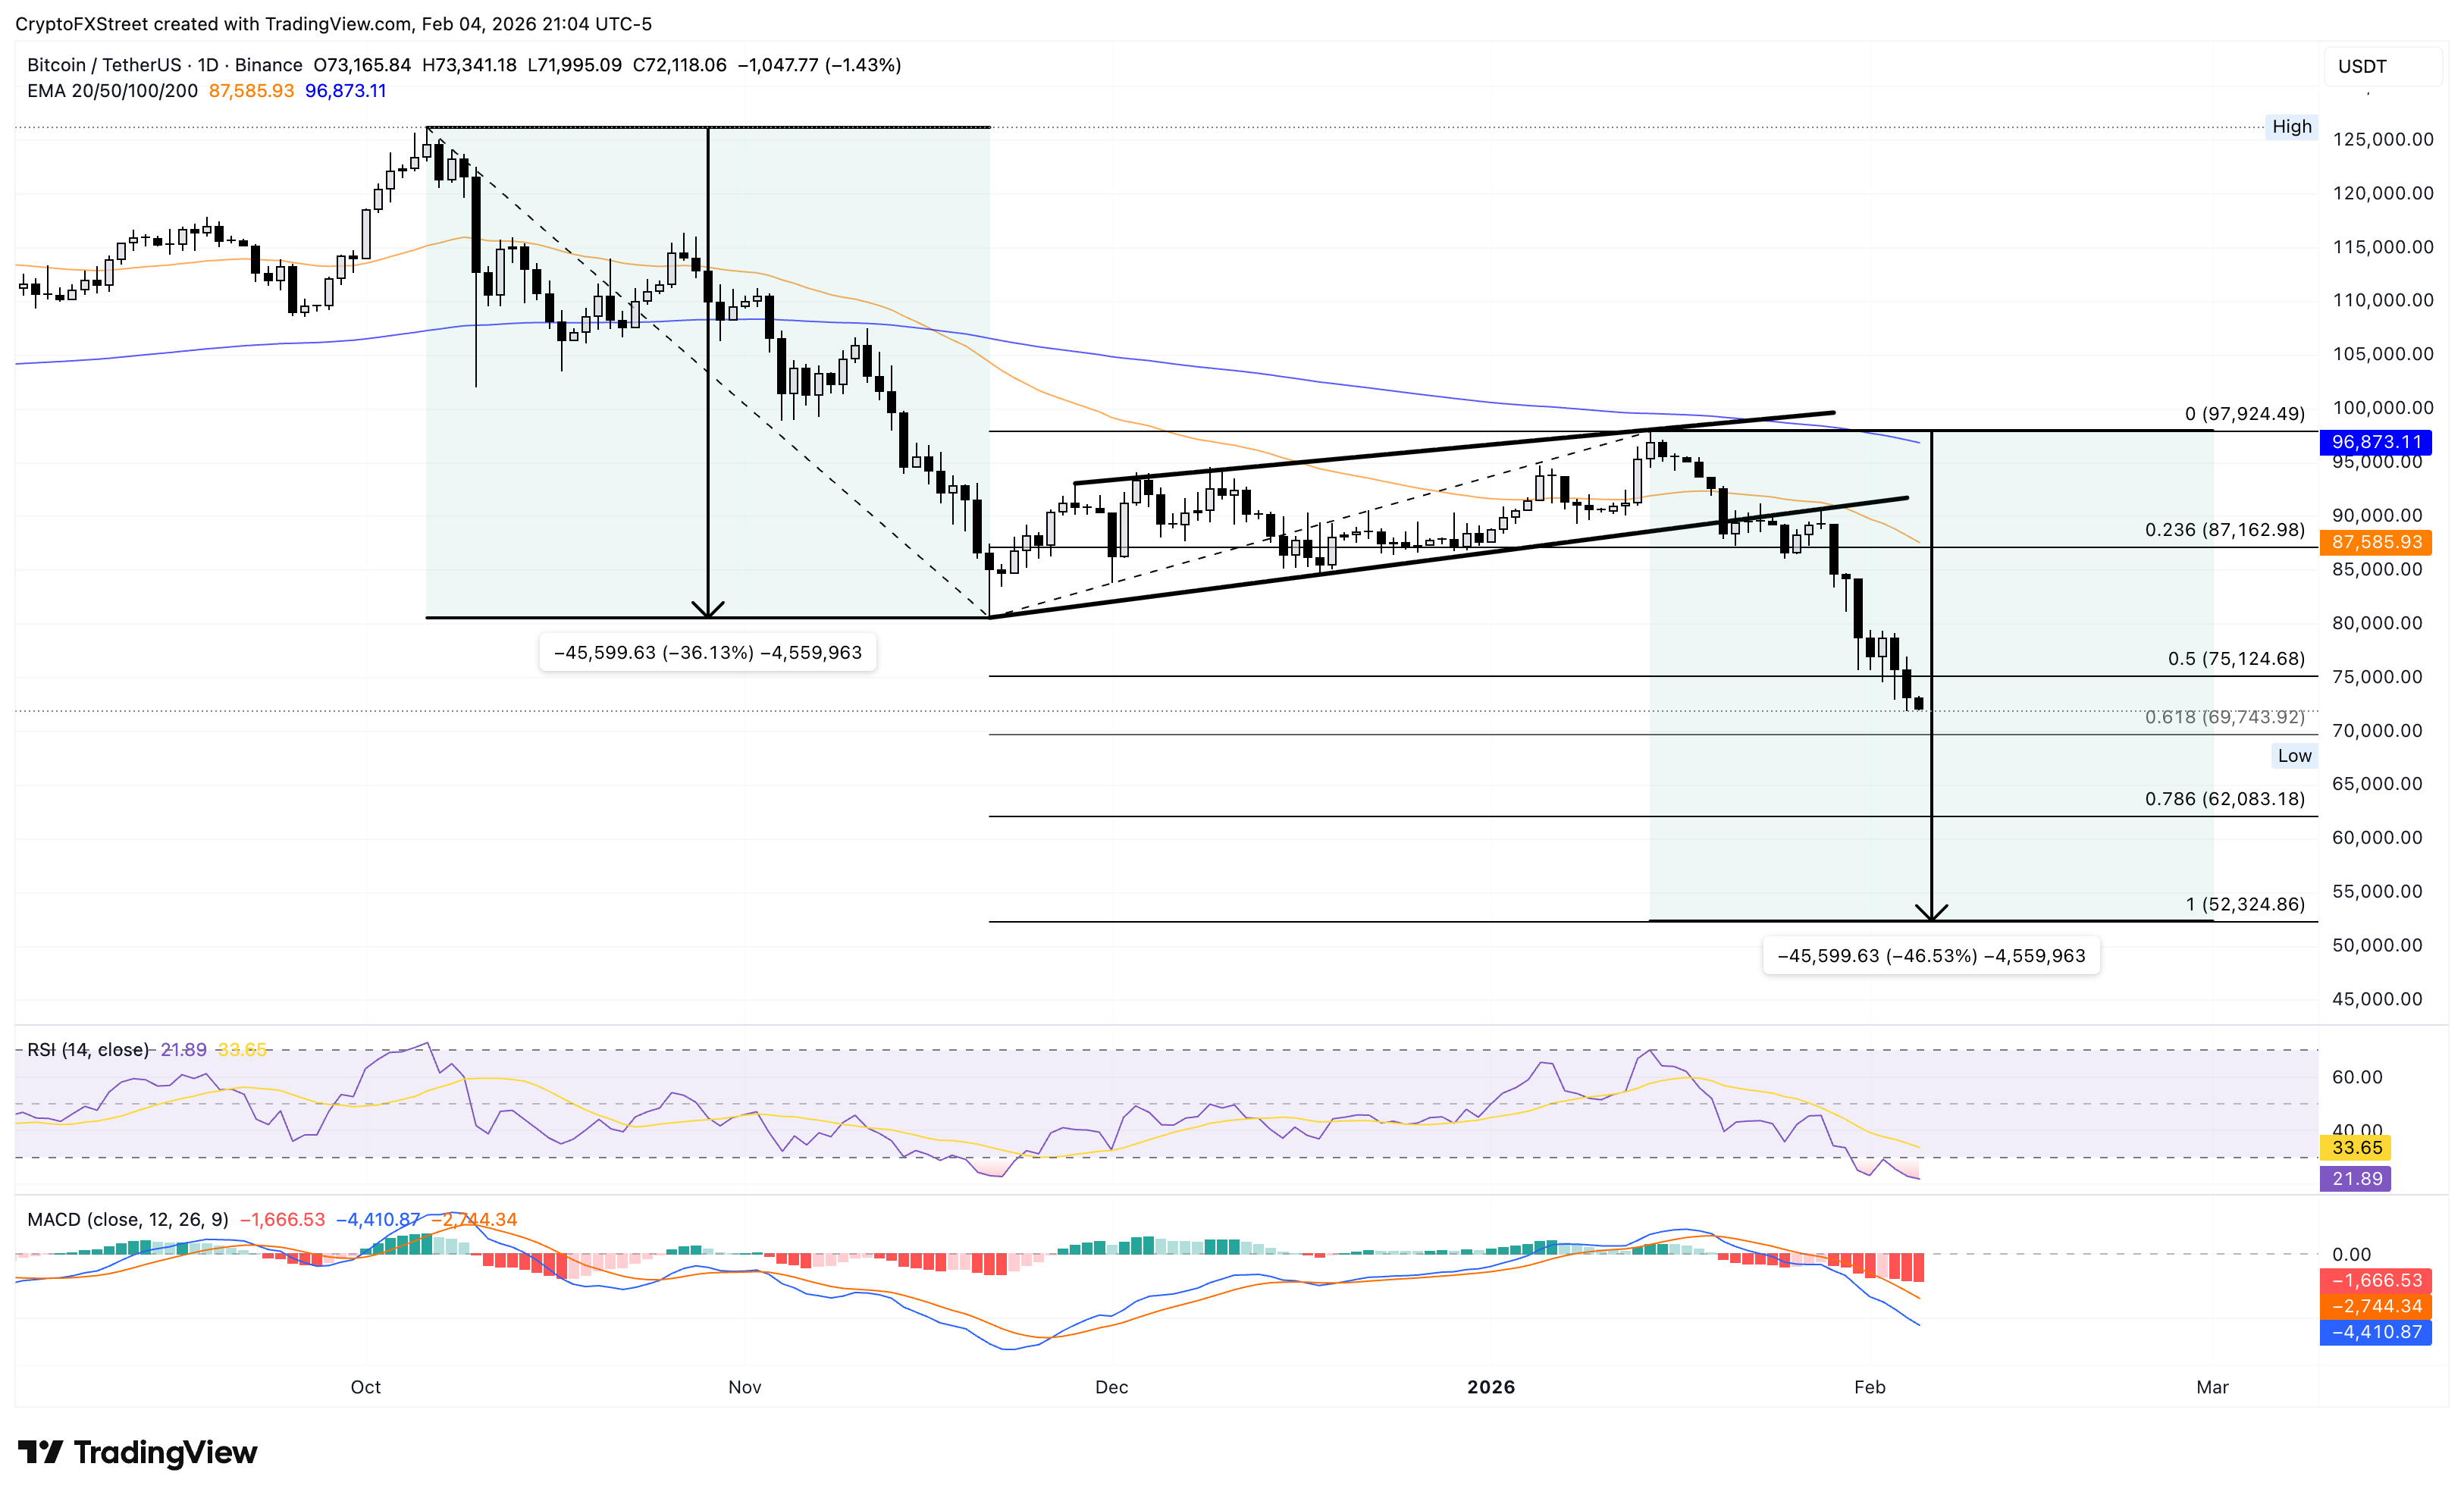
On the upside, the 50% retracement level at $75,124 could serve as the immediate resistance.
Zcash hits $250 as correction continues
Zcash trades near $250 at press time on Thursday, below the 50- and 200-day EMAs, which slope downward and are approaching a potential Death Cross pattern. The privacy coin reversed to the downside at the $300 mark, aligning with the 200-day EMA, crossing the 38.2% Fibonacci retracement level at $258, measured from the September 22 low at $46 to the November 7 high at $750.
Zcash is down roughly 20% so far this week, targeting the 50% retracement level at $186.
The MACD indicator shows both lines in a steady decline in the negative region, while the red-colored histogram expands, suggesting intense bearish momentum. At the same time, the RSI at 28 is in the oversold zone, warning of stretched conditions.
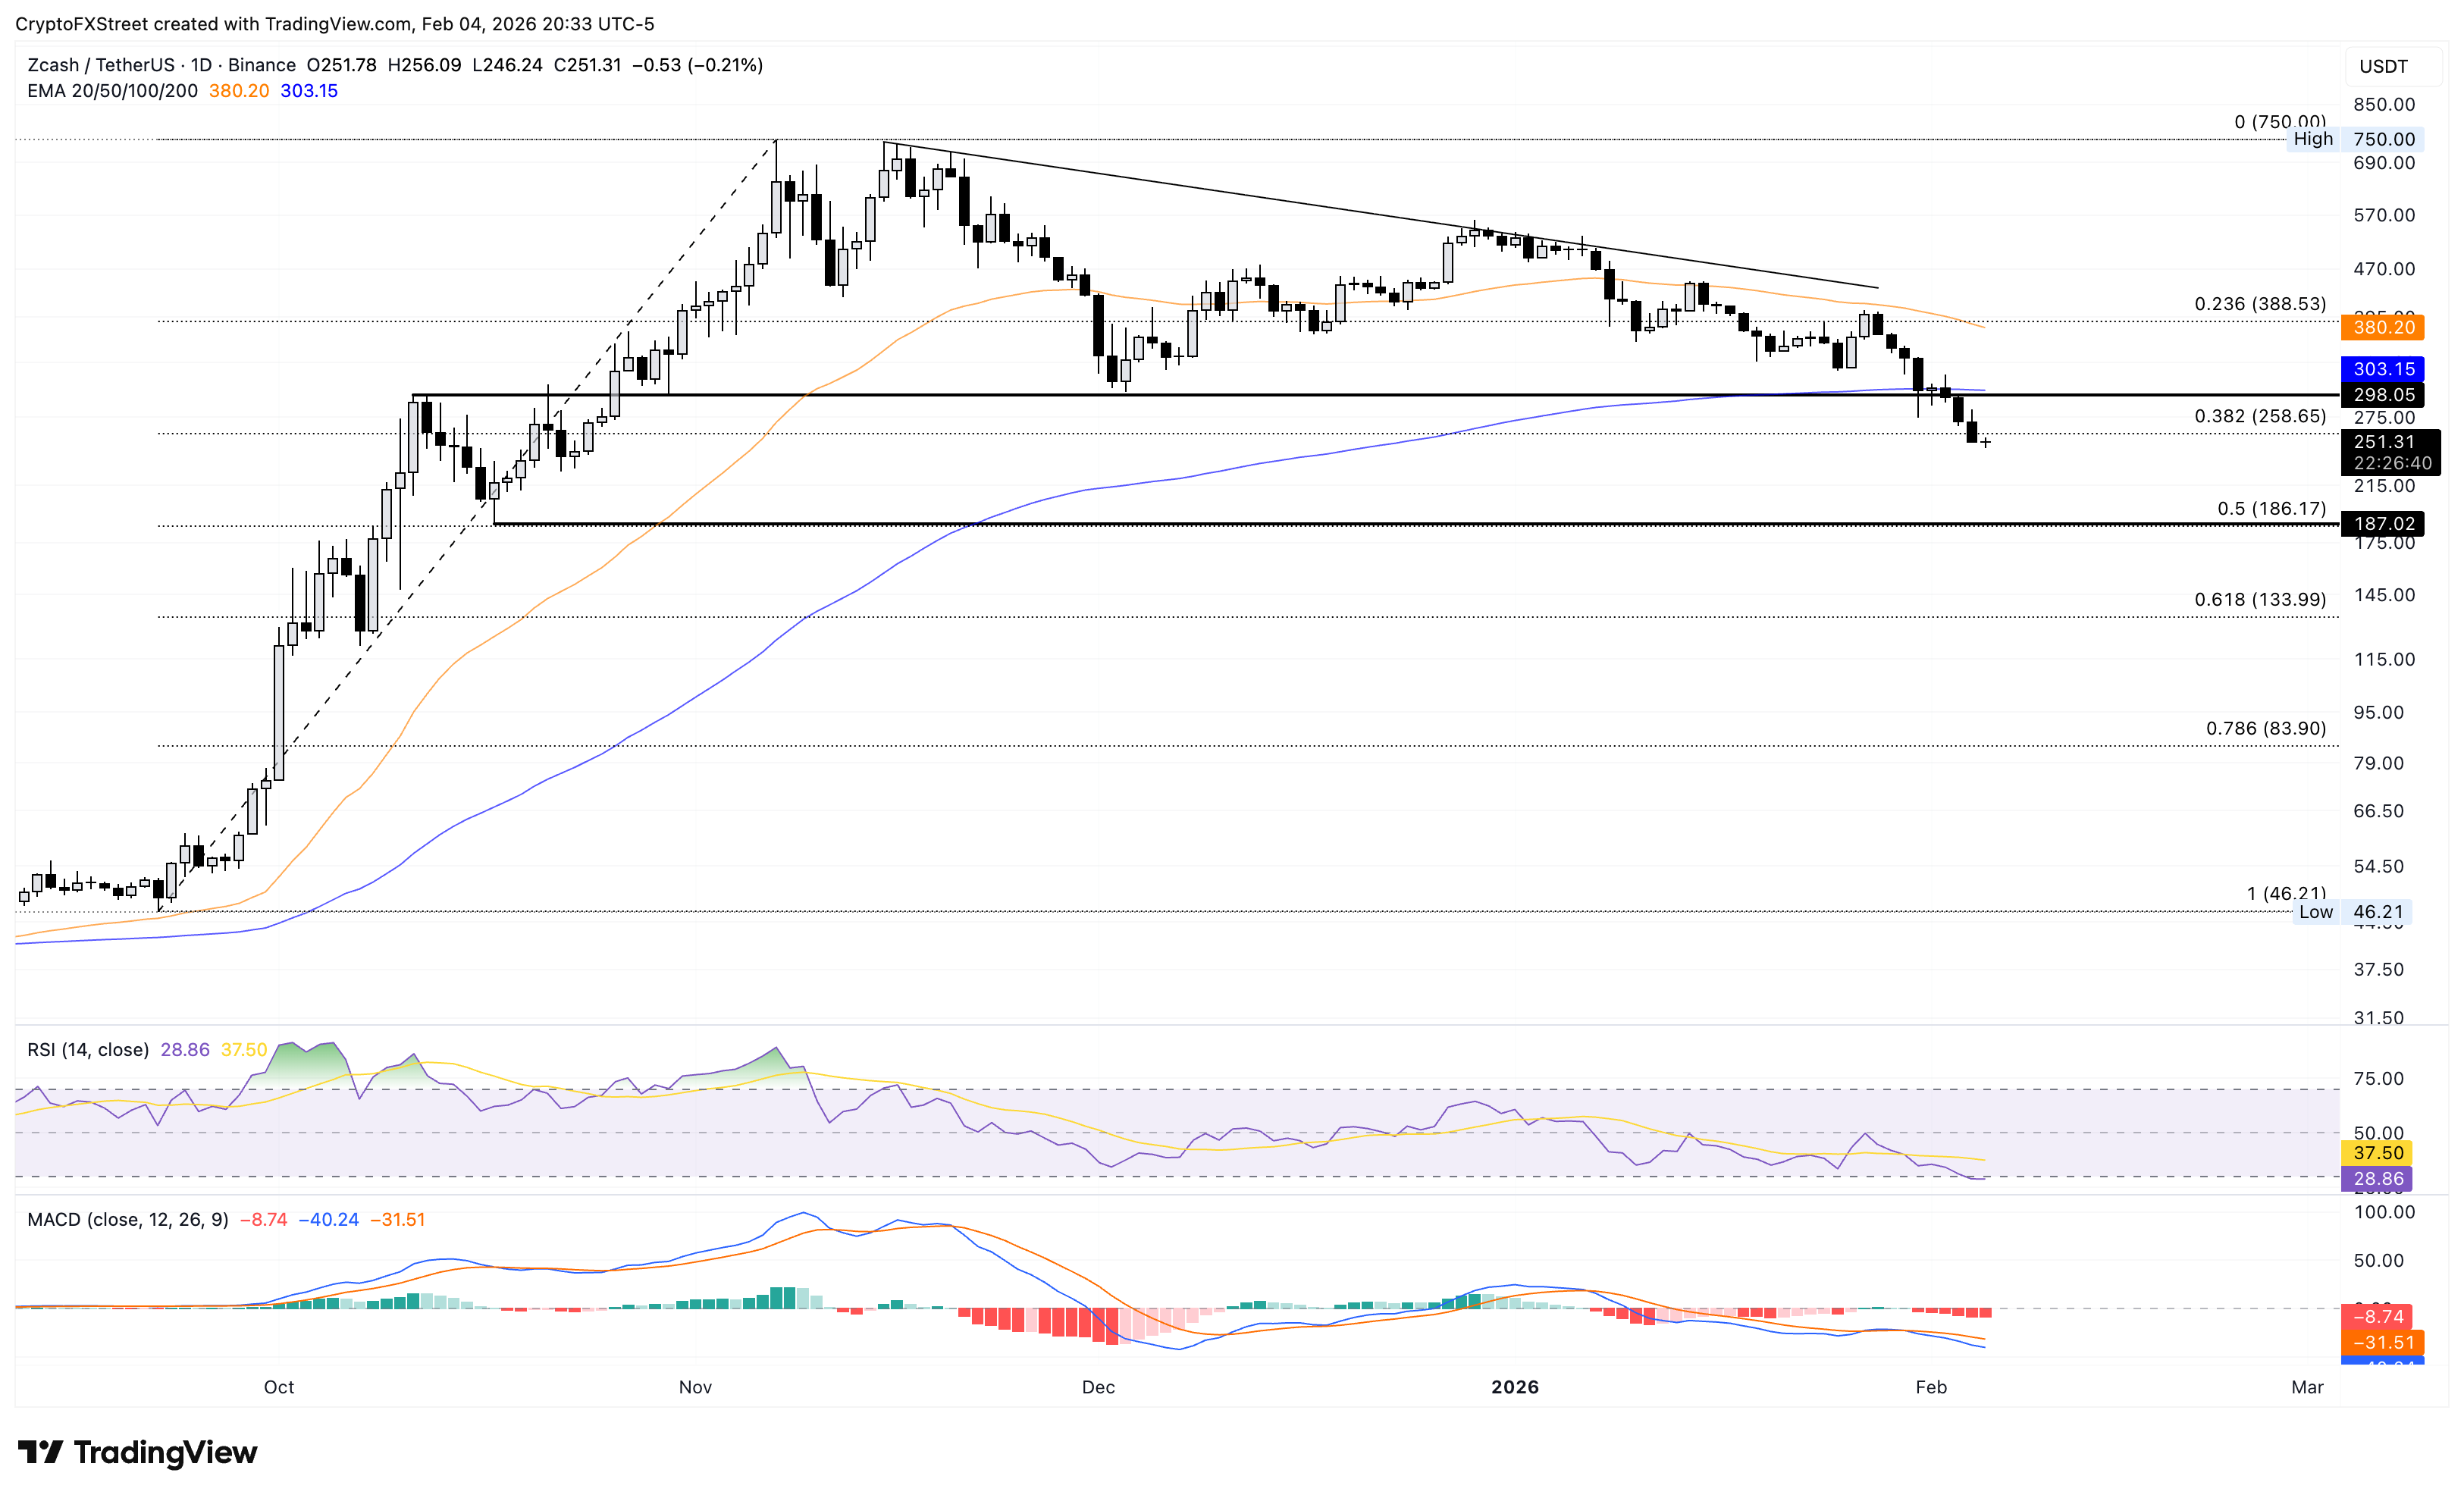
Looking up, the $300 mark remains a key resistance if ZEC resurfaces above the $258 mark.
Stacks recovery capped by the 50-day EMA
Stacks edges higher at press time on Thursday following a 10% drop the previous day. The falling 50-day EMA at $0.3119 capped gains on Wednesday, maintaining a bearish bias.
The MACD line remains close to the signal line with a contracting negative histogram, indicating reduced selling pressure. Meanwhile, the RSI at 44 remains below the 50 midline, indicating sellers retain modest control.
A close above the 50-day EMA at $0.3119 would be needed to test the barrier ranging between the $0.3500 supply zone and the R1 Pivot Point at $0.3646.
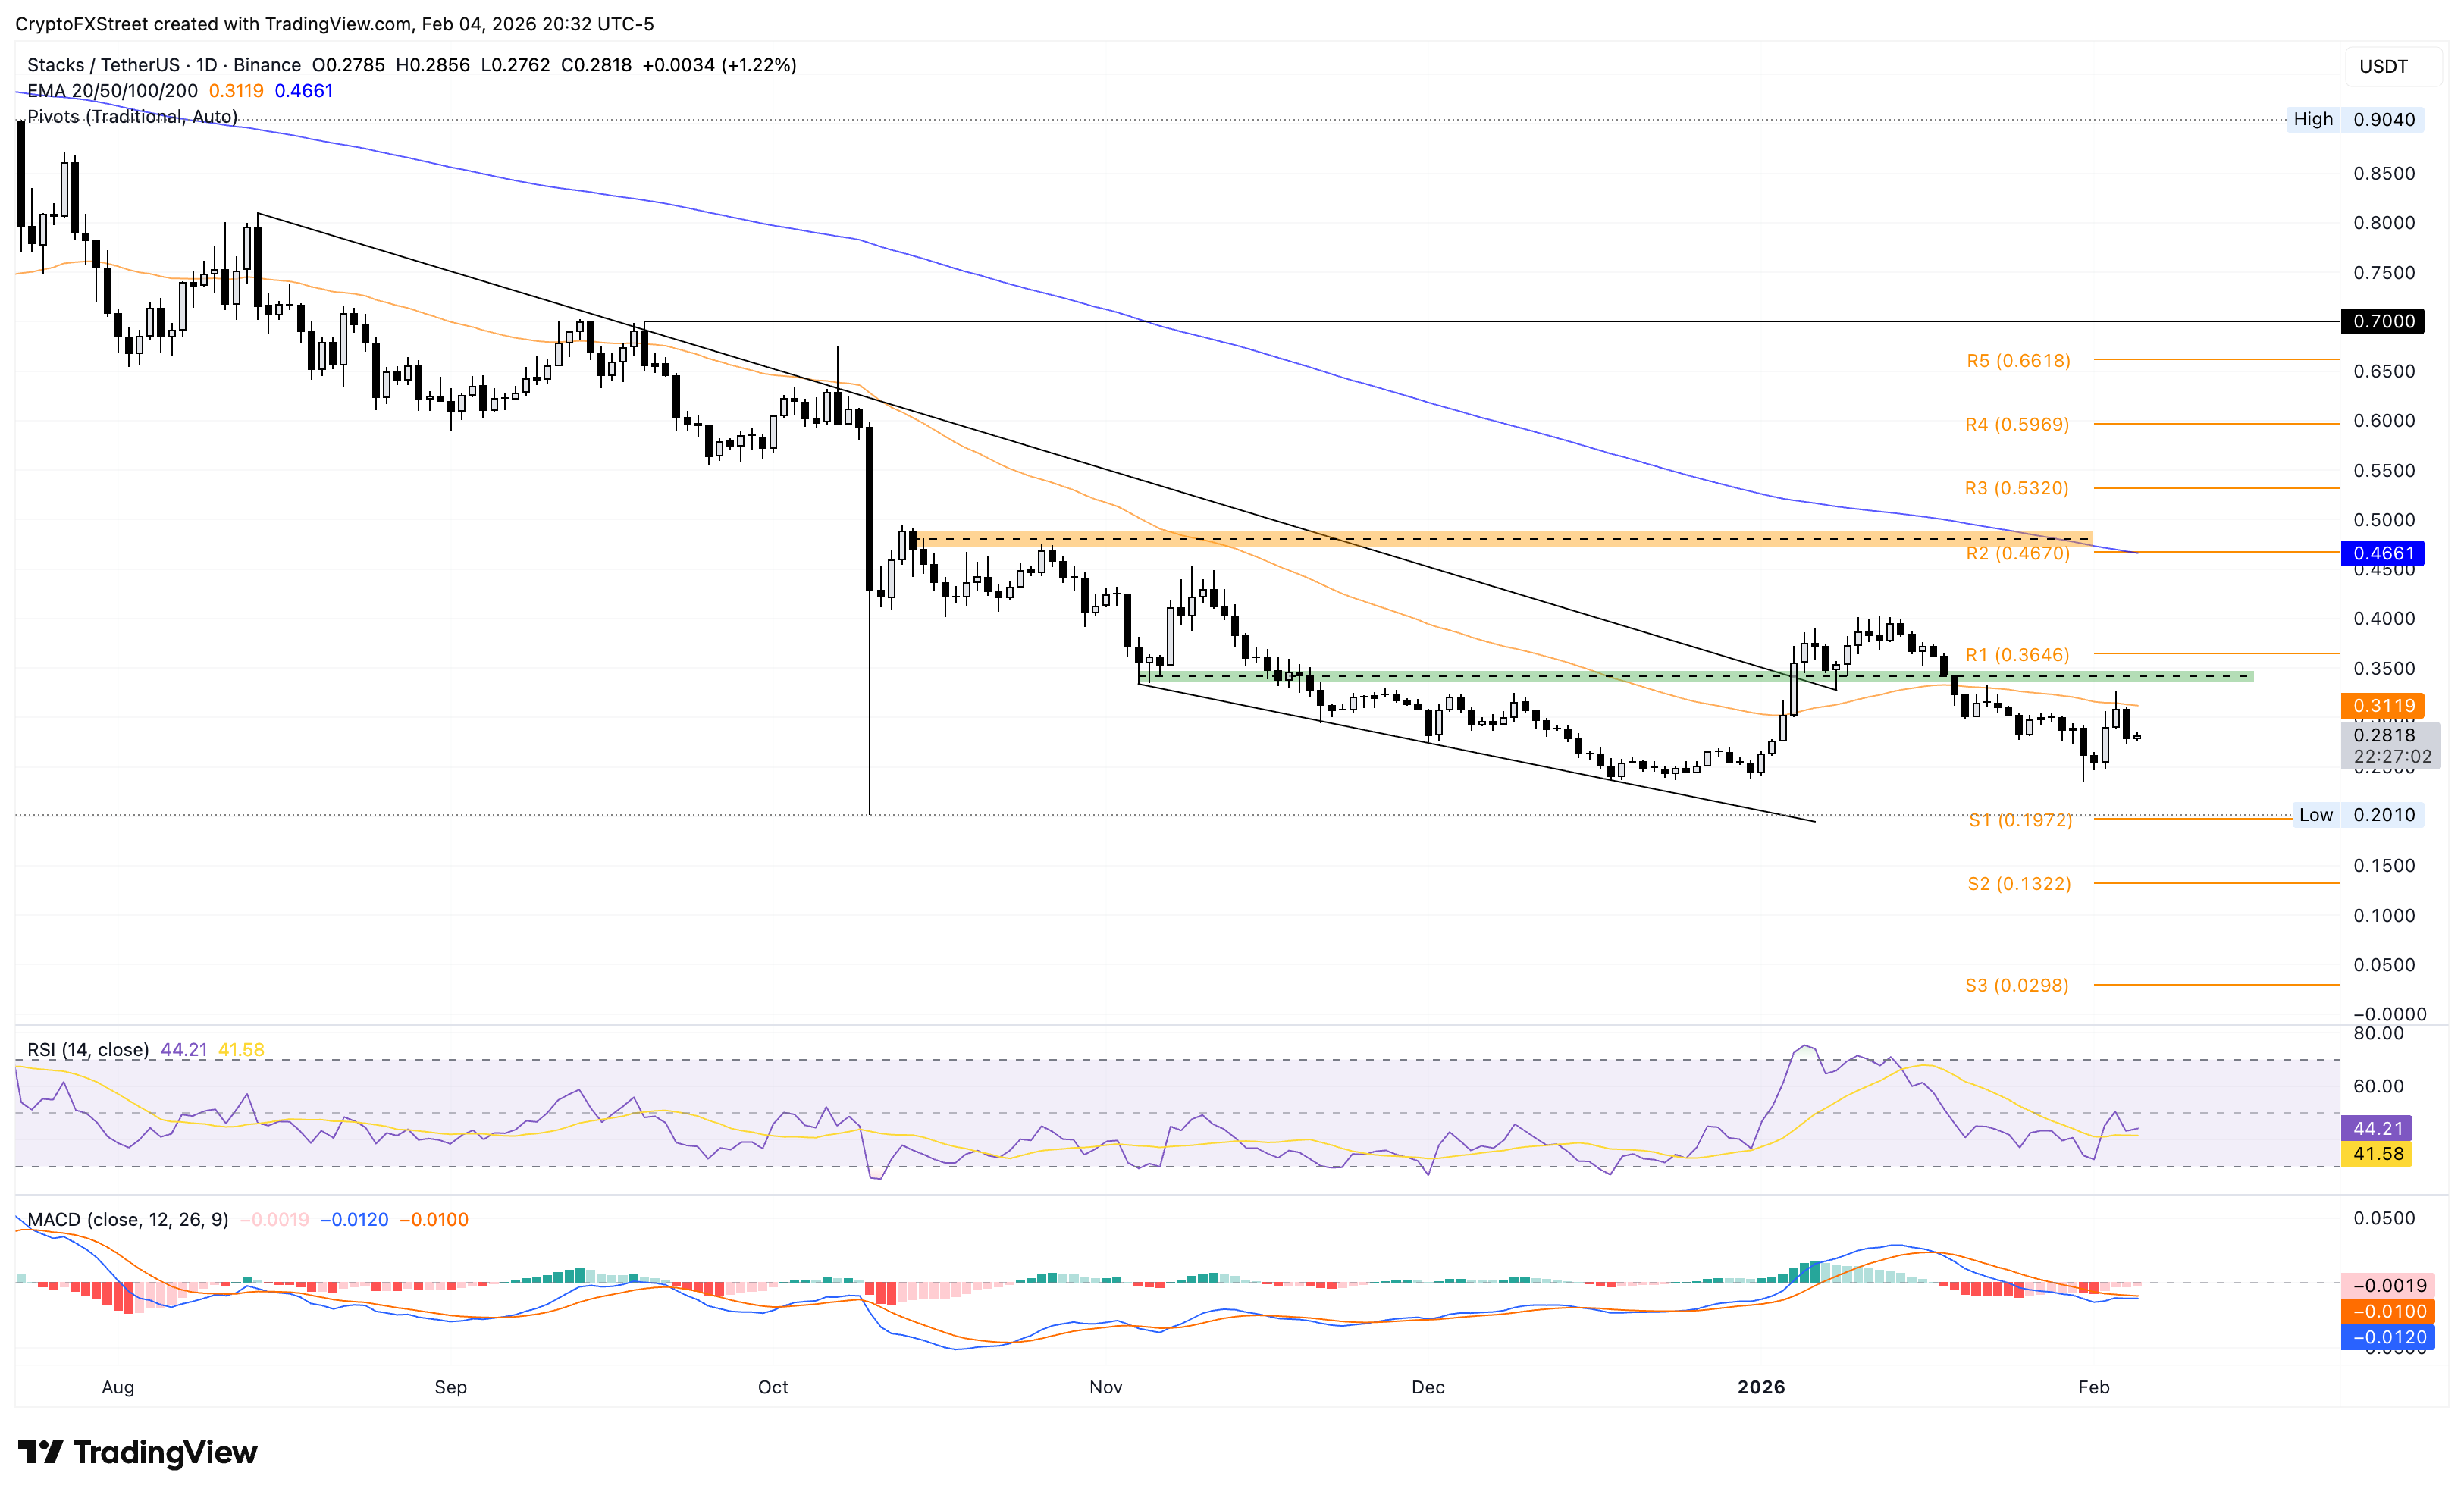
Looking down, the key support for Stacks remains the October 10 low at $0.2010.
BNB in freefall crosses below $700
BNB dropped below $700 so far on Thursday, marking its third consecutive bearish week. The exchange token remains well below the 50-day EMA at $863 and the 200-day EMA at $875 while the shorter average extends its decline beneath the longer one after the Death Cross pattern on Monday, maintaining a bearish alignment.
The MACD and signal lines are in a freefall below zero amid a widening negative histogram, which suggests intensifying bearish momentum. Additionally, the RSI at 21 is oversold, signaling the broader tone remains pressured unless momentum stabilizes.
The immediate support for BNB lies at the 78.6% Fibonacci retracement level at $620, measured from the February 2025 low at $500 and the October 2025 high at $1,375. A sustained break below that level could unlock further weakness.
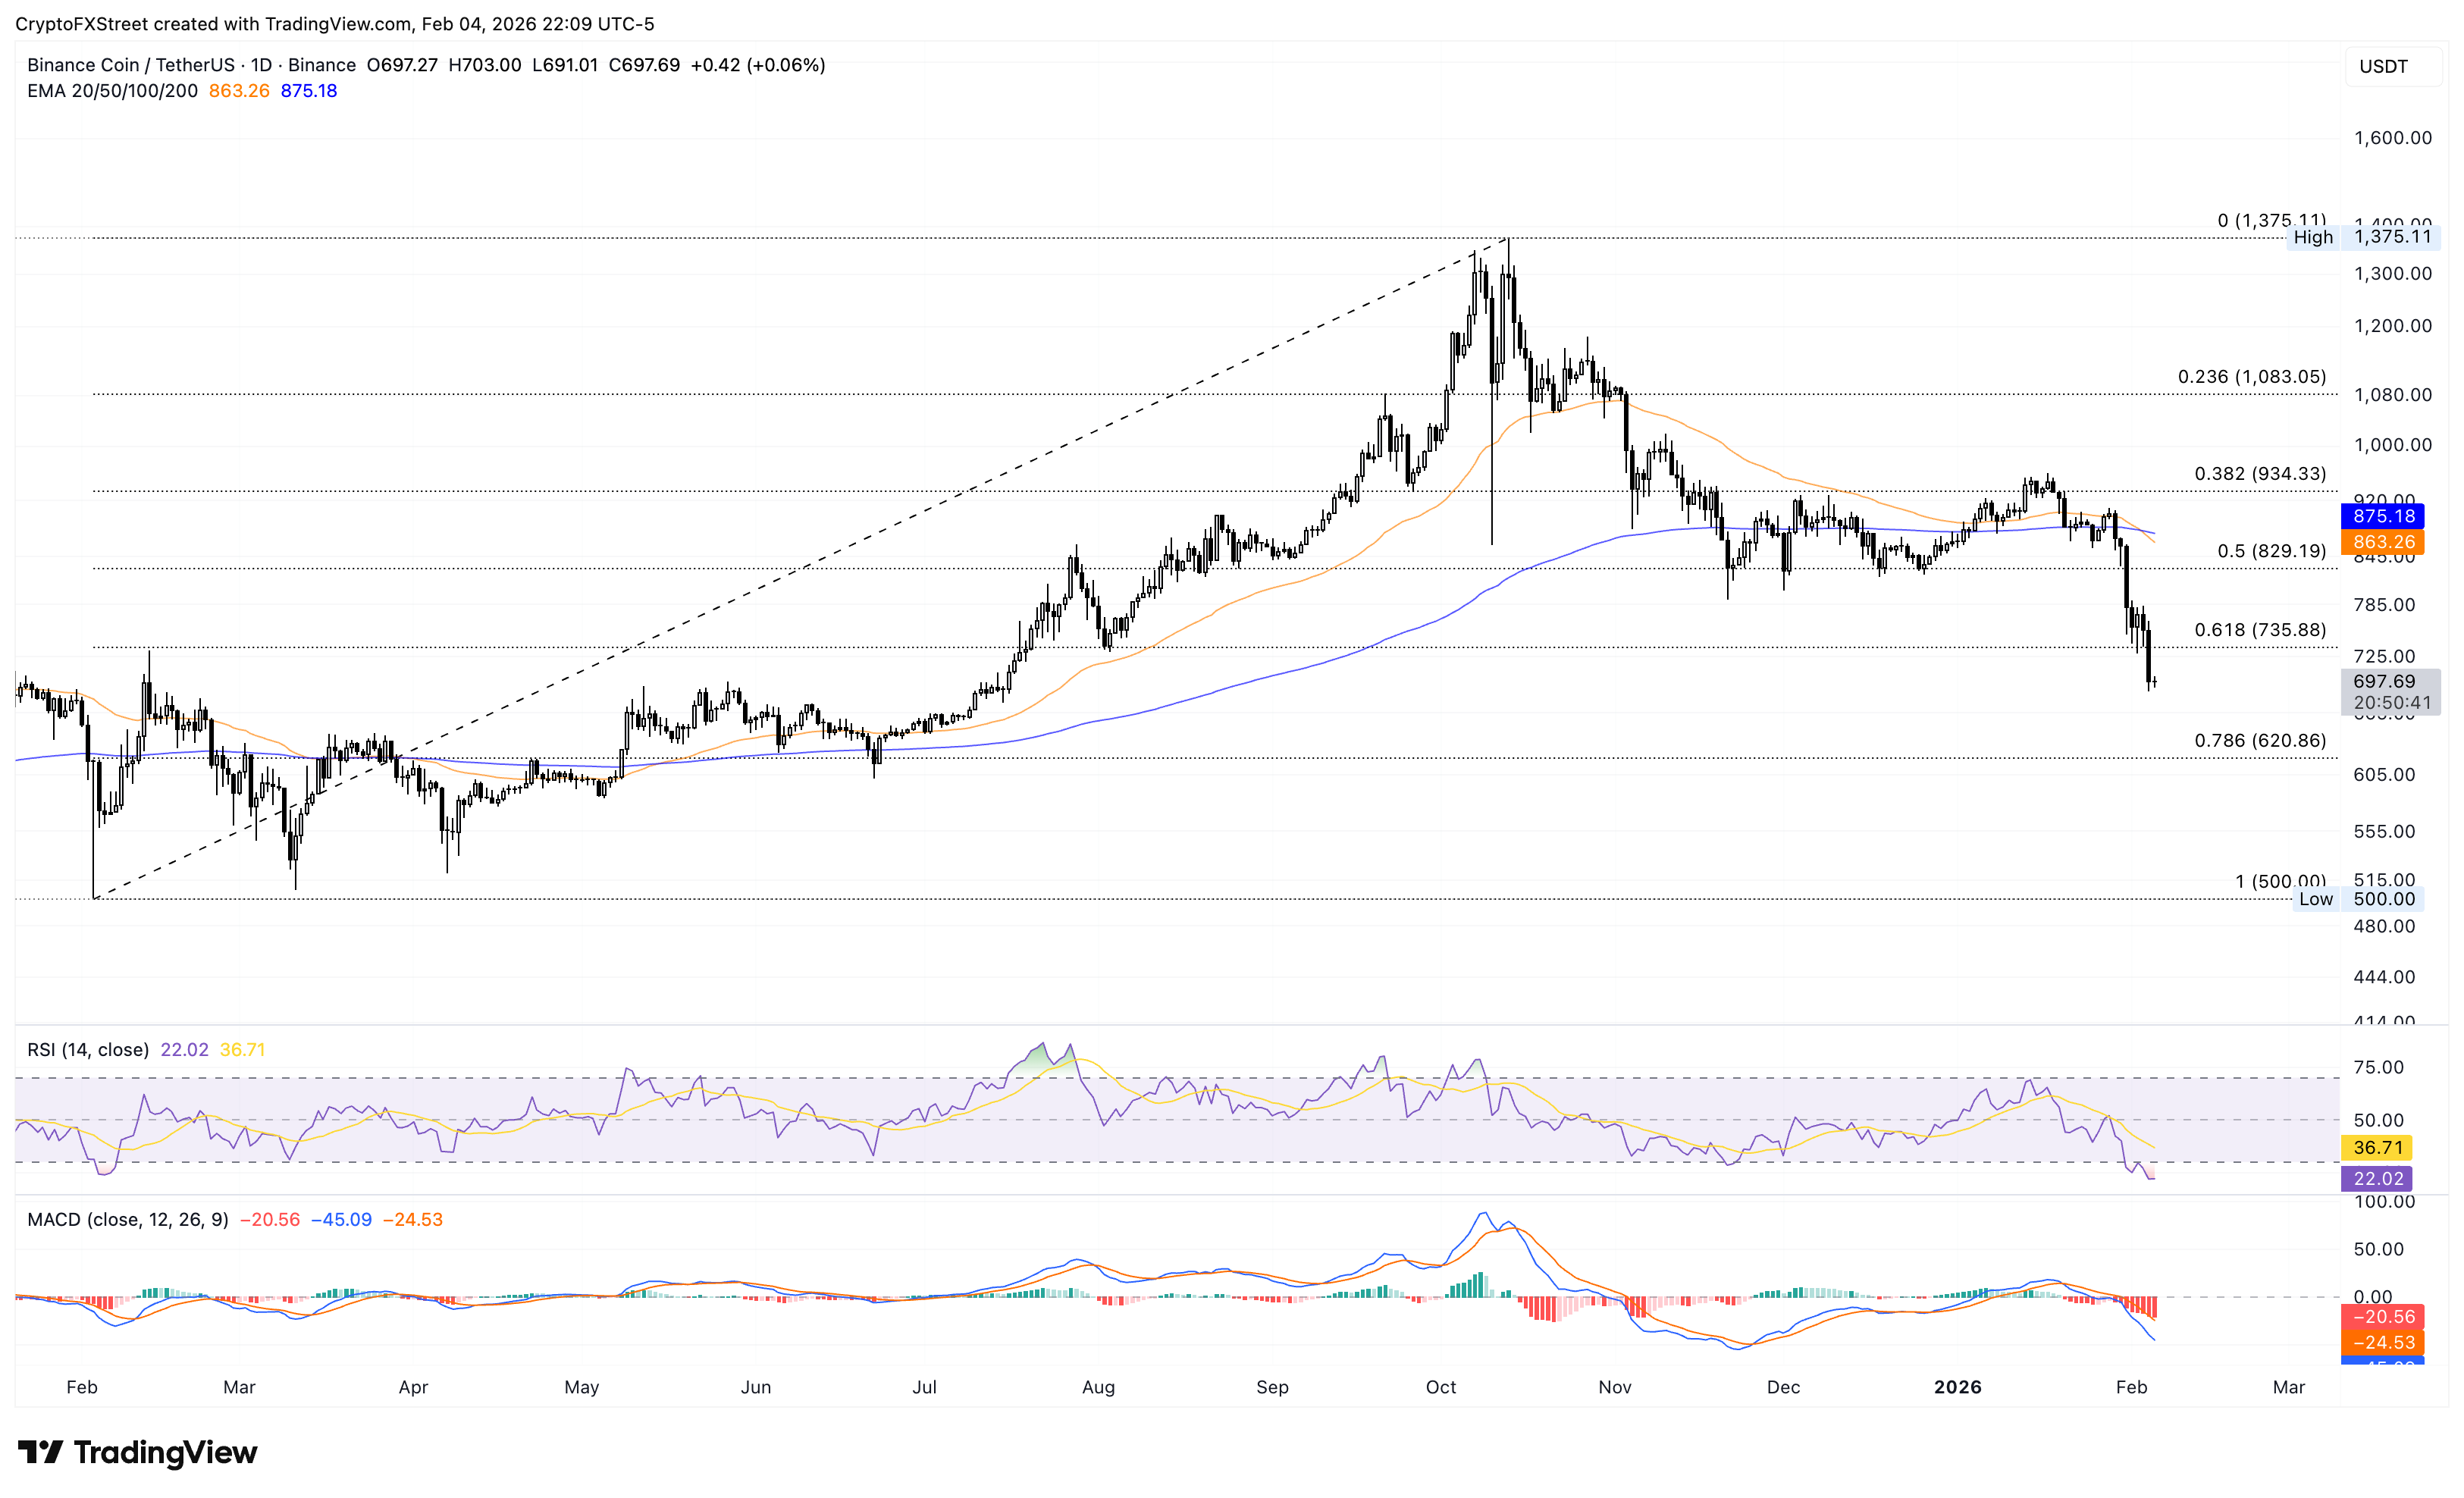
On the topside, a daily close above the 61.8% retracement at $735 would help ease bearish pressure.
Bài viết đề xuất


