

Bitcoin Price Forecast: BTC hovers above $87,000 amid risk-averse New Year
- Bitcoin hovers above $87,000, marking a bearish close to 2025 with a 6% decline.
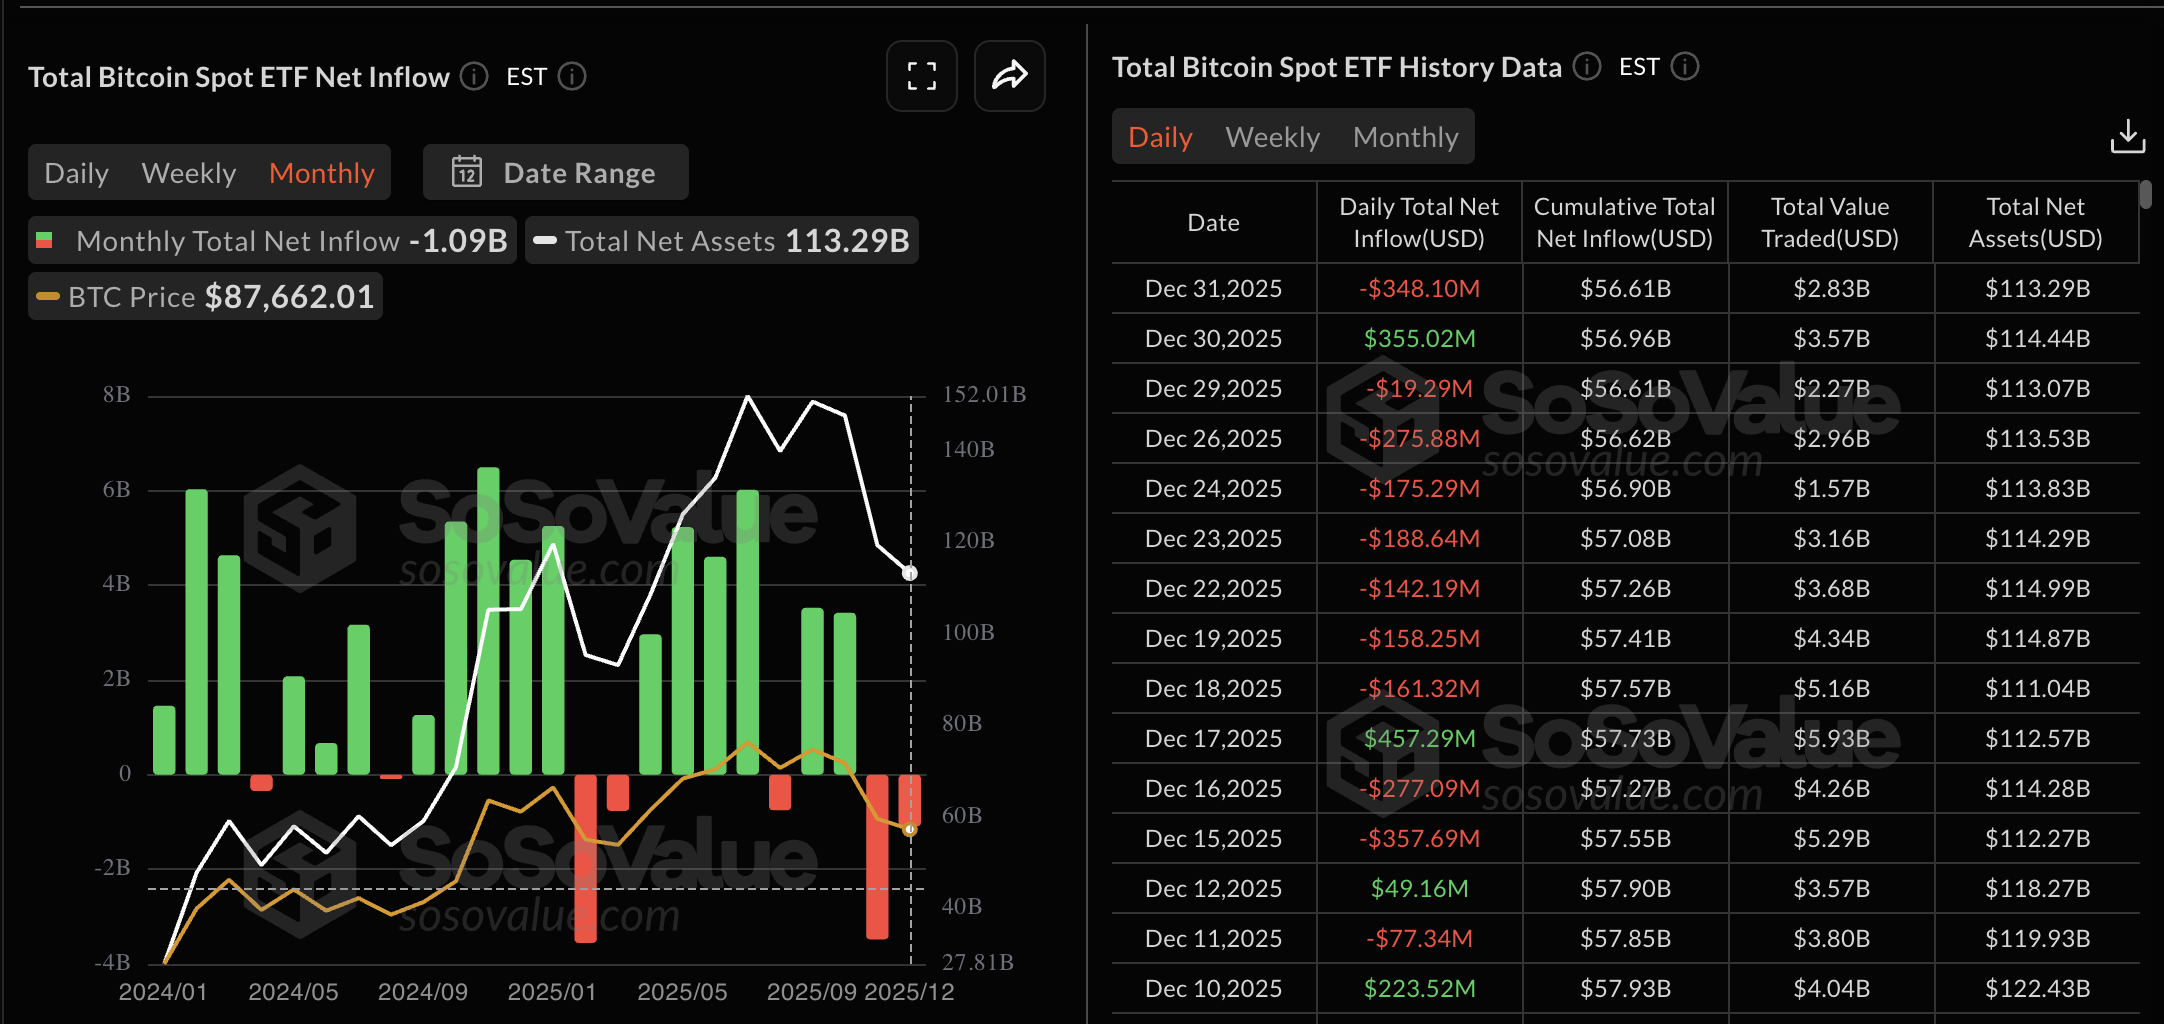
- US spot BTC ETFs end the year with a $348 million outflow on Wednesday, while the annual inflow was over $21 trillion.
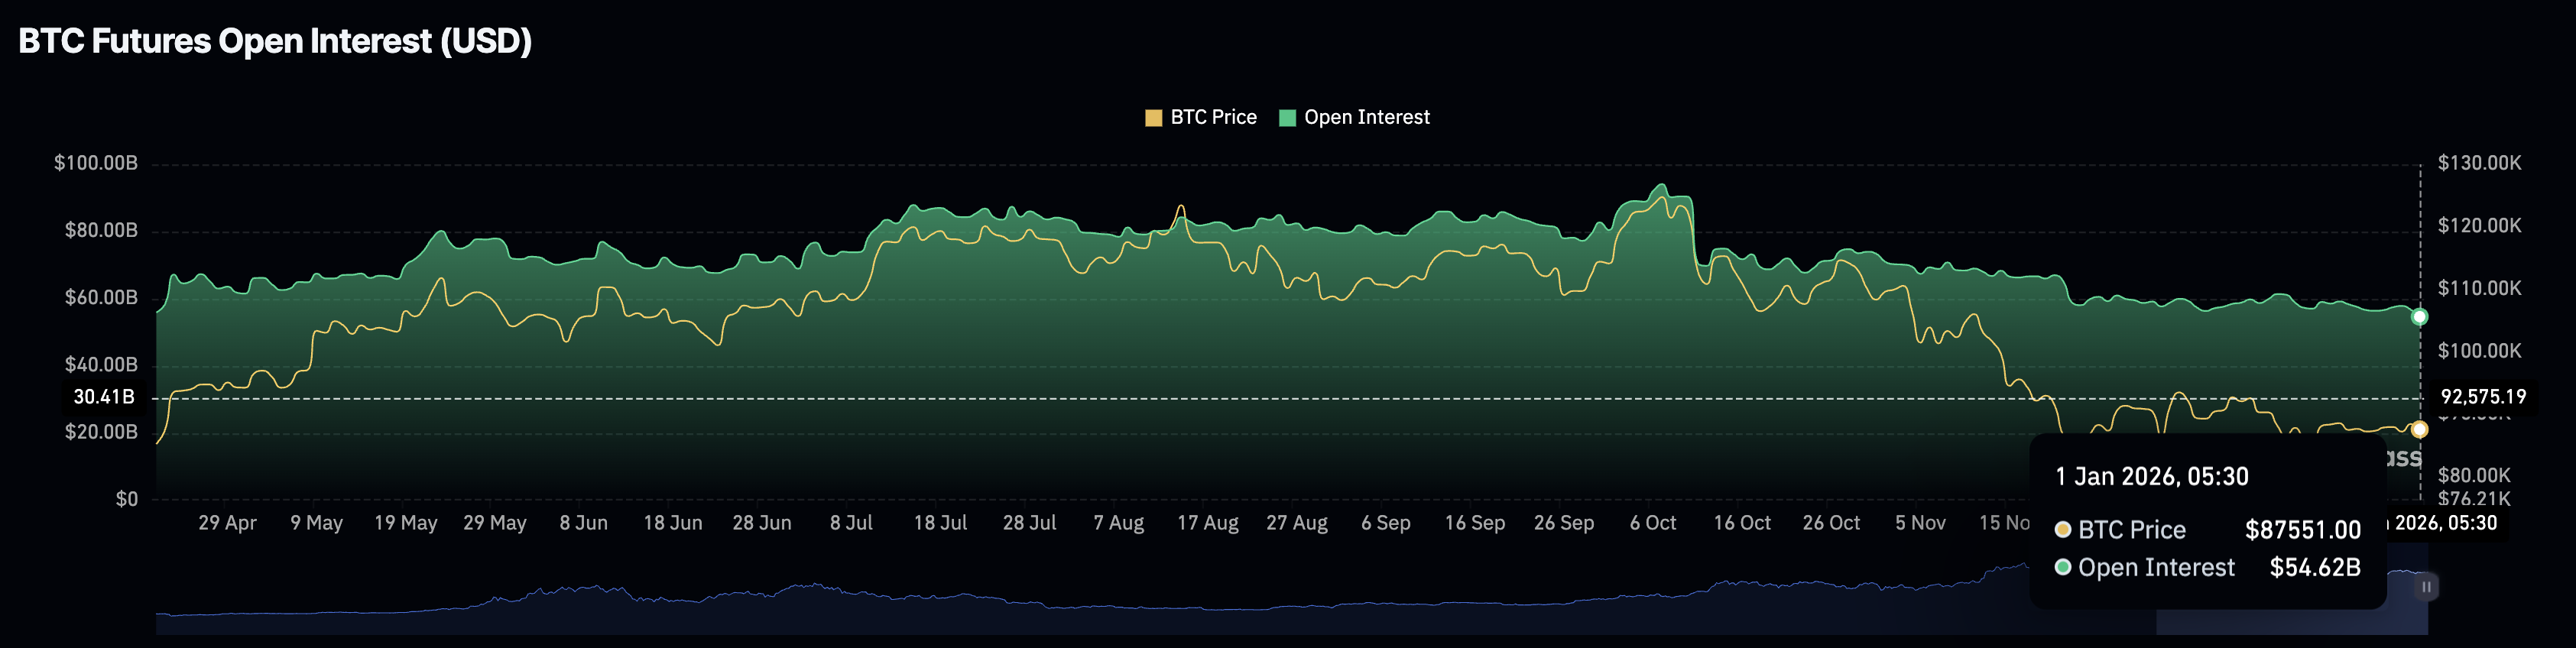
- Derivatives data shows a decline in Open Interest, suggesting risk-off sentiment among traders.
Bitcoin (BTC) price hovers above $87,000 a press time on Thursday, holding steady after a 1% drop on the previous day. Institutional interest weakened by the end of last year, while corporate demand continues to accumulate. Derivatives data suggest a weakness in retail interest as BTC futures Open Interest declines.
Bitcoin starts the New Year with reduced demand
Bitcoin-focused Exchange Traded Funds (ETFs) in the US recorded an outflow of $348 million on Wednesday, nearly erasing the $355 million of inflow on the previous day. These ETFs recorded an outflow of $1.09 billion, advancing the withdrawal streak after $3.48 billion was offloaded in November.
Additionally, this marked the fifth bearish month last year, while the annual inflow stood at $21.07 trillion.
On the corporate side, Tether, a US Dollar-stablecoin issuer, announced acquiring 8,888 BTC over the past three months. Tether’s move alongside Michael Saylor’s Strategy and Metaplanet boosted their holdings to 672,497 BTC and 35,102 BTC, respectively, which reflects an increase in corporate demand.

However, short-term volatility in Bitcoin has led to a decline in retail risk exposure in its derivatives market. CoinGlass data shows a decrease in BTC futures Open Interest (OI) to $54.62 billion on Thursday, from $94.12 billion on October 7. Typically, a decline in OI indicates that traders are either closing positions or reducing leverage, signaling risk-off sentiment.
Technical outlook: Bitcoin consolidates in a triangle pattern
Bitcoin price is trading below $88,000 at the time of writing on Thursday, down 1% from Wednesday. The BTC is extending its sideways trend within a symmetrical triangle pattern, as previously reported by FXStreet.
The overhead resistance trendline near $92,000 is slightly above the 50-day Exponential Moving Average (EMA) at $91,629.
Technically, Bitcoin is losing momentum in the short term. The Relative Strength Index (RSI) at 445 hovers near the halfway line, indicating a neutral stand. Meanwhile, the Moving Average Convergence Divergence (MACD) steadily approaches the zero line, but fluctuating green histogram bars indicate a potentially unsustainable bullish momentum.
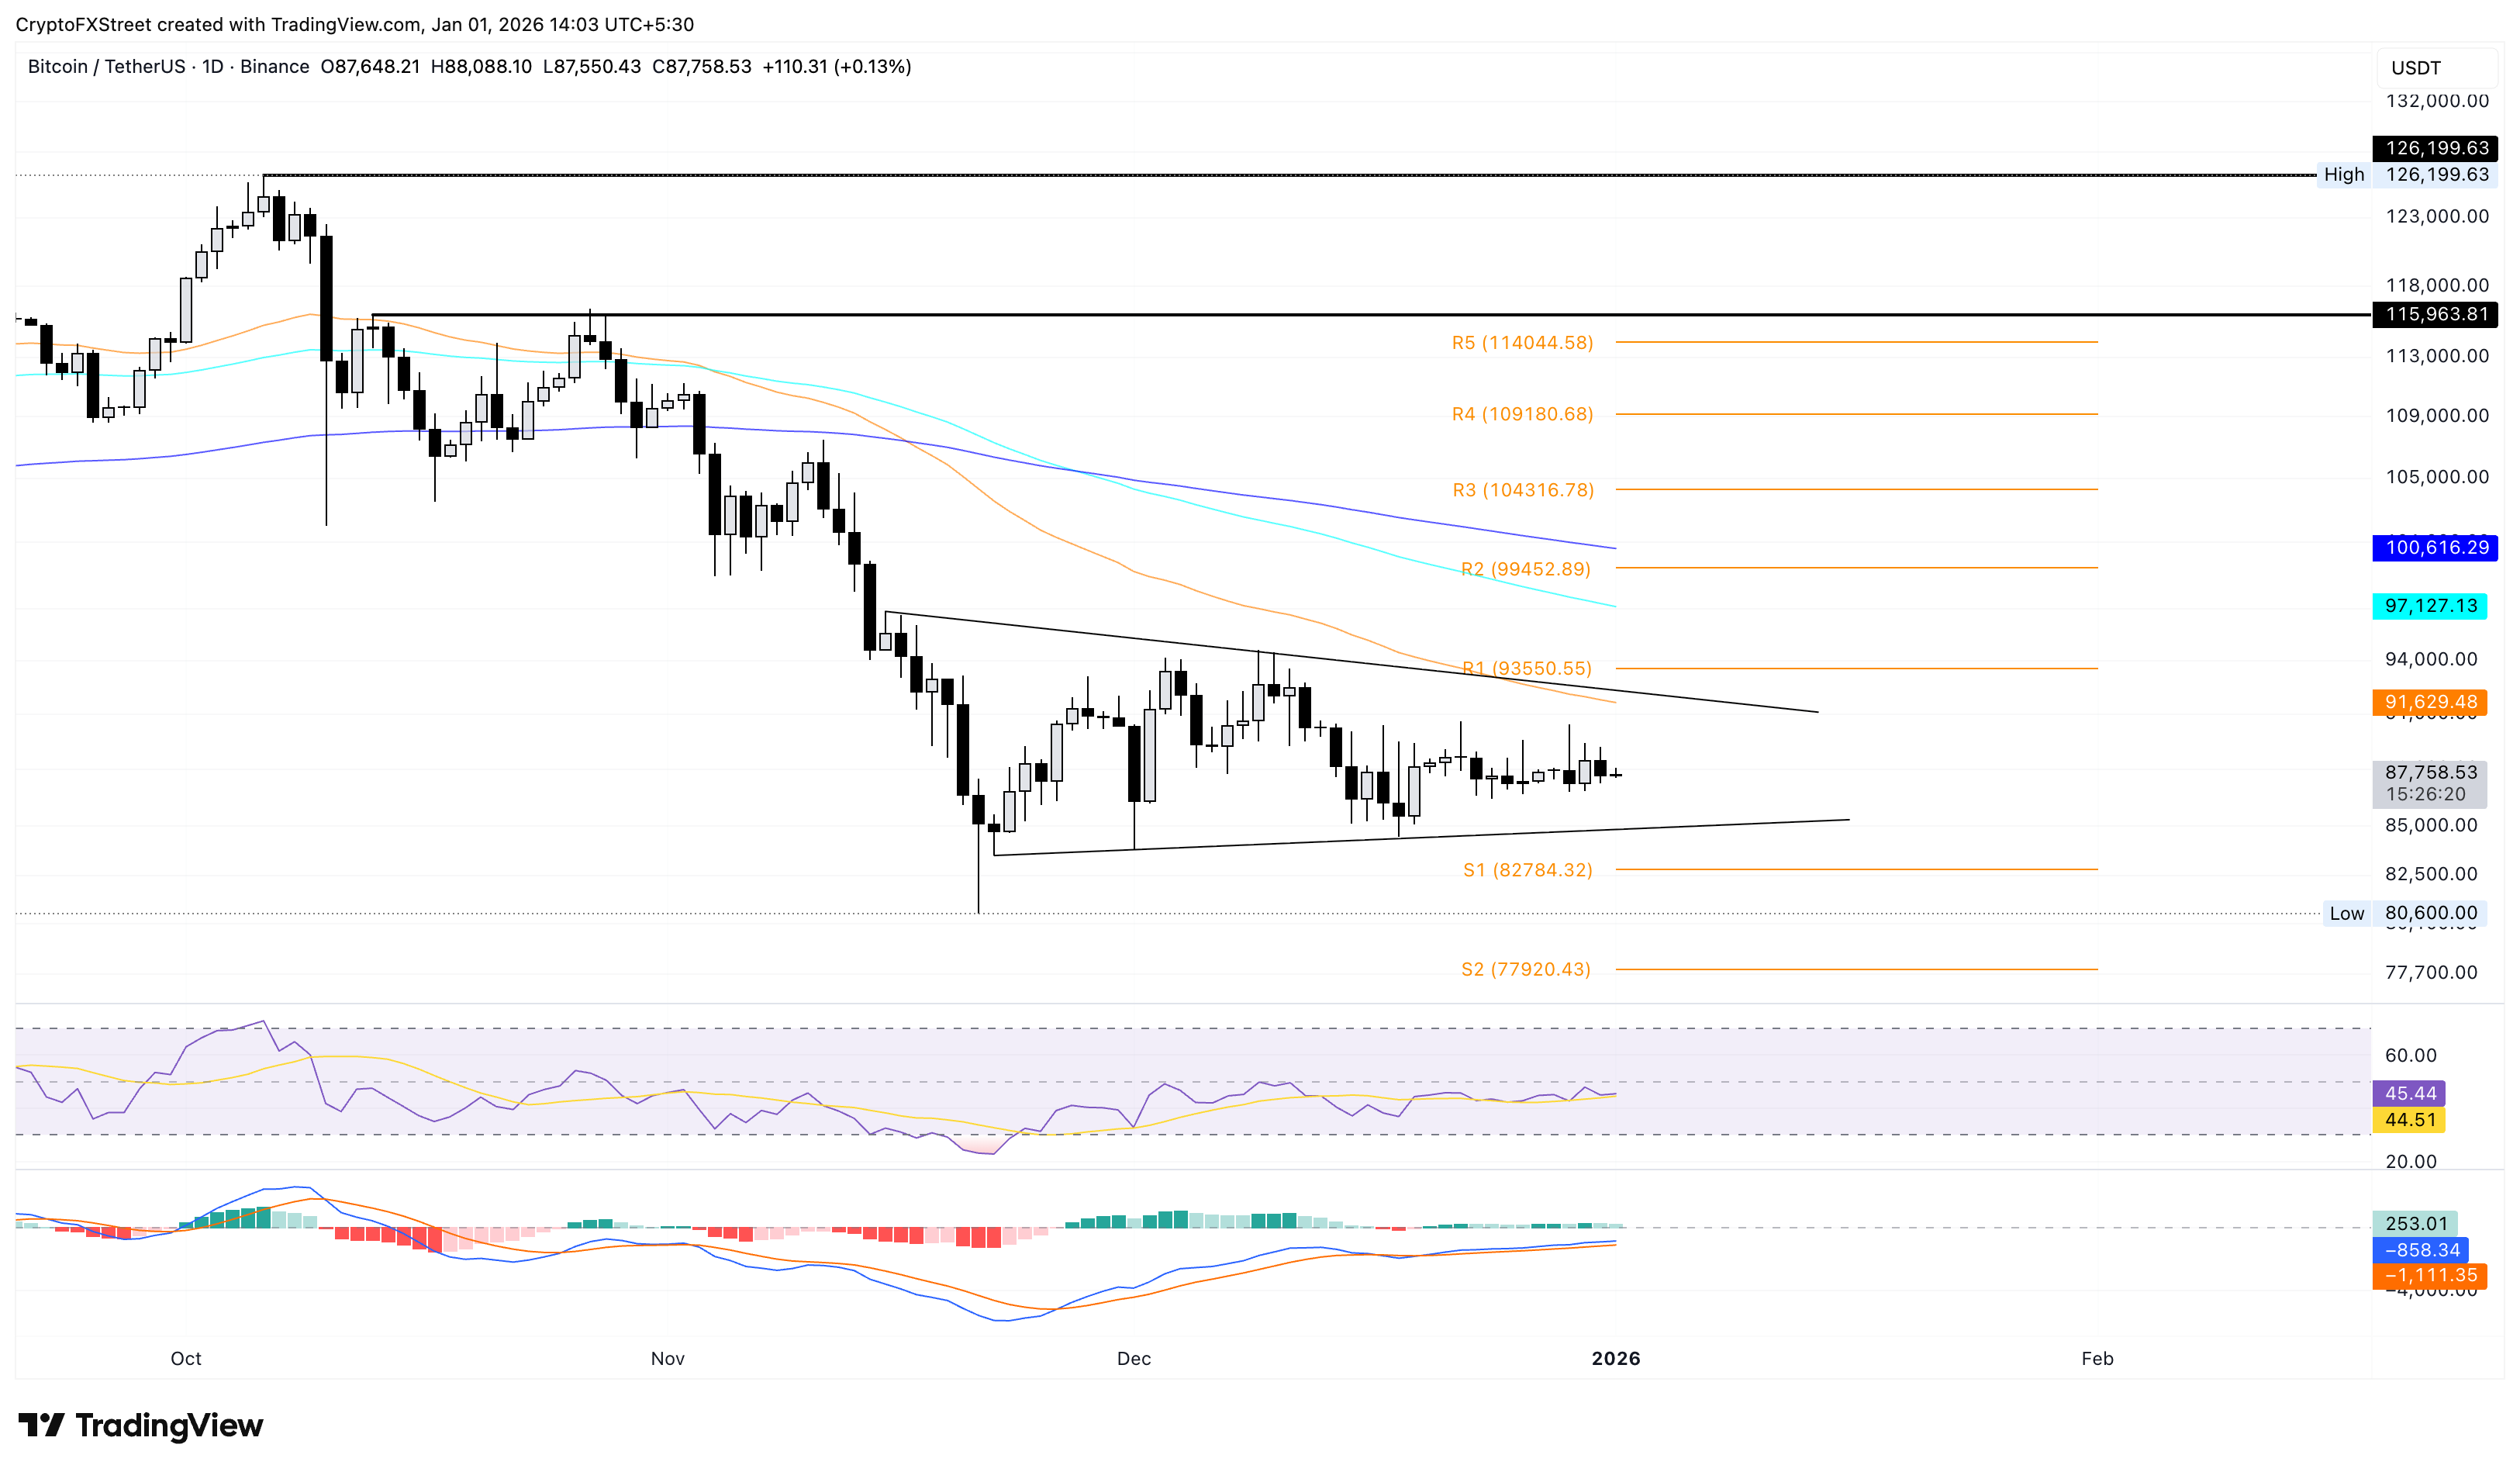
If BTC price slips below the support trendline near $85,000, it could test the S1 Pivot Point at $82,784.
Bitcoin, altcoins, stablecoins FAQs
Bitcoin is the largest cryptocurrency by market capitalization, a virtual currency designed to serve as money. This form of payment cannot be controlled by any one person, group, or entity, which eliminates the need for third-party participation during financial transactions.
Altcoins are any cryptocurrency apart from Bitcoin, but some also regard Ethereum as a non-altcoin because it is from these two cryptocurrencies that forking happens. If this is true, then Litecoin is the first altcoin, forked from the Bitcoin protocol and, therefore, an “improved” version of it.
Stablecoins are cryptocurrencies designed to have a stable price, with their value backed by a reserve of the asset it represents. To achieve this, the value of any one stablecoin is pegged to a commodity or financial instrument, such as the US Dollar (USD), with its supply regulated by an algorithm or demand. The main goal of stablecoins is to provide an on/off-ramp for investors willing to trade and invest in cryptocurrencies. Stablecoins also allow investors to store value since cryptocurrencies, in general, are subject to volatility.
Bitcoin dominance is the ratio of Bitcoin's market capitalization to the total market capitalization of all cryptocurrencies combined. It provides a clear picture of Bitcoin’s interest among investors. A high BTC dominance typically happens before and during a bull run, in which investors resort to investing in relatively stable and high market capitalization cryptocurrency like Bitcoin. A drop in BTC dominance usually means that investors are moving their capital and/or profits to altcoins in a quest for higher returns, which usually triggers an explosion of altcoin rallies.
Bài viết đề xuất


