

Crypto Today: Bitcoin, Ethereum, XRP sell-off intensifies as liquidations hit $2 billion
- .Bitcoin is retesting April levels, falling toward $80,000 amid $2 billion crypto liquidations.
- Ethereum downtrend accelerates toward $2,500 as institutional investors exit.
- XRP extends its decline below $2.00, weighed down by decreasing retail demand.
Bitcoin (BTC) is trading below $84,000 at the time of writing on Friday, after reaching an intraday low of $82,000, driven by macroeconomic uncertainty and related risk-off sentiment.
Altcoins, including Ethereum (ETH) and Ripple (XRP), are extending their declines as weak retail demand and ongoing institutional outflows from Exchange Traded Funds (ETFs) make any rebound difficult to sustain.
Data spotlight: Bitcoin trades under pressure as ETF outflows surge
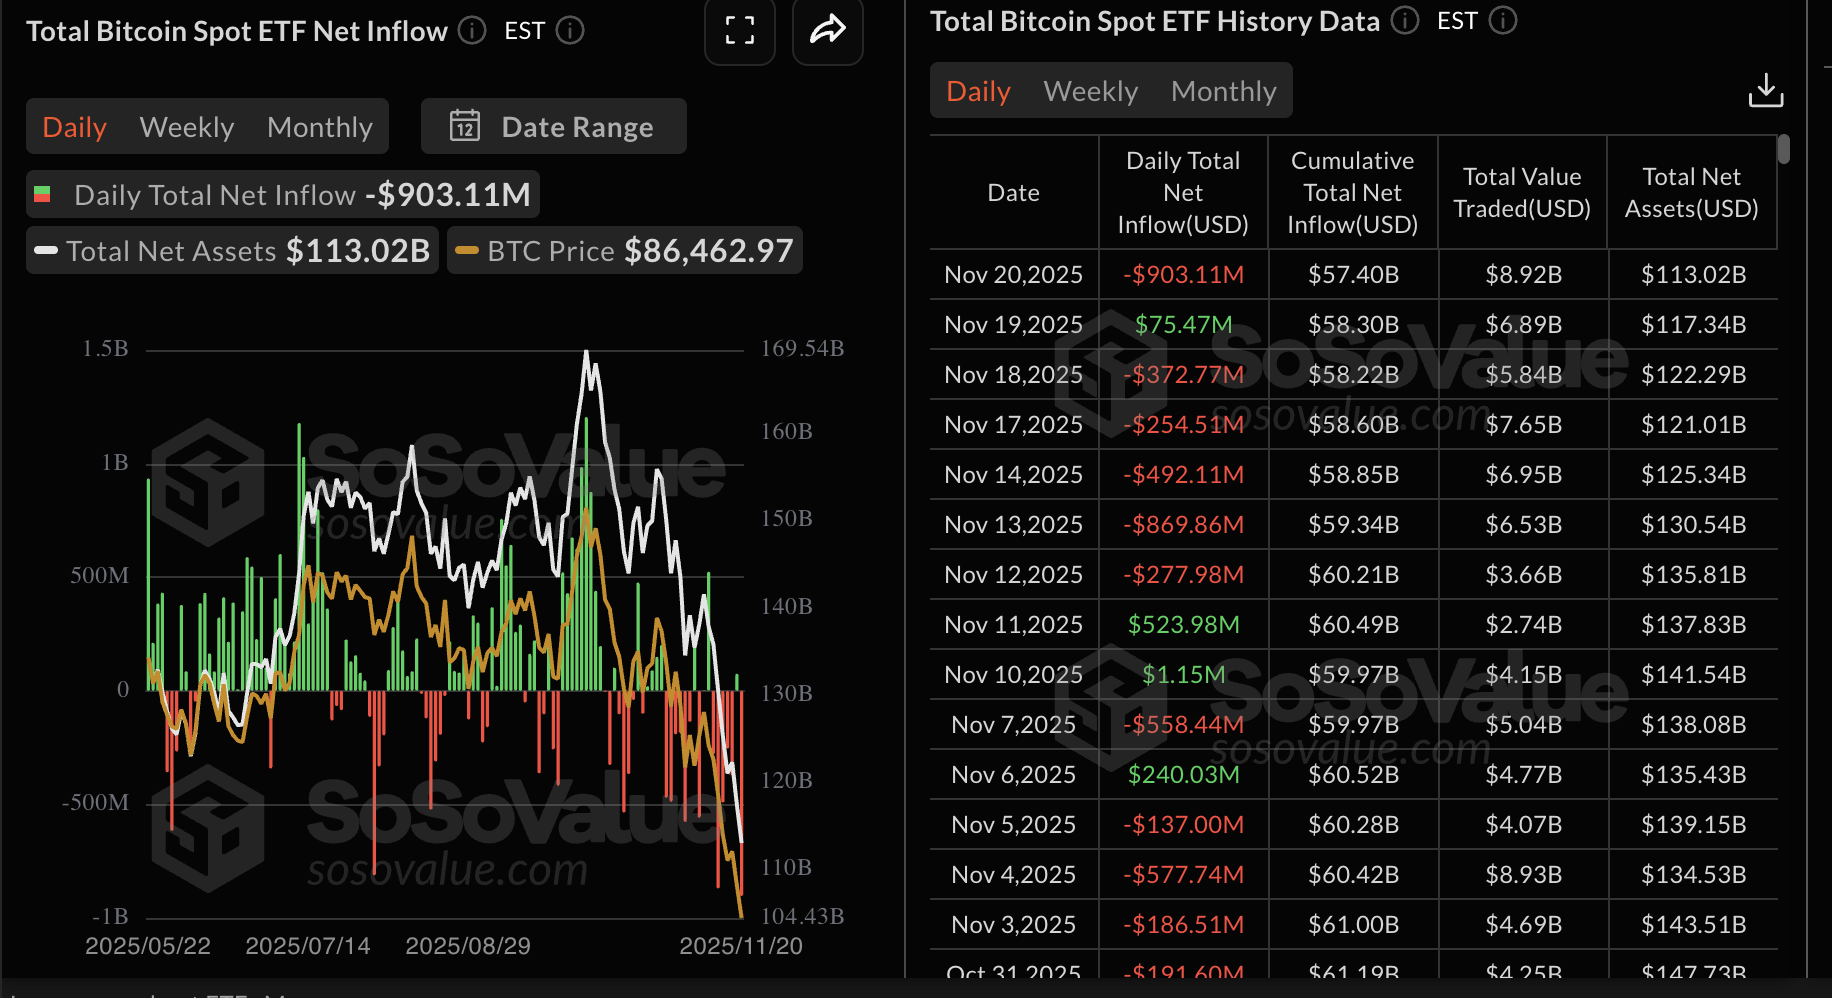
Bitcoin spot ETFs recorded outflows of $903 million on Thursday, the largest since November 13. This massive outflow underscores the risk-averse sentiment in the broader cryptocurrency market, with a mild $75 million inflow on Wednesday fading in comparison.
Bitcoin US-listed ETFs' cumulative net inflows average $57.4 billion, with net assets of $113 billion, according to SoSoValue data.
Steady outflows from ETFs are a sign of decreasing risk appetite, especially from institutional investors. If the trend persists, the sell-off could intensify toward the end of the year amid uncertainty around the Federal Reserve's (Fed) December monetary policy meeting.
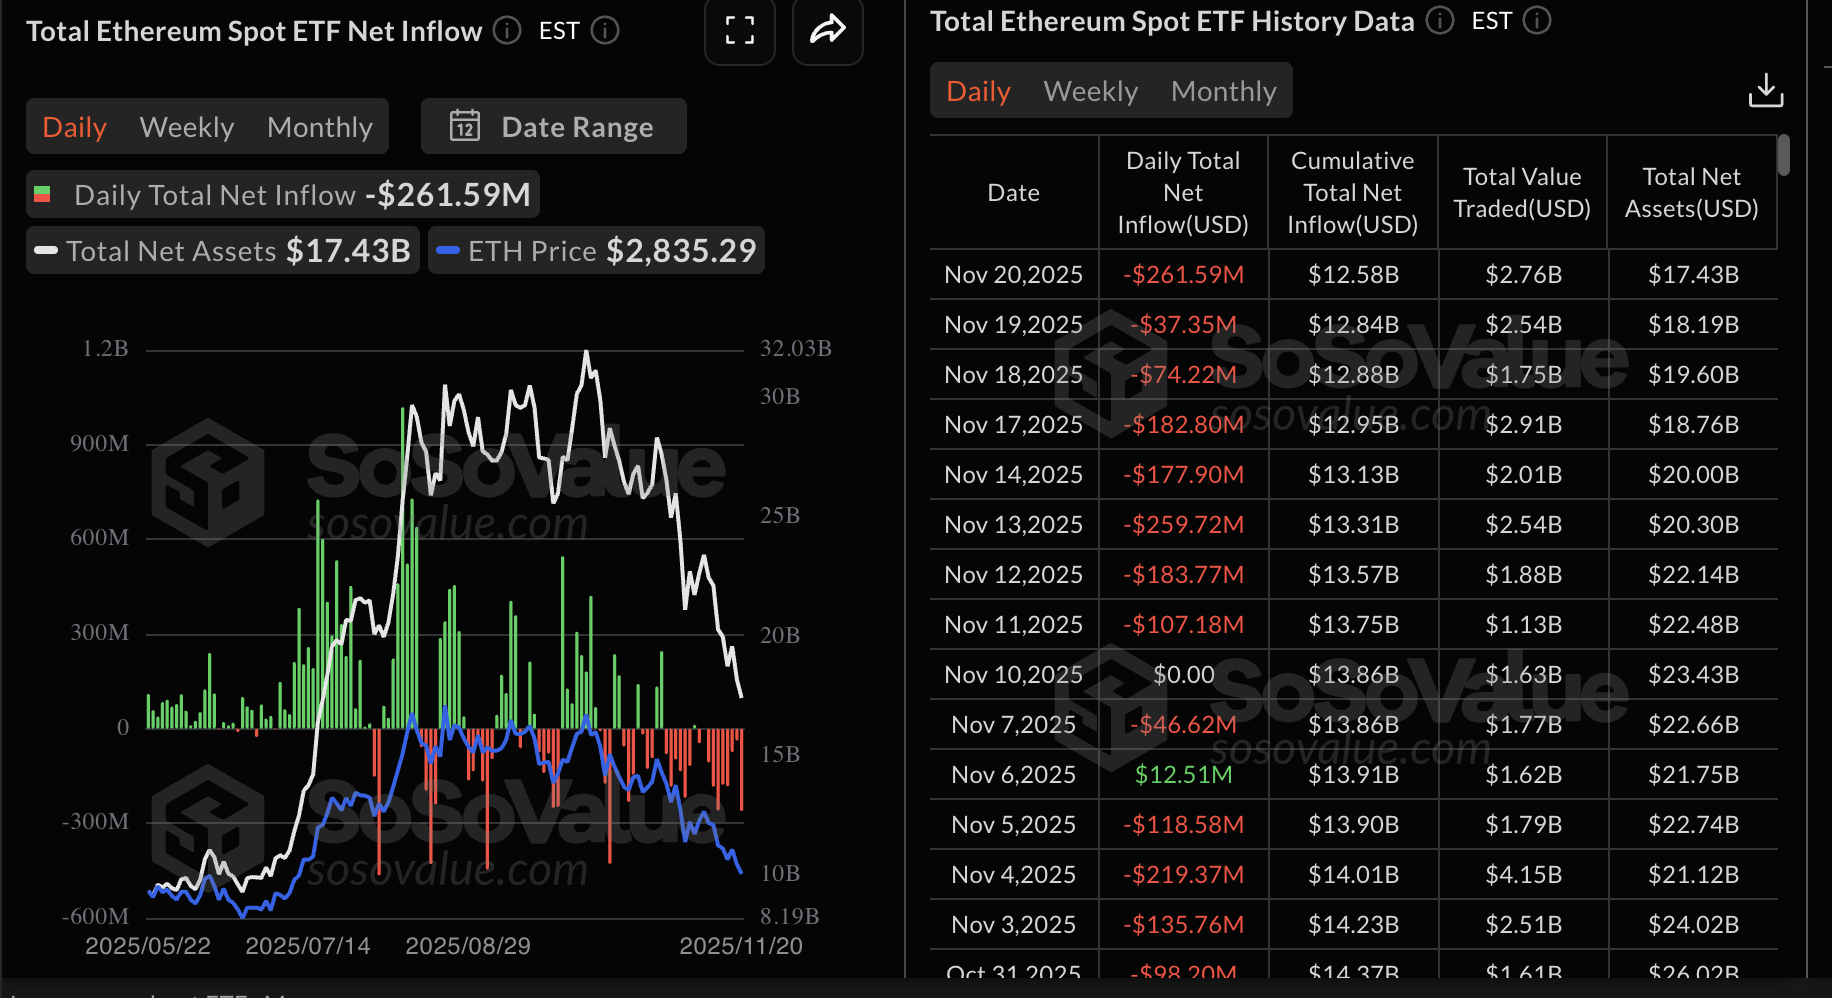
Ethereum ETFs are also on the back foot, with outflows totaling $262 million on Thursday. SoSoValue data shows that ETH ETFs have had only one day of inflows this month, highlighting the sticky risk-off sentiment as investors reduce their exposure to riskier assets.
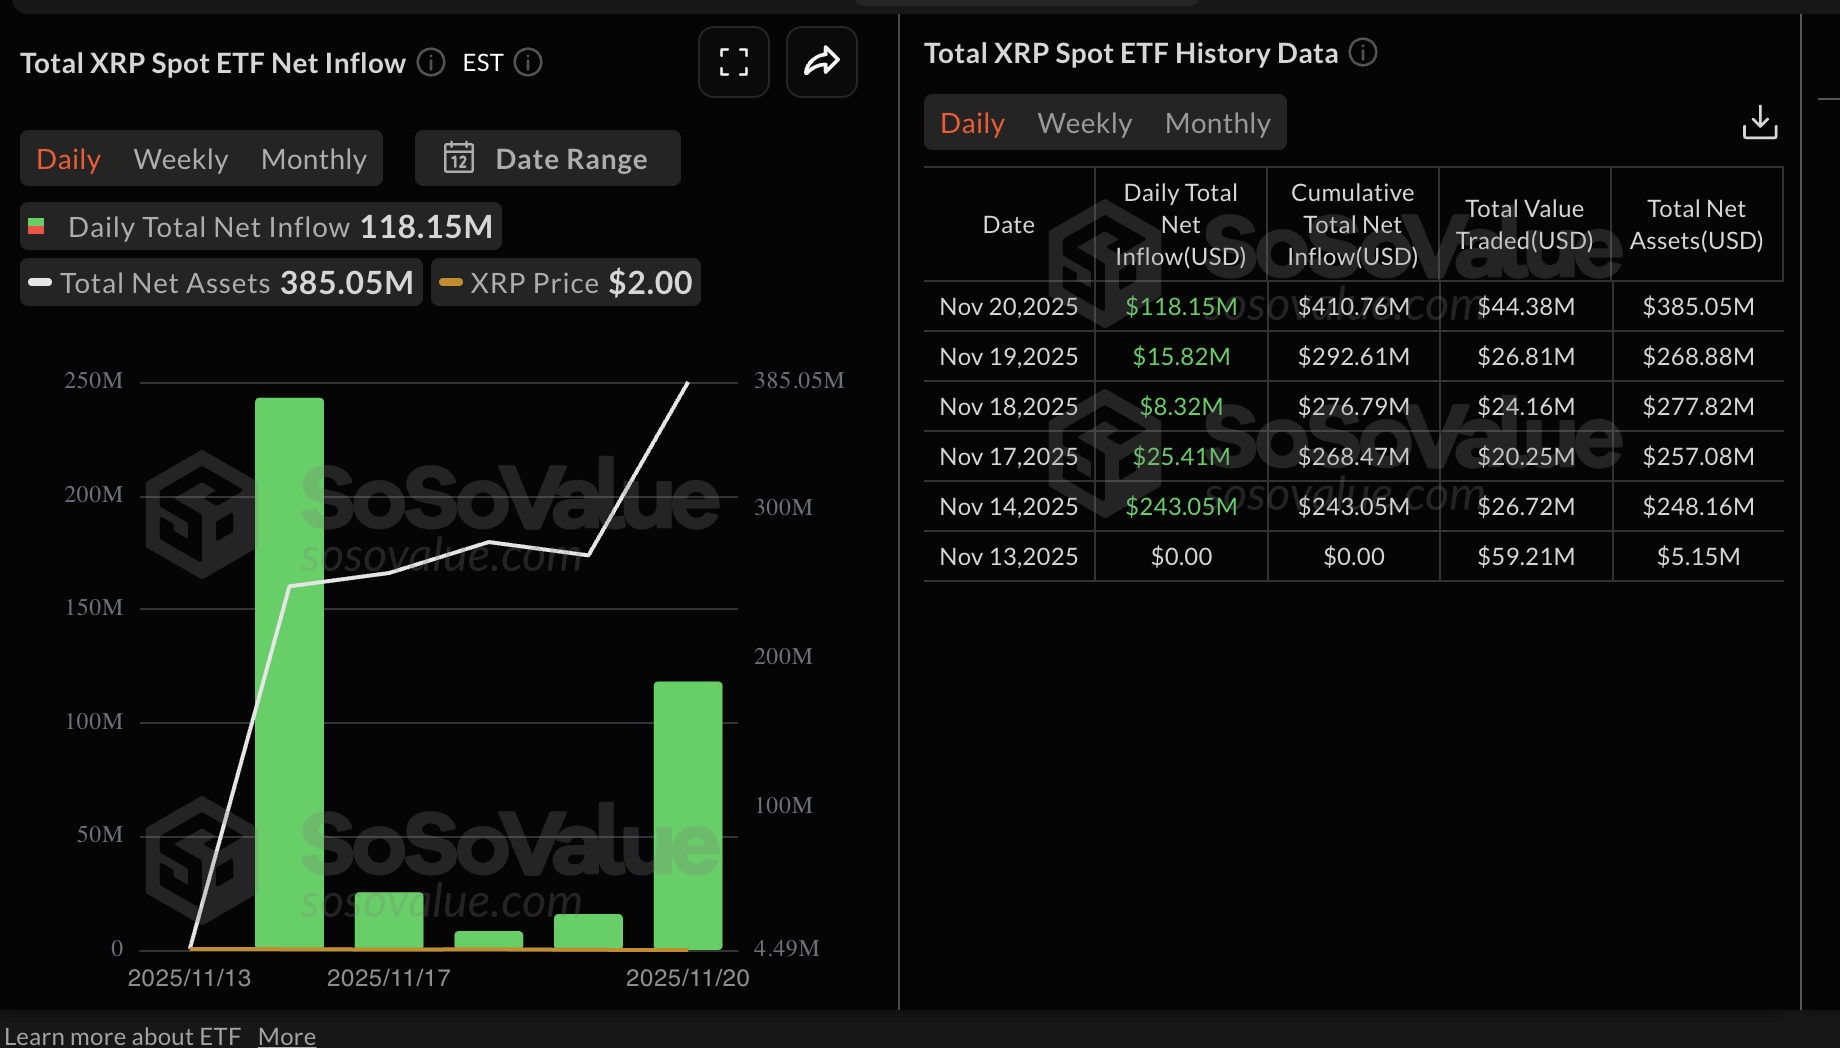
XRP ETFs, on the other hand, extended their inflow streak, with $118 million streaming in on Thursday. Two US-listed spot ETFs are operational in the US: Canary Capital's XRPC and Bitwise's XRP. They have a cumulative total net inflow of $411 million with next assets of $385 million.
However, XRP faces a weak derivatives market, with futures Open Interest (OI) falling to $3.57 billion on Friday, down from $3.79 billion the previous day. Retail demand has not picked up since mid-October.
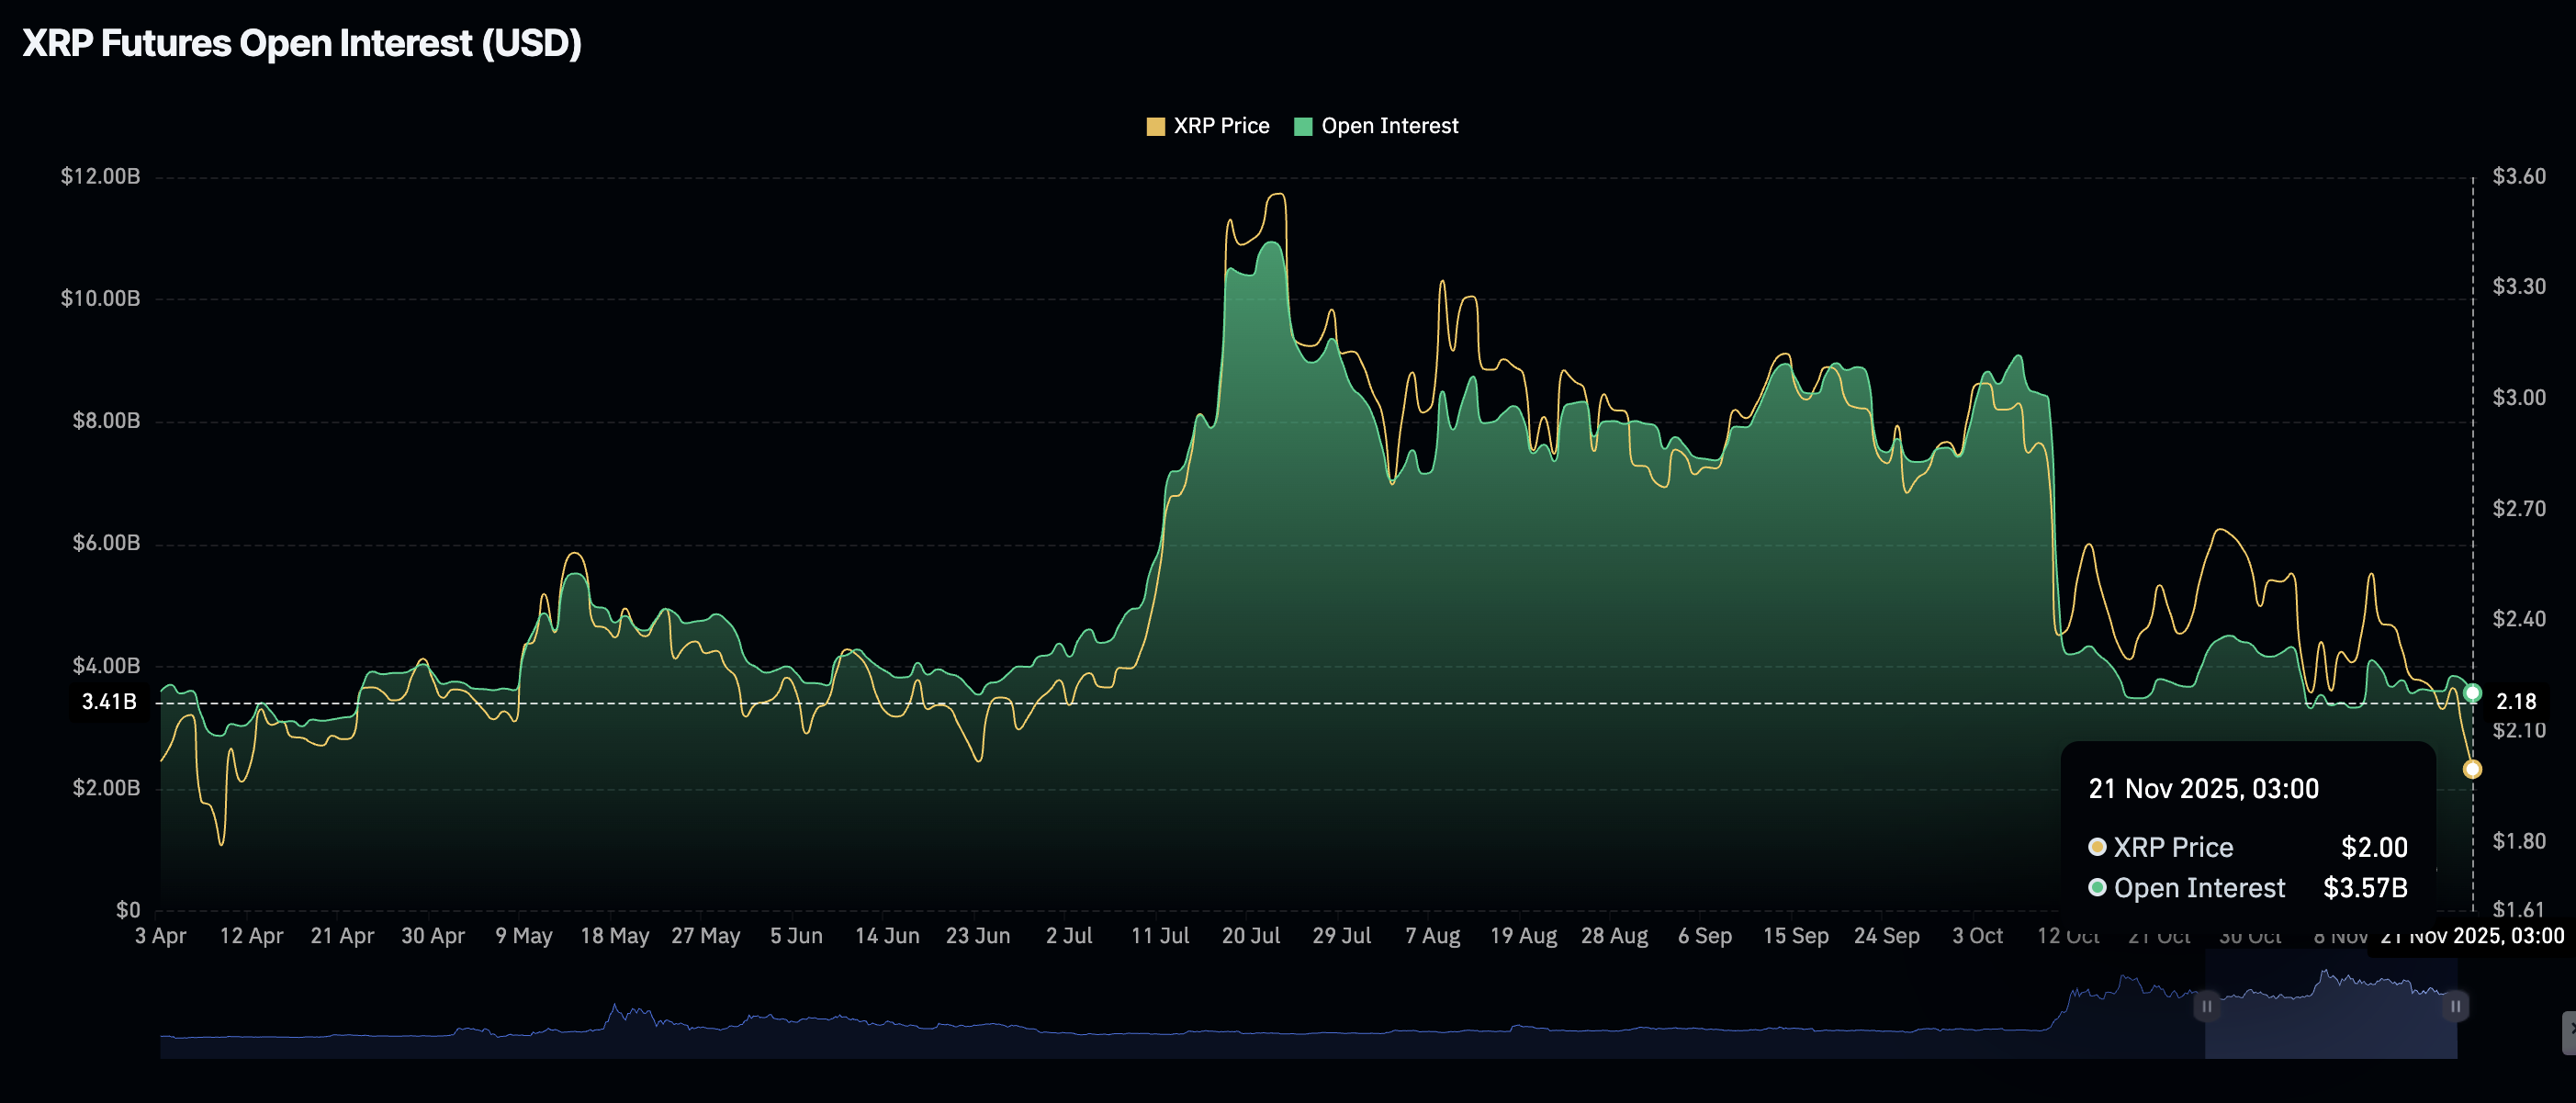
Chart of the day: Bitcoin slides as volatility soars
Bitcoin is trading at $82,435 at the time of writing on Friday. The 50-day Exponential Moving Average (EMA), the 100- and 200-day EMAs slope lower on the daily chart, with price well beneath $104,191, $107,700 and $106,570 respectively, reinforcing a bearish setup.
The Moving Average Convergence Divergence (MACD) indicator remains below the signal line and deep under the zero line, with a widening negative histogram that suggests strengthening bearish momentum. Similarly, the Relative Strength Index (RSI) at 21 (oversold) signals stretched weakness, implying that rebounds could be capped in the short term.
A break below the rising trend line from $74,561, with the breach occurring around 100,740, underscores the downside tone.
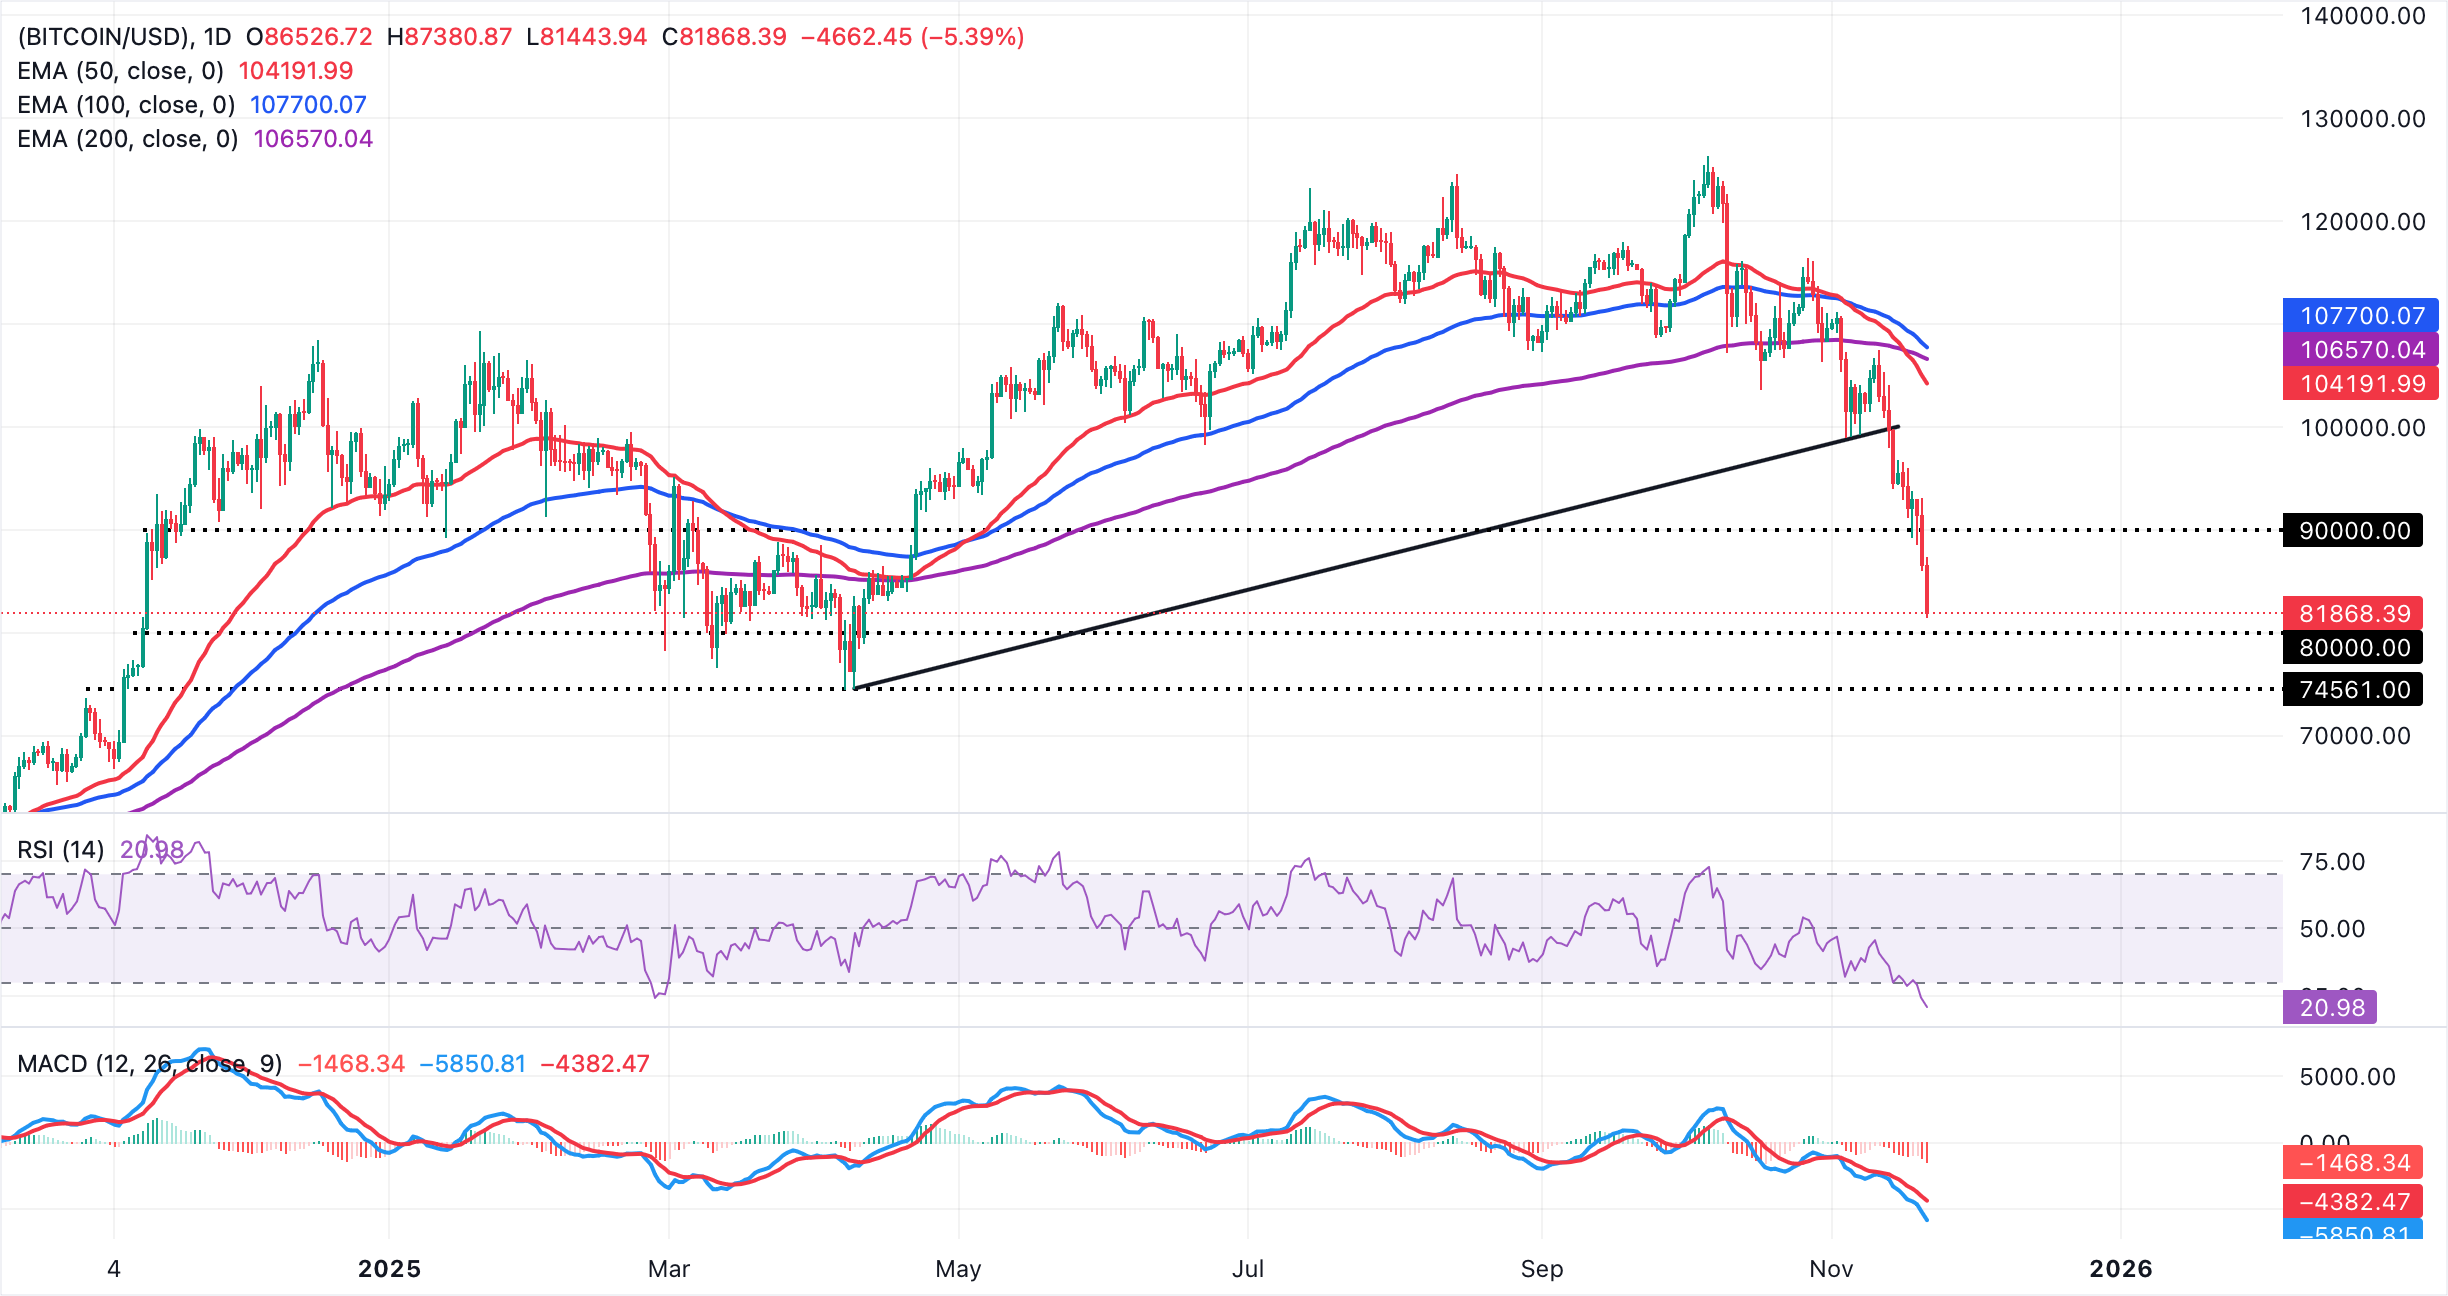
The MACD’s negative stance and expanding sub-zero histogram keep sellers in control, and RSI below 30 reinforces a bearish momentum backdrop. Until price reclaims key moving averages, rallies would be vulnerable, and the broader trend remains pressured beneath the declining curves.
Altcoins update: Ethereum, XRP sellers tighten grip
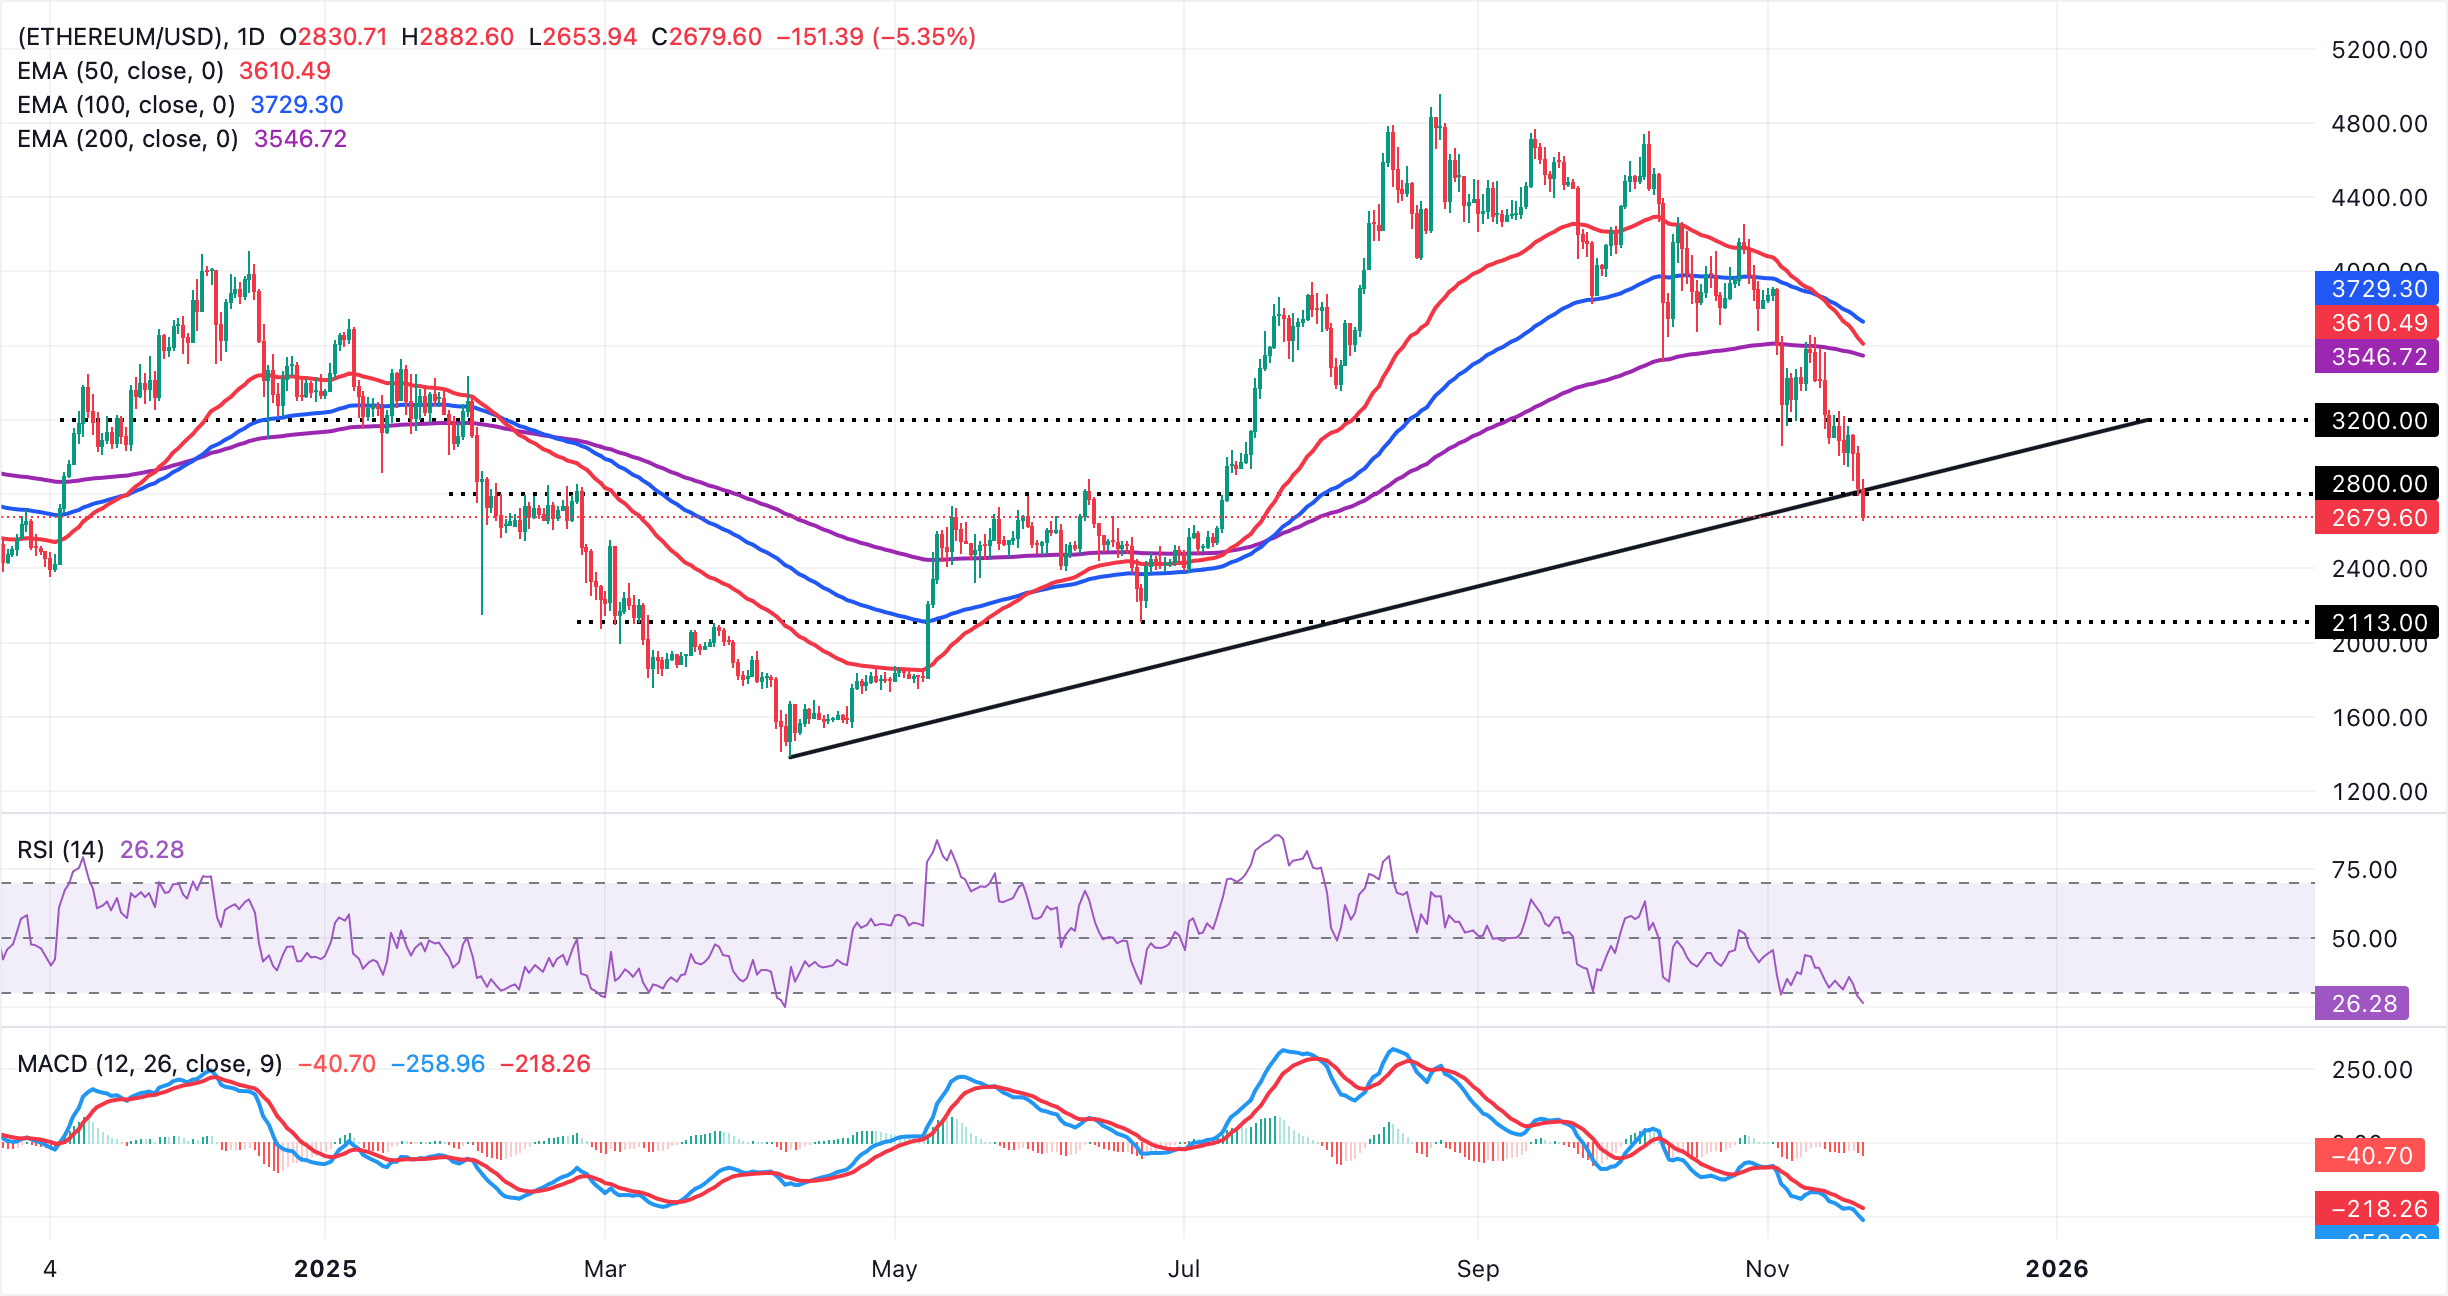
Ethereum is largely in bearish hands, trading at $2,679 at the time of writing on Friday. The smart contracts token sits well below the 50-, 100- and 200-day EMAs at $3,610, $3,729 and $3,546, keeping the short-term tone weak.
The MACD extends below the signal line and stays under zero on the daily chart, with a widening negative histogram that suggests strengthening bearish momentum. At the same time, the RSI at 26 (oversold) flags stretched downside conditions that could precede a pause. However, the bias stays bearish while the price trades beneath these moving averages.
A contraction in the negative MACD histogram and an RSI recovery above 30 would be early signs of stabilization, while failure to improve momentum would keep the downside pressure intact.
As for XRP, the price remains below the falling 50-, 100- and 200-day EMAs, preserving a bearish structure. The MACD indicator on the daily chart sits below the red signal line and under zero, with the negative histogram expanding, suggesting strengthening bearish momentum. The RSI at 30 is near oversold and continues to weaken. A descending trend line from $3.66, XRP's record high reached on July 18, caps rebounds with resistance around $2.72.
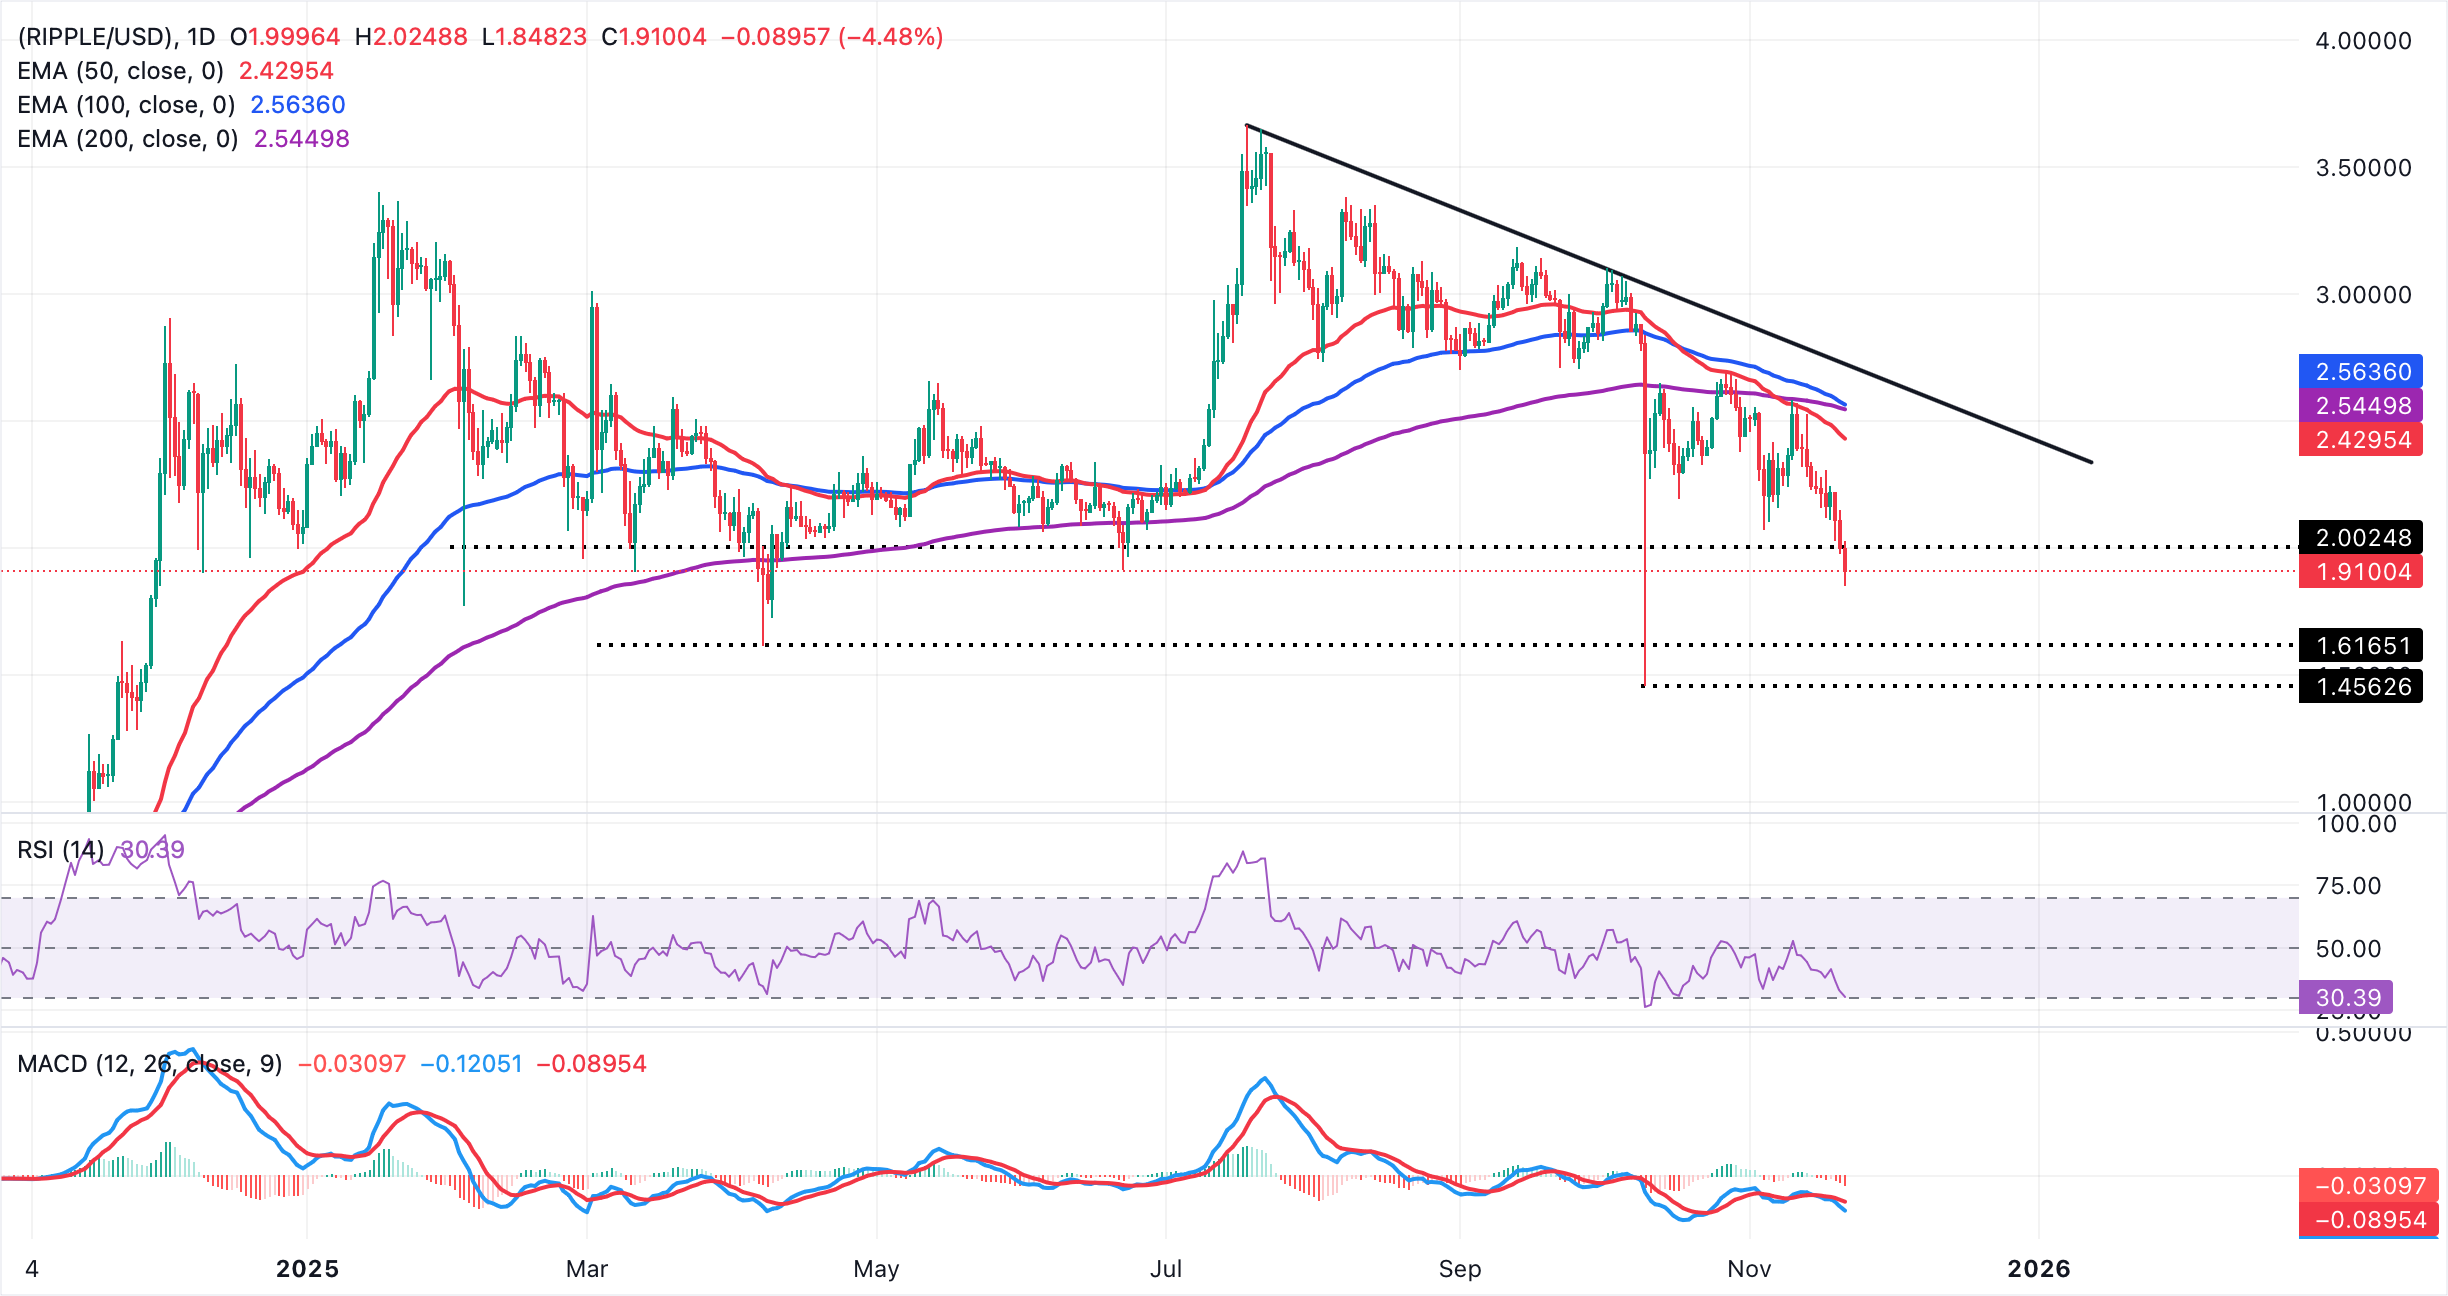
Bulls would need a daily close above the 50-day EMA at $2.42 to ease immediate pressure, opening the path toward the 200-day EMA at $2.54 and the 100-day EMA at $2.56. Below those hurdles, the bearish bias persists, while a topside break through the descending trend-line barrier would be required to shift the tone and extend recovery attempts.
Crypto ETF FAQs
An Exchange-Traded Fund (ETF) is an investment vehicle or an index that tracks the price of an underlying asset. ETFs can not only track a single asset, but a group of assets and sectors. For example, a Bitcoin ETF tracks Bitcoin’s price. ETF is a tool used by investors to gain exposure to a certain asset.
Yes. The first Bitcoin futures ETF in the US was approved by the US Securities & Exchange Commission in October 2021. A total of seven Bitcoin futures ETFs have been approved, with more than 20 still waiting for the regulator’s permission. The SEC says that the cryptocurrency industry is new and subject to manipulation, which is why it has been delaying crypto-related futures ETFs for the last few years.
Yes. The SEC approved in January 2024 the listing and trading of several Bitcoin spot Exchange-Traded Funds, opening the door to institutional capital and mainstream investors to trade the main crypto currency. The decision was hailed by the industry as a game changer.
The main advantage of crypto ETFs is the possibility of gaining exposure to a cryptocurrency without ownership, reducing the risk and cost of holding the asset. Other pros are a lower learning curve and higher security for investors since ETFs take charge of securing the underlying asset holdings. As for the main drawbacks, the main one is that as an investor you can’t have direct ownership of the asset, or, as they say in crypto, “not your keys, not your coins.” Other disadvantages are higher costs associated with holding crypto since ETFs charge fees for active management. Finally, even though investing in ETFs reduces the risk of holding an asset, price swings in the underlying cryptocurrency are likely to be reflected in the investment vehicle too.
(The technical analysis of this story was written with the help of an AI tool.)
Bài viết đề xuất


