Hyperliquid Price Forecast: HYPE reclaims $42 on rising DeFi TVL, retail demand 

Nguồn Fxstreet
  • Hyperliquid extends recovery as optimism for a bullish fourth quarter returns.
  • HYPE’s DeFi TVL increases 4% over the past 24 hours to $2.15 billion as investor confidence improves.
  • Retail demand for HYPE shows signs of a strong comeback, with the Open Interest-weighted funding rate rising to 0.0085%.

Hyperliquid (HYPE) is on the verge of a bullish breakout, rising above $42.00 at the time of writing on Monday. The perpetual Decentralised Exchange (DEX) native token mirrors a bullish wave spreading across the cryptocurrency market after the United States (US) Senate passed a bill to end the ongoing record-breaking government shutdown.

Hyperliquid DeFi TVL recovers backing risk-on sentiment 

Hyperliquid’s Decentralized Finance (DeFi) Total Value Locked (TVL) is up by nearly 4% over the last 24 hours to $2.15 billion, according to DefiLlama. 

Investors often increase their exposure to staking protocols within the ecosystem when they have confidence in the token’s ability to sustain short-term recovery. Higher staking volumes reduce the potential selling pressure in the open market, creating a suitable environment for a sustainable uptrend.
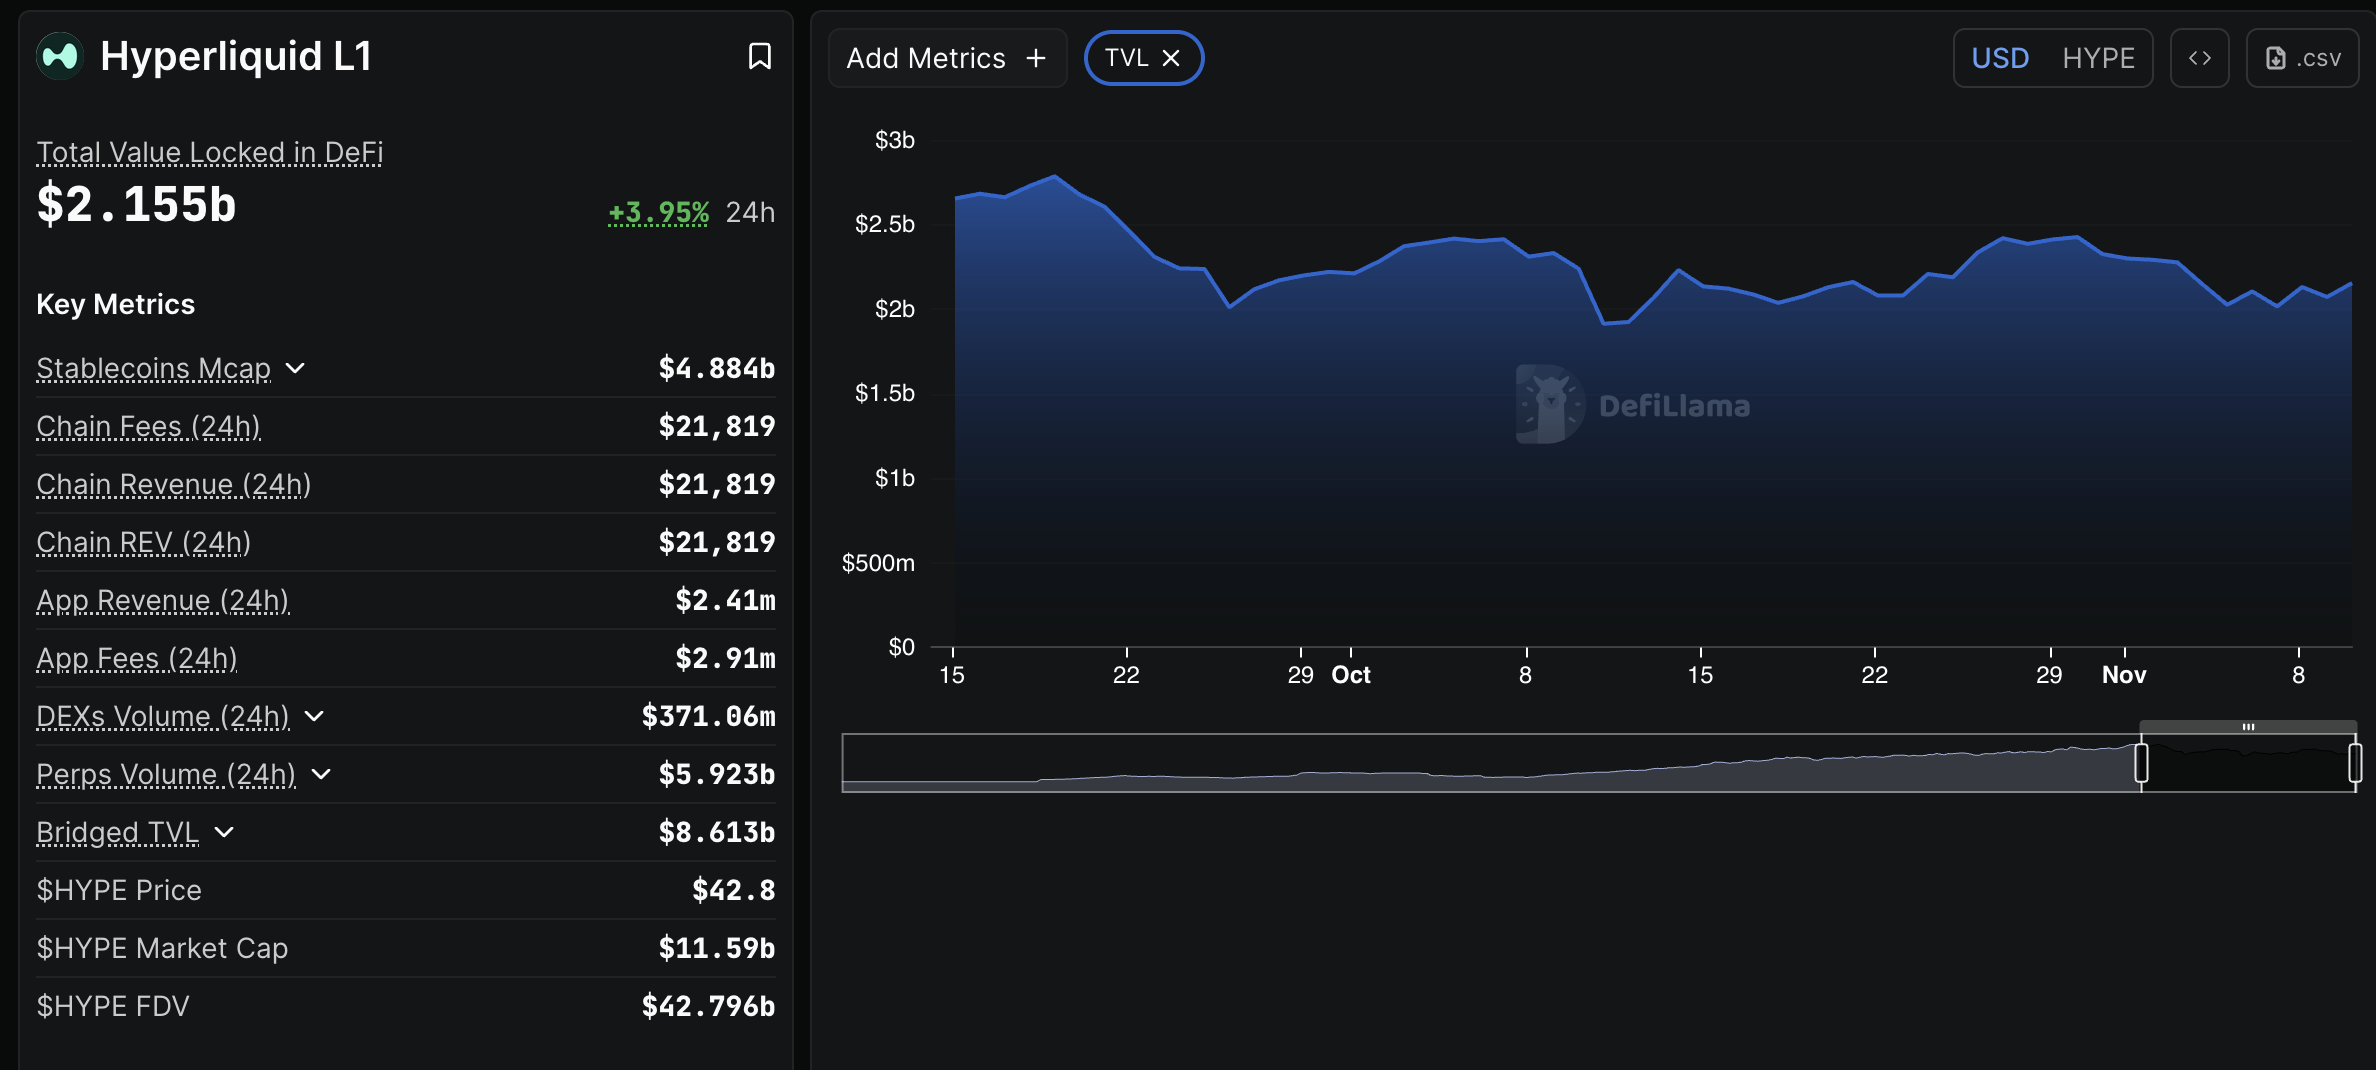
Hyperliquid DeFI TVL | Source: DefiLlama 

Traders are increasingly piling into Hyperliquid long positions, as evidenced by the Open Interest-Weighted Funding Rate metric’s lift to 0.0085% on Monday from 0.0060% the previous day. If risk-on sentiment steadies in the coming days, encouraging investors to increase their exposure, HYPE may sustain recovery, targeting highs above $50.00 in the short to medium term.
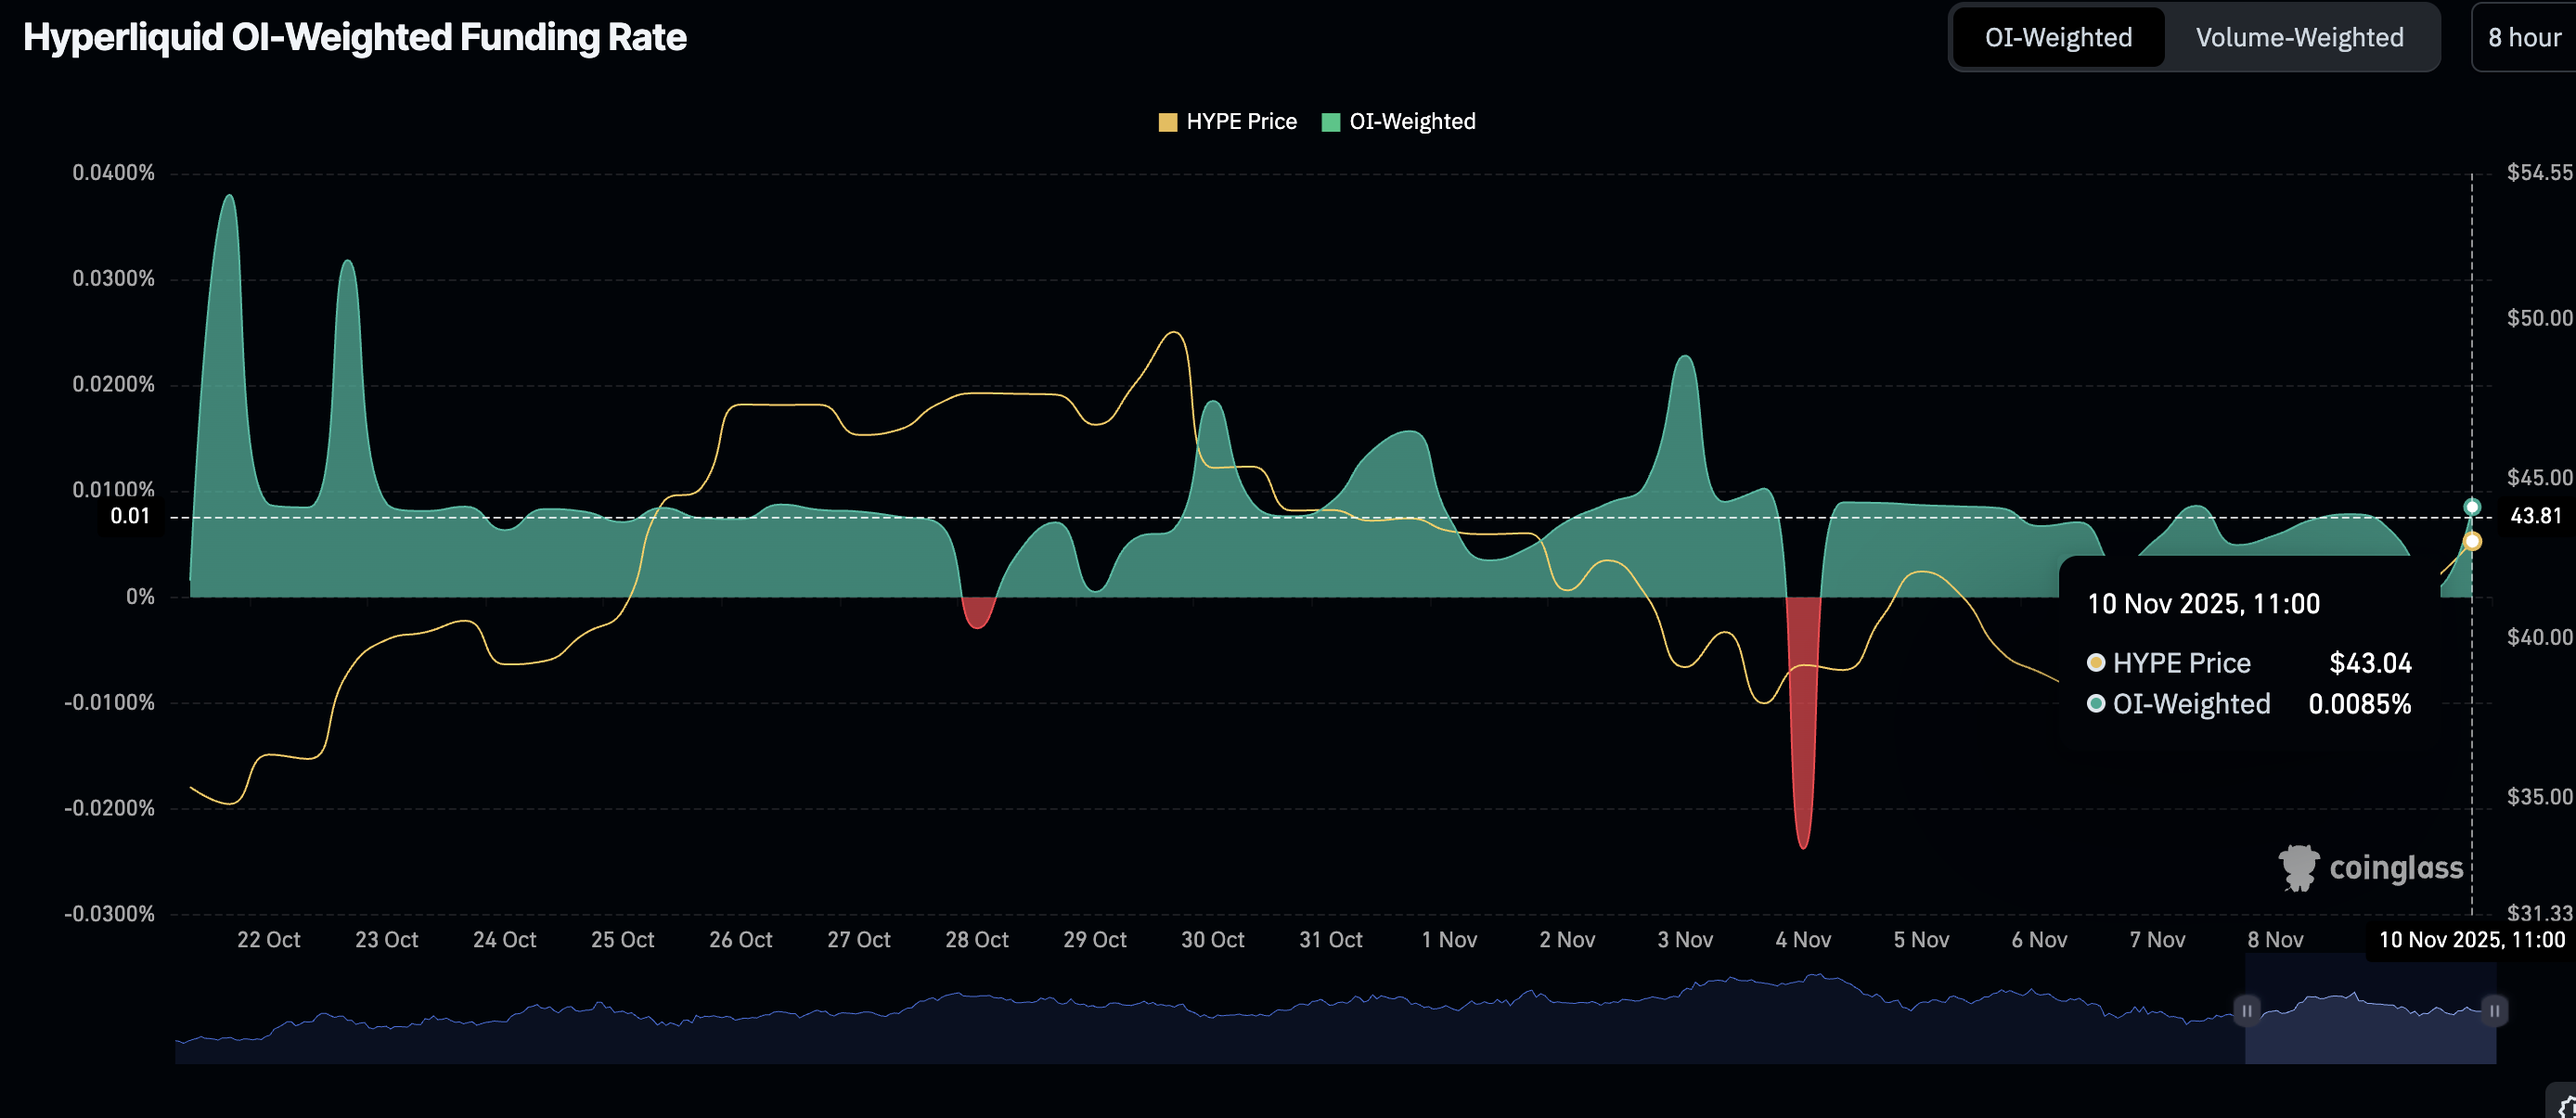
Hyperliquid OI-Weighted Funding Rate metric | Source: CoinGlass

Technical outlook: Assessing Hyperliquid’s bullish outlook

Technical analysis shows that bulls are slowly regaining control as Hyperliquid’s price rises alongside other cryptocurrencies. The token is trading marginally below the confluence of the 50-day and 100-day Exponential Moving Averages (EMAs) at around $42.64 at the time of writing on Monday.

The Relative Strength Index (RSI) is at 50, poised to confirm a bullish crossover on the same daily chart, increasing the odds of a steady short-term uptrend. Higher RSI readings would support HYPE’s bullish outlook.

Traders should also watch for a potential buy signal from the Moving Average Convergence Divergence (MACD) indicator. Such a signal occurs when the blue line crosses above the red signal line, encouraging investors to increase their risk exposure.
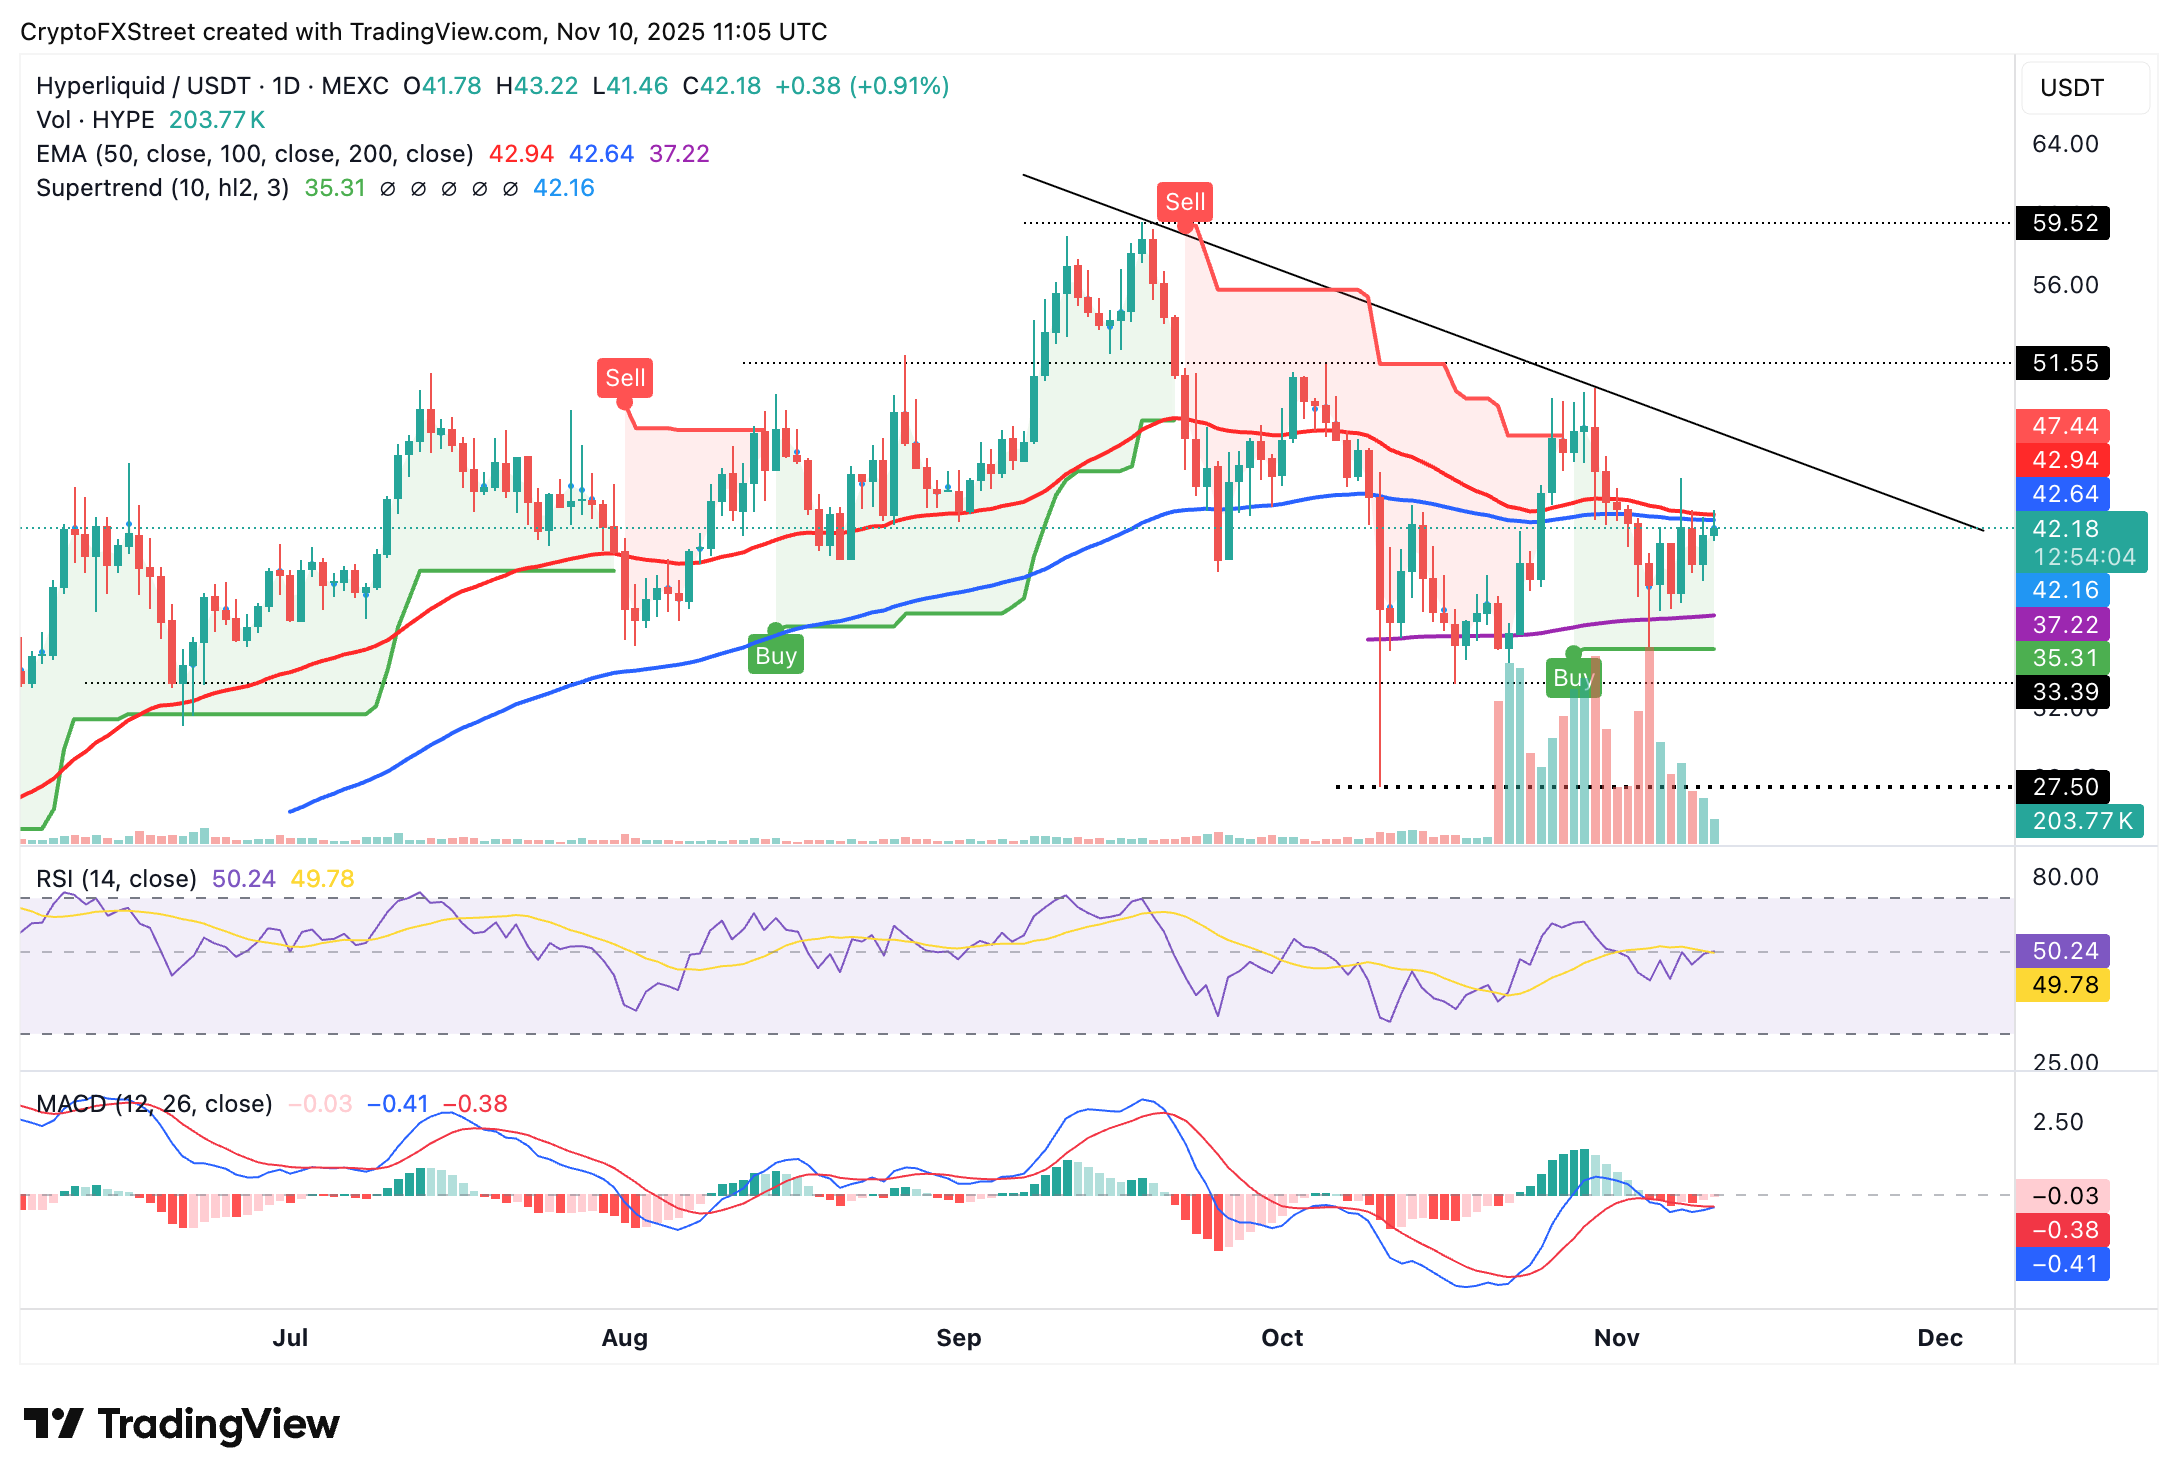
HYPE/USDT daily chart

The SuperTrend indicator has flipped below Hyperliquid’s price, marking a potential shift from bearish to bullish. Still, a correction may occur if HYPE fails to breach the confluence resistance at $42.64. The 200-day EMA at $37.22 will serve as the next primary support if a sell-off ensues below the critical $40.00 level.

Open Interest, funding rate FAQs

Higher Open Interest is associated with higher liquidity and new capital inflow to the market. This is considered the equivalent of increase in efficiency and the ongoing trend continues. When Open Interest decreases, it is considered a sign of liquidation in the market, investors are leaving and the overall demand for an asset is on a decline, fueling a bearish sentiment among investors.

Funding fees bridge the difference between spot prices and prices of futures contracts of an asset by increasing liquidation risks faced by traders. A consistently high and positive funding rate implies there is a bullish sentiment among market participants and there is an expectation of a price hike. A consistently negative funding rate for an asset implies a bearish sentiment, indicating that traders expect the cryptocurrency’s price to fall and a bearish trend reversal is likely to occur.


Tuyên bố miễn trừ trách nhiệm: Chỉ dành cho mục đích thông tin. Hiệu suất trong quá khứ không đảm bảo cho kết quả trong tương lai.
placeholder
Nhìn lại lịch sử giá vàng trong 50 năm qua. Liệu vàng còn tiếp tục thời kỳ hoàng kim thêm 50 năm nữa? Trong 50 năm qua, vàng vẫn luôn giữ được vị thế là tài sản được ưa chuộng và phổ biến nhất thế giới. Giao dịch vàng luôn được các nhà đầu tư quan tâm do mức độ thanh khoản cao và tầm ảnh hưởng lớn đến toàn bộ thị trường tài chính. Vậy, lịch sử giá vàng như thế nào và cách đầu tư vàng ra sao? Chúng ta sẽ cùng tìm hiểu qua bài viết dưới đây.
Tác giả  Nhóm Traderins
ngày11 tháng 12 năm 2023
Trong 50 năm qua, vàng vẫn luôn giữ được vị thế là tài sản được ưa chuộng và phổ biến nhất thế giới. Giao dịch vàng luôn được các nhà đầu tư quan tâm do mức độ thanh khoản cao và tầm ảnh hưởng lớn đến toàn bộ thị trường tài chính. Vậy, lịch sử giá vàng như thế nào và cách đầu tư vàng ra sao? Chúng ta sẽ cùng tìm hiểu qua bài viết dưới đây.
placeholder
Tiềm Năng Giao Dịch Tháng 3 Sản Phẩm Đáng Chú Ý Trong tháng 3/2025, thị trường tài chính sẽ đón nhận loạt sự kiện quan trọng khi Cục Dự Trữ Liên Bang, Ngân Hàng Trung Ương Châu Âu (ECB) và Ngân Hàng Trung Ương Nhật Bản (BOJ) công bố quyết định lãi suất. Chính sách thuế quan của Trump gây ra biến động mạnh trên nhiều sản phẩm tài chính. Làm thế nào để tận dụng cơ hội giao dịch? Dưới đây là 5 sản phẩm giao dịch đáng chú ý:
Tác giả  Mitrade
3 tháng 05 ngày Thứ Tư
Trong tháng 3/2025, thị trường tài chính sẽ đón nhận loạt sự kiện quan trọng khi Cục Dự Trữ Liên Bang, Ngân Hàng Trung Ương Châu Âu (ECB) và Ngân Hàng Trung Ương Nhật Bản (BOJ) công bố quyết định lãi suất. Chính sách thuế quan của Trump gây ra biến động mạnh trên nhiều sản phẩm tài chính. Làm thế nào để tận dụng cơ hội giao dịch? Dưới đây là 5 sản phẩm giao dịch đáng chú ý:
placeholder
EUR/USD di chuyển xuống dưới 1,1700, đà giảm có vẻ bị hạn chế do giọng điệu ôn hòa của FedEUR/USD giảm nhẹ sau khi ghi nhận mức tăng khoảng 0,5% trong phiên giao dịch trước, giao dịch quanh mức 1,1690 trong giờ châu Á vào thứ Hai
Tác giả  BeInCrypto
8 tháng 18 ngày Thứ Hai
EUR/USD giảm nhẹ sau khi ghi nhận mức tăng khoảng 0,5% trong phiên giao dịch trước, giao dịch quanh mức 1,1690 trong giờ châu Á vào thứ Hai
placeholder
Chỉ số Dow Jones Industrial Average đạt mức cao kỷ lục mới khi thu nhập thúc đẩy cổ phiếu tăng caoChỉ số công nghiệp trung bình Dow Jones (DJIA) đã tăng vọt lên mức cao kỷ lục vào thứ Ba, kiểm tra trên 47.000 và ghi nhận mức cao nhất trong ngày mới là 47.126. Các cổ phiếu 'nền kinh tế cũ' từ các công ty sản xuất hàng hóa vật chất thay vì dịch vụ và phần cứng thông tin hoặc công nghệ đã tăng mạnh sau đó
Tác giả  FXStreet
10 tháng 22 ngày Thứ Tư
Chỉ số công nghiệp trung bình Dow Jones (DJIA) đã tăng vọt lên mức cao kỷ lục vào thứ Ba, kiểm tra trên 47.000 và ghi nhận mức cao nhất trong ngày mới là 47.126. Các cổ phiếu 'nền kinh tế cũ' từ các công ty sản xuất hàng hóa vật chất thay vì dịch vụ và phần cứng thông tin hoặc công nghệ đã tăng mạnh sau đó
placeholder
Dự báo giá vàng: XAU/USD tăng lên gần 4.050$ trong bối cảnh lo ngại về nền kinh tế MỹGiá vàng (XAU/USD) giao dịch trong lãnh thổ tích cực quanh mức 4.050$ trong phiên giao dịch đầu ngày thứ Hai ở châu Á. Kim loại quý tăng nhẹ khi dữ liệu việc làm tư nhân của Mỹ cho thấy thị trường lao động yếu kém, hỗ trợ cho việc cắt giảm lãi suất của Mỹ.
Tác giả  FXStreet
8 giờ trước
Giá vàng (XAU/USD) giao dịch trong lãnh thổ tích cực quanh mức 4.050$ trong phiên giao dịch đầu ngày thứ Hai ở châu Á. Kim loại quý tăng nhẹ khi dữ liệu việc làm tư nhân của Mỹ cho thấy thị trường lao động yếu kém, hỗ trợ cho việc cắt giảm lãi suất của Mỹ.
goTop
quote