

ApeCoin Price Prediction: An 8% fall seems likely for APE with multiple bearish signals at play

Nguồn Fxstreet
  • ApeCoin price remains below the foothold of the centerline of the Bollinger indicator, with several other technical indicators flashing bearish.
  • APE could fall 8% to the $1.24 support level, last tested on January 23.
  • Invalidation of the bearish thesis will occur upon a candlestick close above $1.60.

ApeCoin (APE) price is trading with a bearish bias, trapped within the confines of the Bollinger indicator. With the upper and lower bands of this technical tool coming together, the volatility contraction could see APE record a bold move soon.

Also Read: ApeCoin price climbs 5% as gaming narrative revitalizes social metrics for APE

ApeCoin price coils up for a bold move

ApeCoin (APE) price is below the centerline of the Bollinger indicator at $1.38, with an analyst saying such a position could precede a move lower once the volatility contraction is over and volatility expansion takes place.

The position of the Relative Strength Index (RSI) below 50 accentuates the bearish outlook. This momentum indicator is not only southbound, pointing to falling momentum, but has also executed a sell signal after crossing below the signal line (yellow band).

Furthermore, both the Awesome Oscillator (AO) and the Moving Average Convergence Divergence (MACD) indicators are in negative territory, below their respective mean lines.

Increased selling pressure could see ApeCoin price drop to breach the lower band of the Bollinger indicator at $1.29.

An extended fall could see the altcoin’s market value roll over to the $1.24 support, levels last tested on January 23. Such a move would constitute an 8% drop below current levels.

In the dire case, the altcoin’s market value could dwindle all the way to the bottom of the market range at $1.02.
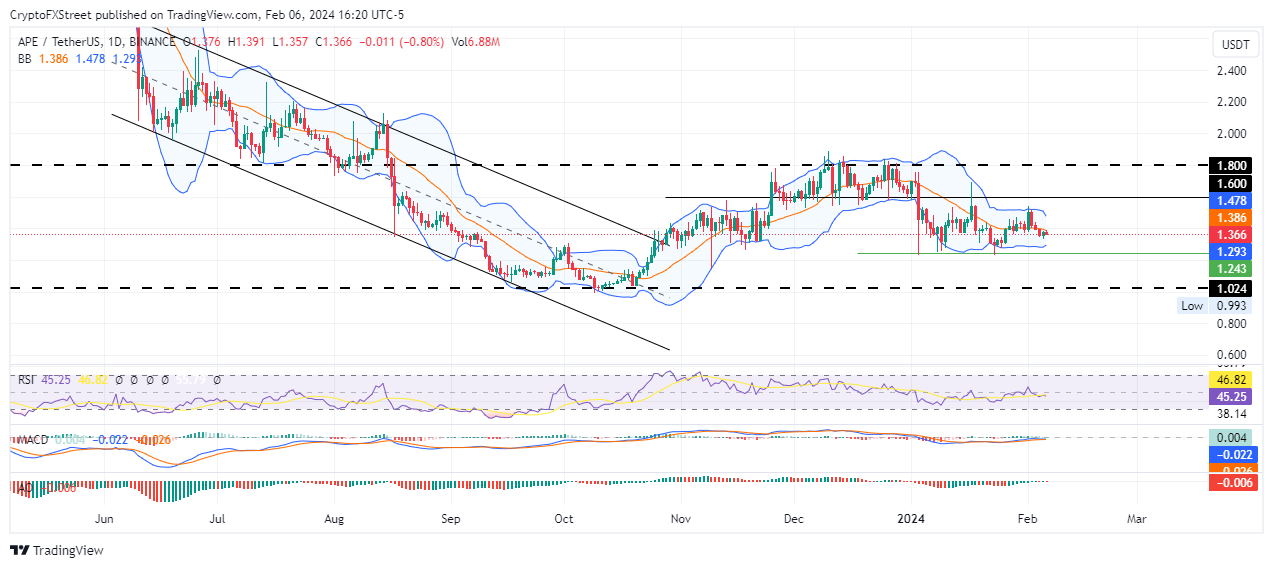

APE/USDT 1-day chart

On the other hand, if sidelined investors and late buyers buy the dip, the ensuing buyer momentum could see ApeCoin price push north. Overcoming the centerline would bring the upper band of the Bollinger indicator into focus at $1.47. A decisive breach of this supplier congestion level, confirmed by a stable close above the $1.60 threshold would invalidate the bearish thesis.

In a highly bullish case, ApeCoin price could extend a neck higher, tagging the $1.80 psychological level, 30% above current levels. 

Tuyên bố miễn trừ trách nhiệm: Chỉ dành cho mục đích thông tin. Hiệu suất trong quá khứ không đảm bảo cho kết quả trong tương lai.
placeholder
Nhìn lại lịch sử giá vàng trong 50 năm qua. Liệu vàng còn tiếp tục thời kỳ hoàng kim thêm 50 năm nữa? Trong 50 năm qua, vàng vẫn luôn giữ được vị thế là tài sản được ưa chuộng và phổ biến nhất thế giới. Giao dịch vàng luôn được các nhà đầu tư quan tâm do mức độ thanh khoản cao và tầm ảnh hưởng lớn đến toàn bộ thị trường tài chính. Vậy, lịch sử giá vàng như thế nào và cách đầu tư vàng ra sao? Chúng ta sẽ cùng tìm hiểu qua bài viết dưới đây.
Tác giả  Nhóm Traderins
ngày11 tháng 12 năm 2023
Trong 50 năm qua, vàng vẫn luôn giữ được vị thế là tài sản được ưa chuộng và phổ biến nhất thế giới. Giao dịch vàng luôn được các nhà đầu tư quan tâm do mức độ thanh khoản cao và tầm ảnh hưởng lớn đến toàn bộ thị trường tài chính. Vậy, lịch sử giá vàng như thế nào và cách đầu tư vàng ra sao? Chúng ta sẽ cùng tìm hiểu qua bài viết dưới đây.
placeholder
Top 3 Price Prediction: BTC breakdown hints at deeper correction as ETH and XRP extend lossesBitcoin (BTC), Ethereum (ETH) and Ripple (XRP) prices are extending losses on Monday after falling slightly the previous week. BTC is slipping below the lower consolidation range at $65,000, and ETH is falling below $1,900, both extending their six-week losing streaks.
Tác giả  FXStreet
2 tháng 23 ngày Thứ Hai
Bitcoin (BTC), Ethereum (ETH) and Ripple (XRP) prices are extending losses on Monday after falling slightly the previous week. BTC is slipping below the lower consolidation range at $65,000, and ETH is falling below $1,900, both extending their six-week losing streaks.
placeholder
Đô la Úc duy trì mức giảm trước quyết định chính sách của RBAAUD/USD kéo dài mức lỗ trong ngày thứ hai liên tiếp, giao dịch quanh mức 0,7160 trong giờ châu Á vào thứ Ba. Các nhà giao dịch kỳ vọng Ngân hàng Dự trữ Úc (RBA) sẽ thực hiện một đợt tăng lãi suất vào cuối ngày.
Tác giả  FXStreet
5 tháng 05 ngày Thứ Ba
AUD/USD kéo dài mức lỗ trong ngày thứ hai liên tiếp, giao dịch quanh mức 0,7160 trong giờ châu Á vào thứ Ba. Các nhà giao dịch kỳ vọng Ngân hàng Dự trữ Úc (RBA) sẽ thực hiện một đợt tăng lãi suất vào cuối ngày.
placeholder
Đô la Úc giảm gần về 0,7250, cuộc đàm phán Trump–Tập được chú ýCặp AUD/USD mất điểm gần 0,7250 trong giờ giao dịch châu Á vào thứ Năm. Dữ liệu lạm phát của Mỹ nóng hơn dự kiến cung cấp một số hỗ trợ cho đồng đô la Mỹ (USD) so với đồng đô la Úc (AUD)
Tác giả  FXStreet
5 tháng 14 ngày Thứ Năm
Cặp AUD/USD mất điểm gần 0,7250 trong giờ giao dịch châu Á vào thứ Năm. Dữ liệu lạm phát của Mỹ nóng hơn dự kiến cung cấp một số hỗ trợ cho đồng đô la Mỹ (USD) so với đồng đô la Úc (AUD)
placeholder
Dự báo giá bạc: Phe đầu cơ giá lên XAG/USD nhắm mục tiêu vượt qua ngưỡng kháng cự hội tụ 76,75$Bạc (XAG/USD) được cho là đang hình thành dựa trên đà phục hồi của ngày trước đó từ vùng gần mức thấp nhất trong gần hai tuần, khoảng khu vực 73,00$, và đạt được lực kéo tích cực trong ngày thứ hai liên tiếp vào thứ Năm
Tác giả  FXStreet
5 tháng 21 ngày Thứ Năm
Bạc (XAG/USD) được cho là đang hình thành dựa trên đà phục hồi của ngày trước đó từ vùng gần mức thấp nhất trong gần hai tuần, khoảng khu vực 73,00$, và đạt được lực kéo tích cực trong ngày thứ hai liên tiếp vào thứ Năm
sản phẩm liên quan
goTop
quote