
Top 3 gainers Bittensor, Akash Network, Saros: AI tokens steady amid wider market consolidation
- Bittensor holds firmly above the key moving averages, including the 50-day EMA, as bulls target a breakout past $400.
- Akash Network breaks above the long-term downtrend, but supply zone pressure at the 200-day EMA stalls gains.
- Saros consolidates gains following a massive breakout to $0.16, eyeing further upside amid overbought conditions.
The broader cryptocurrency market is in a consolidation rut, with Bitcoin (BTC) holding above $94,000. However, select Artificial Intelligence (AI) tokens, including Bittensor, Akash Network and Saros, have remained steady in the last 24 hours. This positive outlook on AI tokens comes a day after United States (US) President Donald Trump attended the “Crypto & AI Innovators Dinner,” hosted by MAGA Inc.
According to CNBC, the dinner, one of two that President Trump will be attending in May, is part of his commitment to supporting innovation in the cryptocurrency and AI industries.
The second dinner, on May 2, is an opportunity for the top 220 TRUMP meme coin holders to meet the President in a move tailored to providing support for the token launched days before his inauguration.
Bittensor seeks uptrend continuation
Bittensor (TAO), the token powering a robust decentralized network for collaborative machine learning, exchanges hands at $366 at the time of writing on Tuesday, down nearly 3% on the day but holding onto gains accrued in the past 24 hours.
TAO, the native token on the network, allowing miners to contribute AI models in exchange for rewards, has risen by 68% in the last month. Bittensor’s recovery from the tariff shocks in April reflects rising interest in decentralized AI systems, as several crypto funds now hold significant TAO positions. This highlights the growing significance of AI and blockchain convergence.
Bittensor’s price sits firmly above key moving averages, including the 50-day, 100-day, and 200-day Exponential Moving Averages (EMAs). While TAO retreated slightly after encountering resistance at $390, a reversal from the 200-day EMA support at $361 could rebuild trader confidence in the uptrend, eyeing highs past $400.
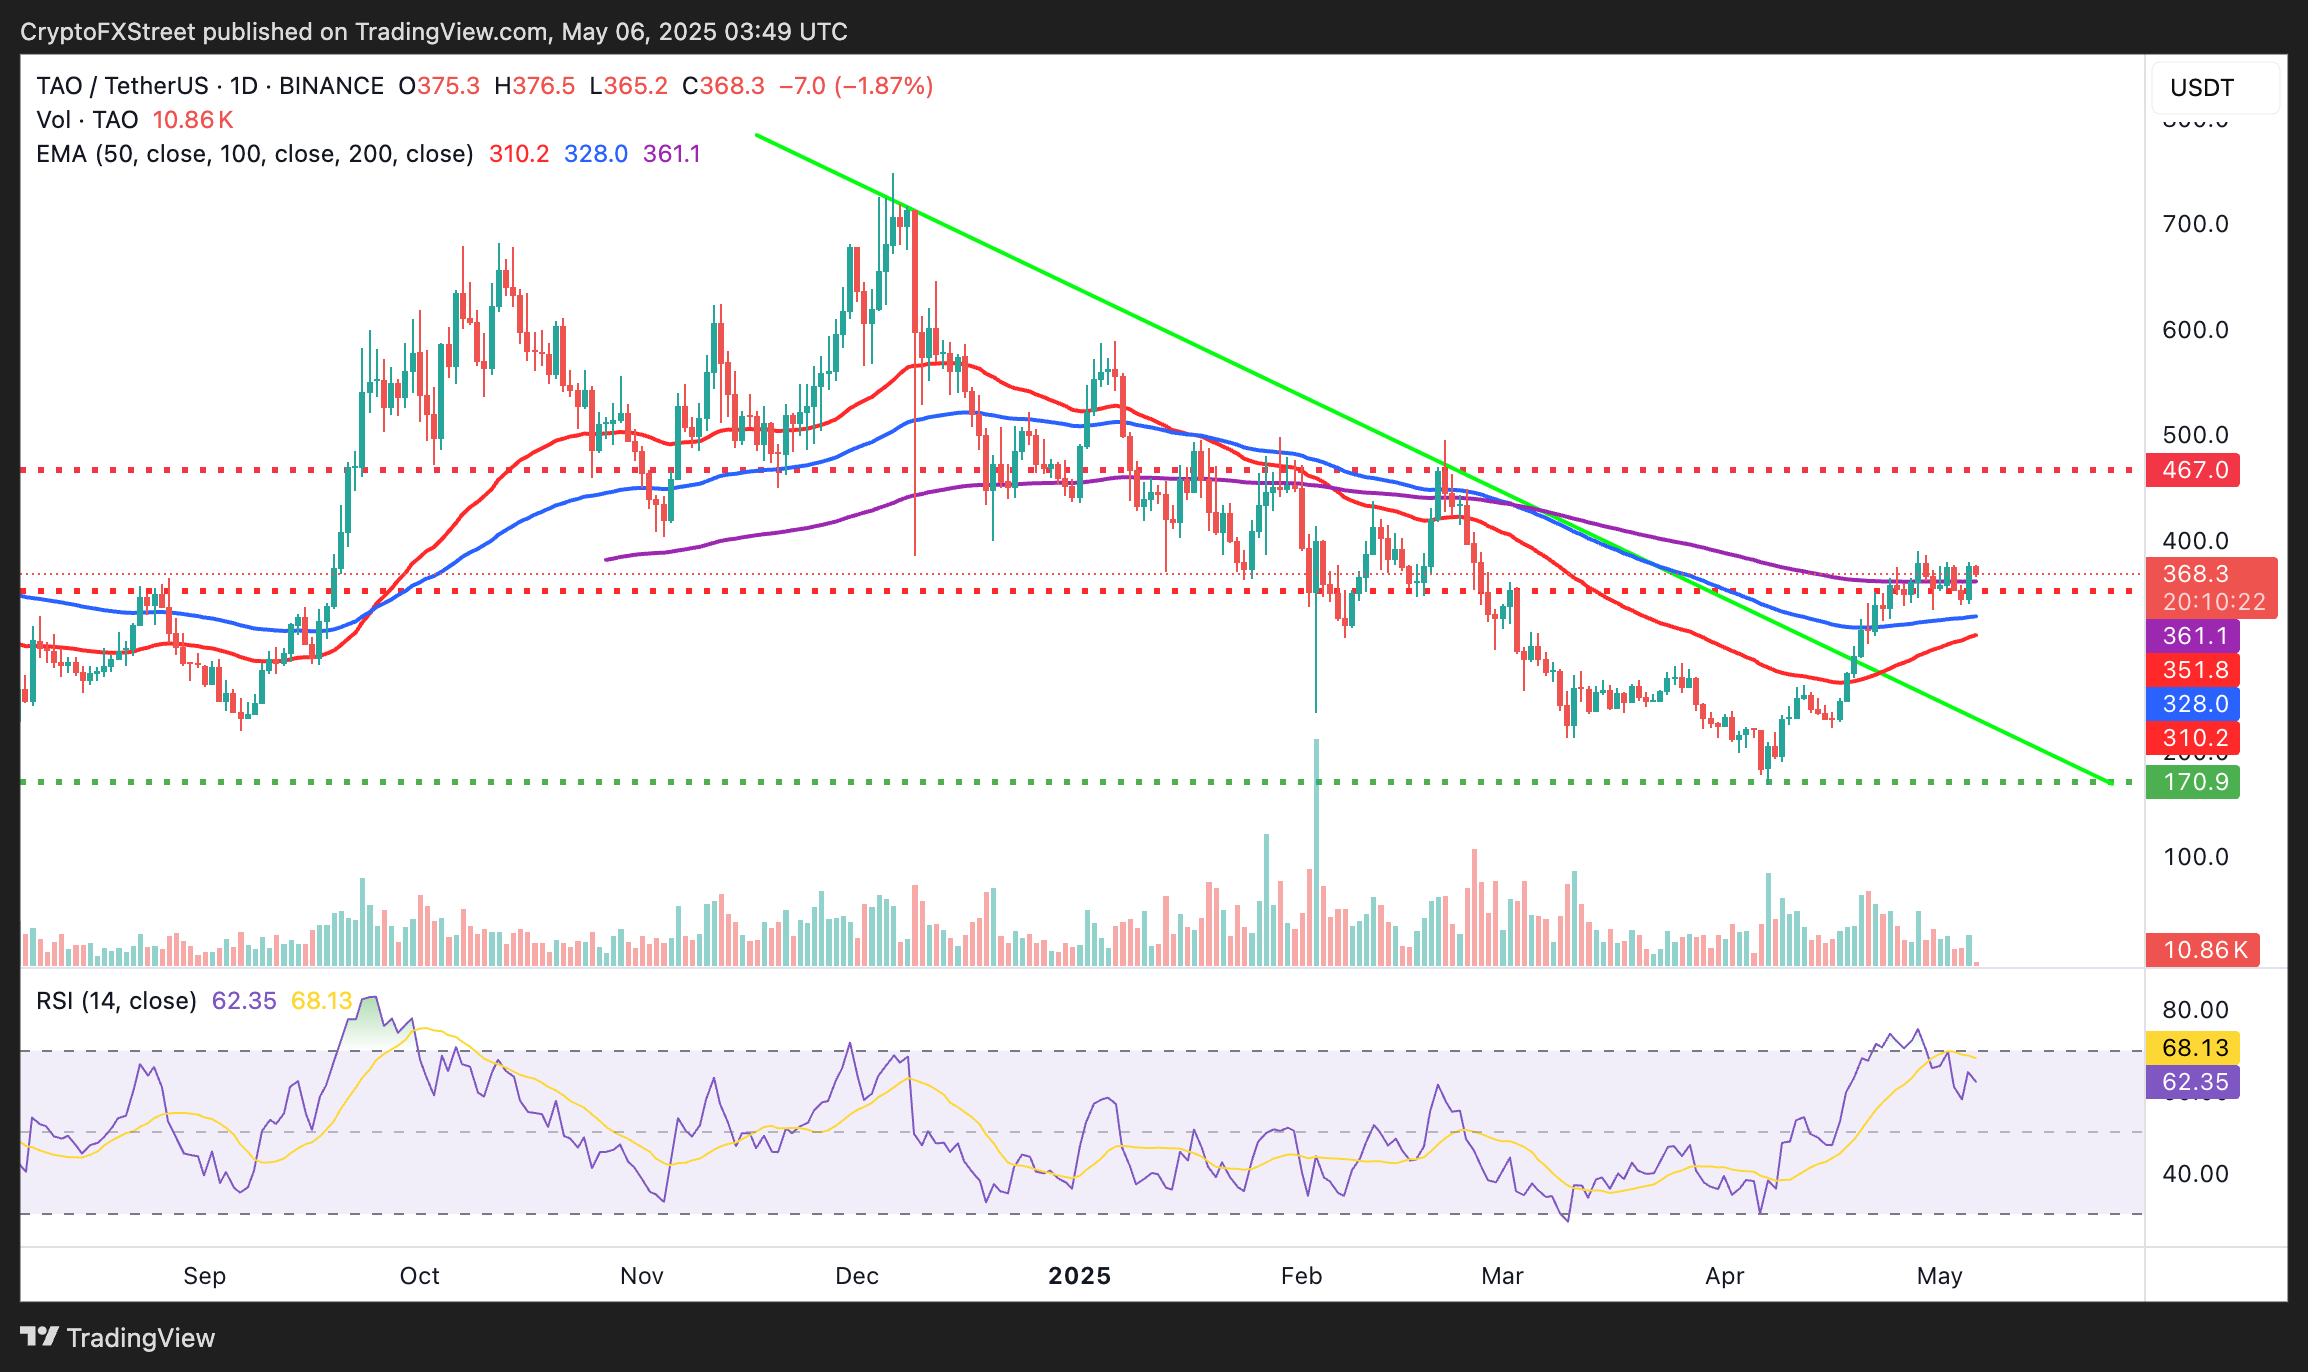
TAO/USDT daily chart
The Relative Strength Index (RSI) indicator is plummeting toward the 50 midline after reaching overbought levels, signaling stronger bearish pressure. This suggests TAO might drop to test the 100-day EMA at $328 and the 50-day EMA at $310, gathering liquidity before its next recovery attempt.
Akash Network shatters extended downtrend
Akash Network’s price hovers at $1.63 at the time of writing, down nearly 4% on the day. Although bulls have recently shattered its long-term downtrend, AKT is not out of the woods yet.
The daily chart shows the AI token facing stiff resistance at the 200-day EMA, sitting at $2.00, which has stalled its recent gains. Still, AKT holds above the 100-day EMA at $1.60, a sign bulls are not ready to give in.
A break above resistance at $2.00 could ignite a 20% rally to $2.50, marking a 53% increase from the prevailing market price.
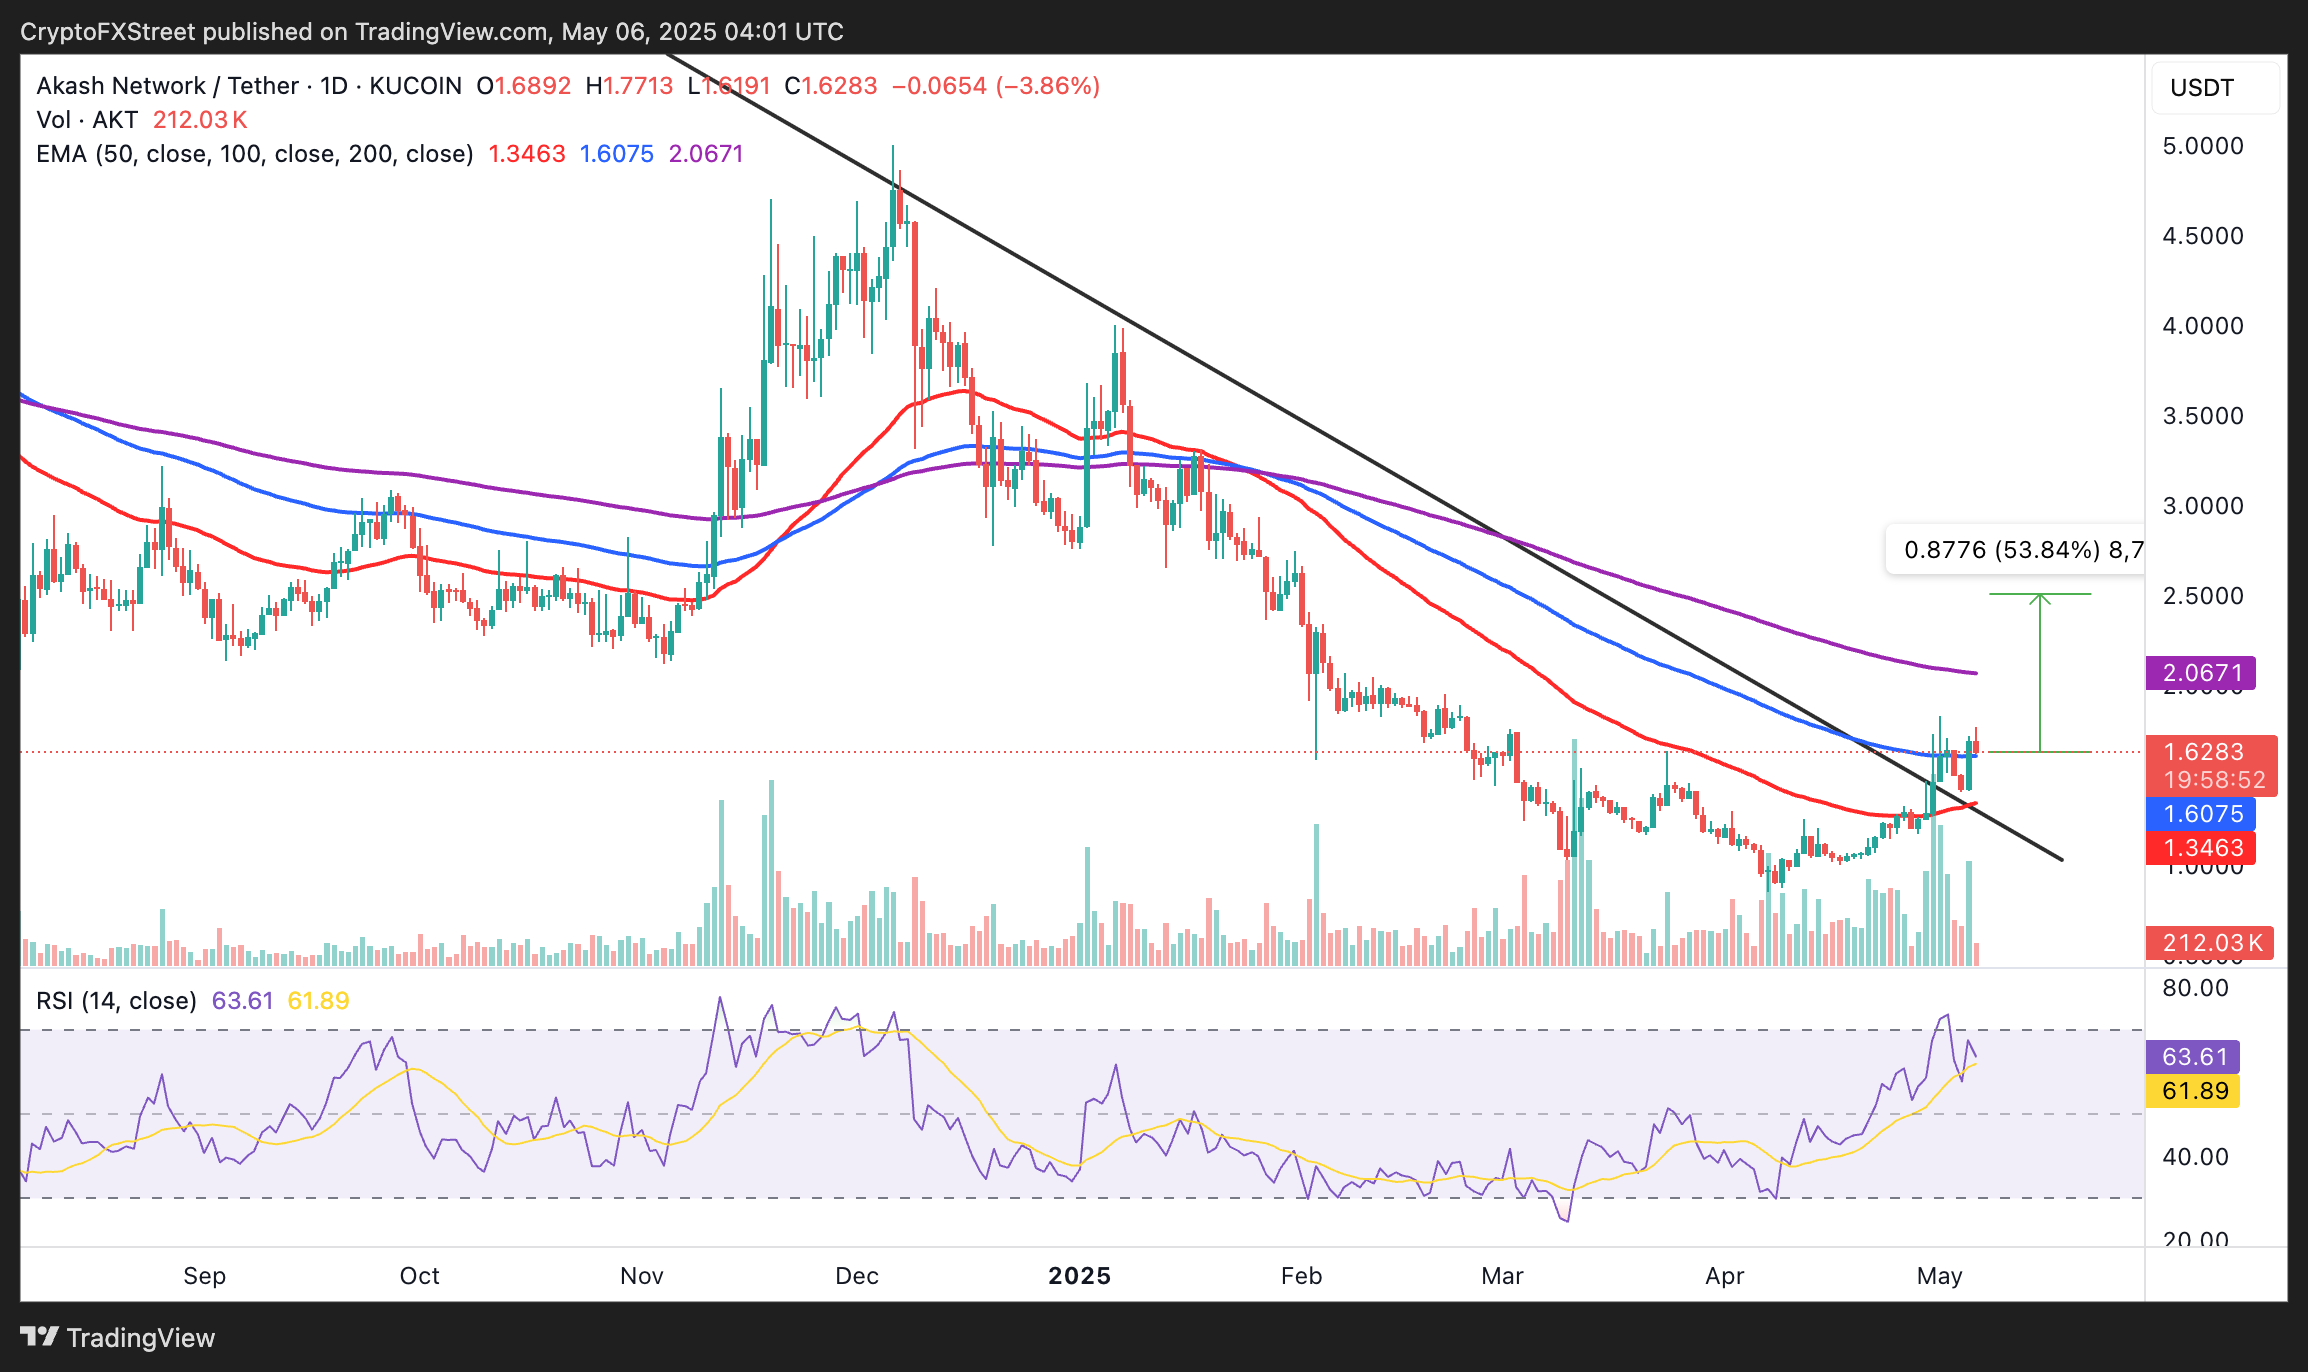
AKT/USDT daily chart
However, if bulls fail to hold the price above the 100-day EMA at $1.60, declines could be larger than anticipated. The 50-day EMA at $1.34 will absorb potential overhead pressure ahead of another recovery attempt.
Saros’ uptrend takes a breather
Saros’ price teeters at $0.14, down slightly on the day as bulls take a breather following a massive breakout to $0.16. A higher support level, tentatively at $0.14, could steady the uptrend. However, traders must prepare for all outcomes, including a larger-than-expected pullback in case profit-taking intensifies.
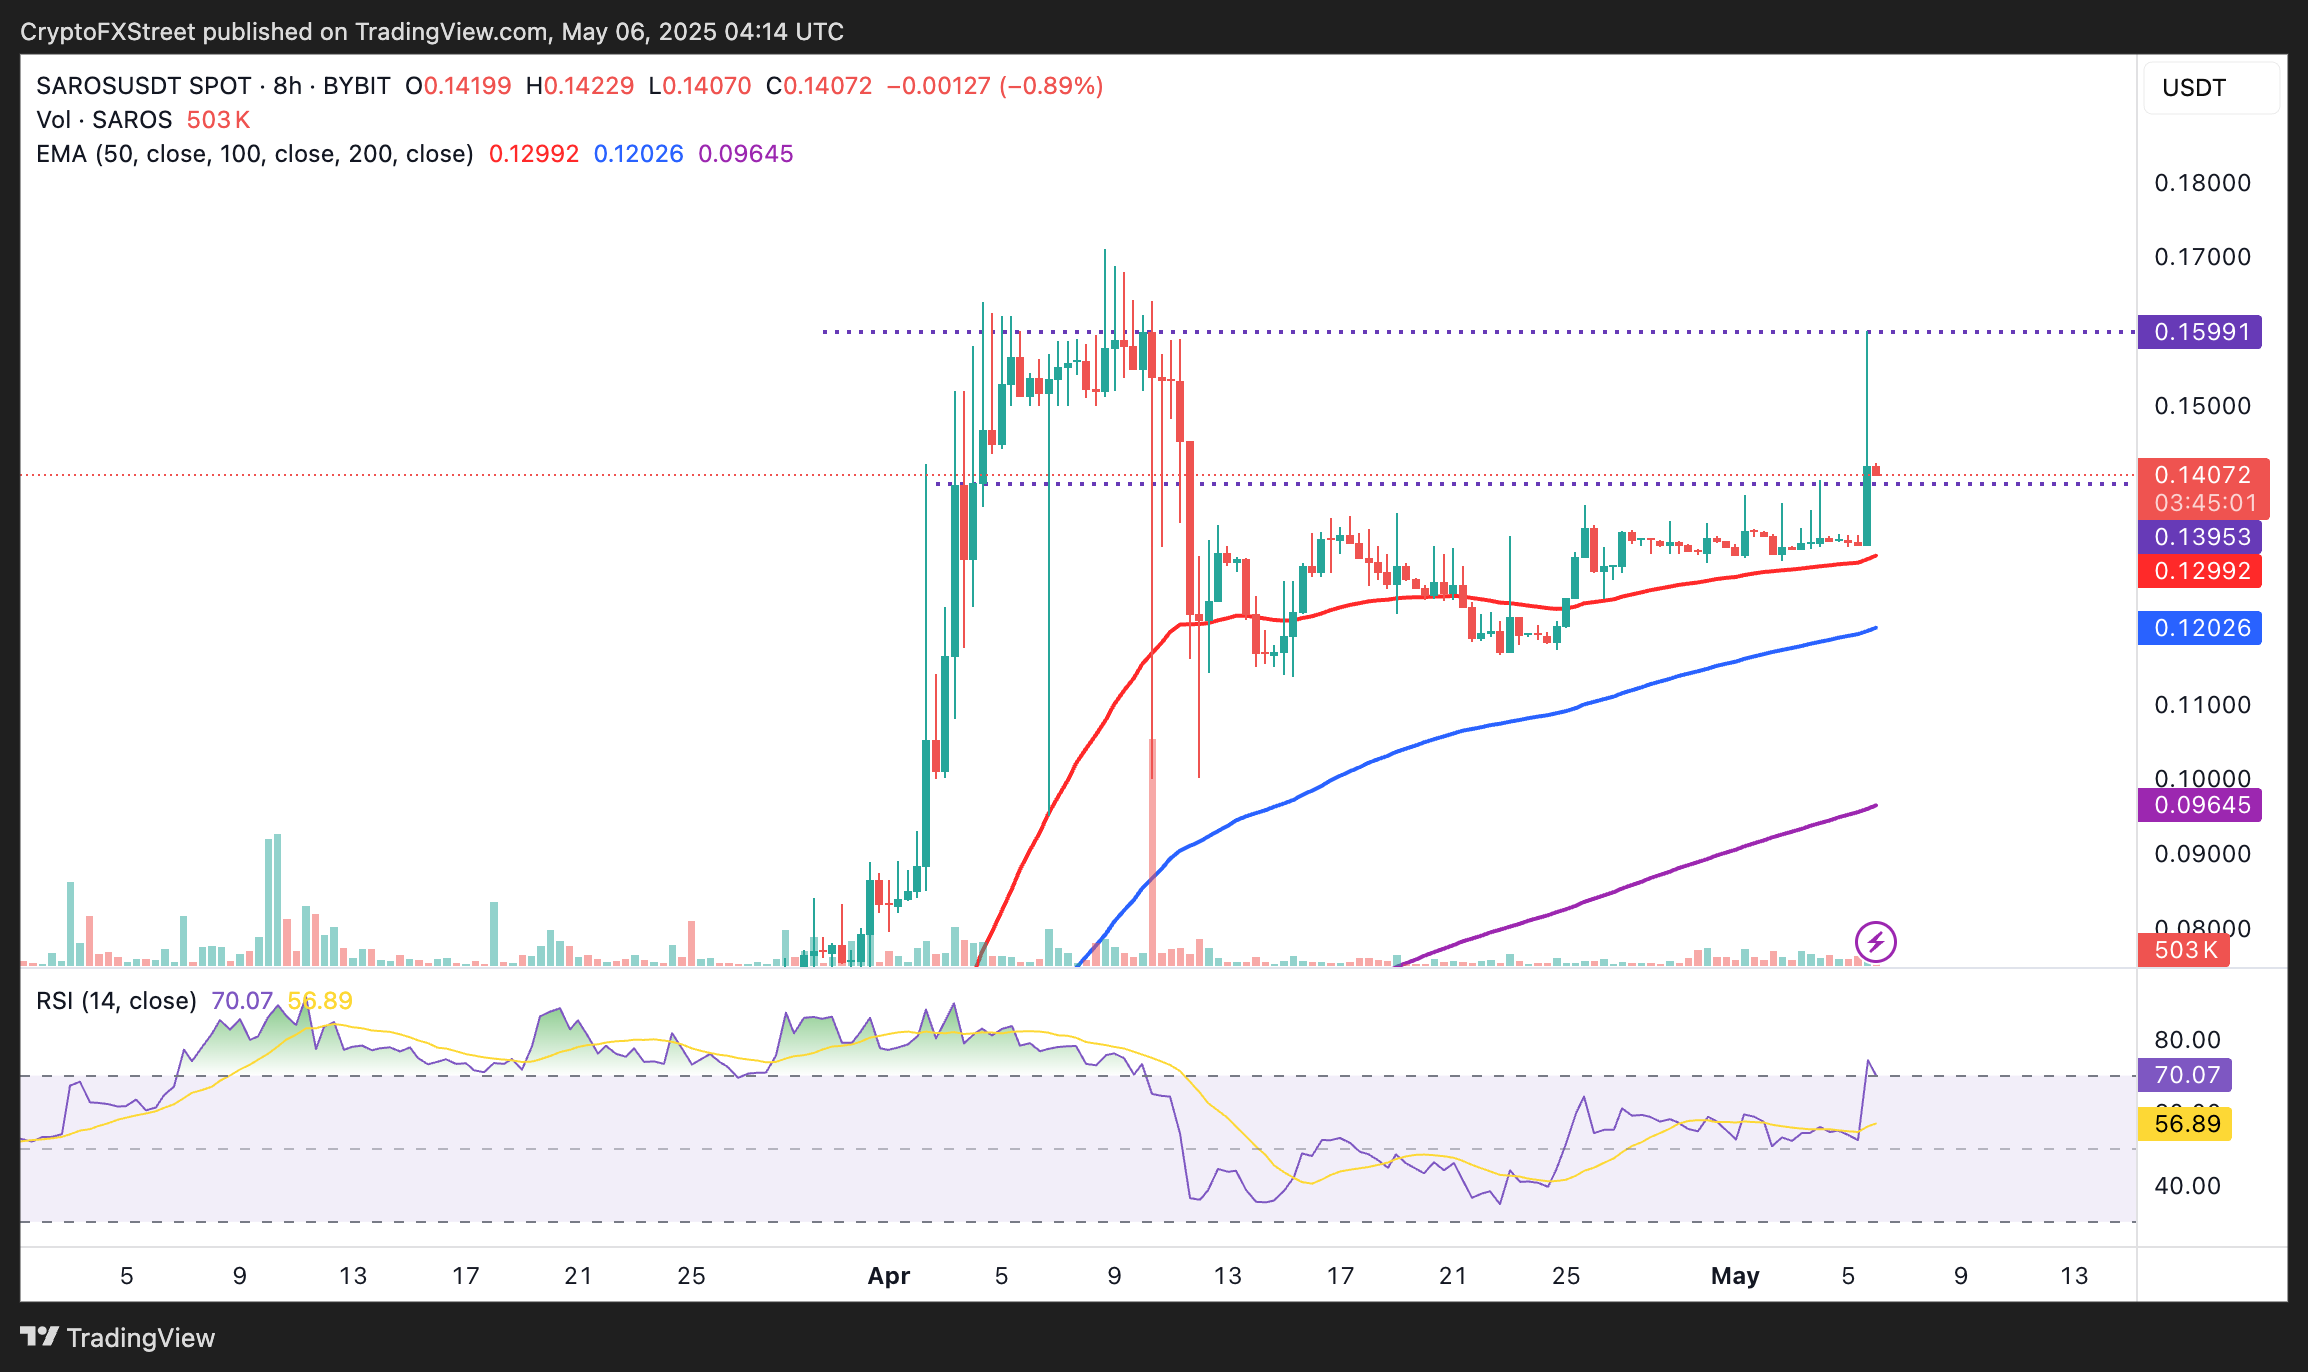
SAROS/USDT 8-hour chart
SAROS has largely outpaced other projects in its sector, boasting approximately 17.5% gains in a fortnight. However, the RSI indicator at 70 on the 8-hour chart signals overbought conditions, hinting at a potential pullback. A dip to $0.14 could offer buying opportunities before SAROS’ bulls resume the uptrend, targeting $0.20.
Cryptocurrency prices FAQs
Token launches influence demand and adoption among market participants. Listings on crypto exchanges deepen the liquidity for an asset and add new participants to an asset’s network. This is typically bullish for a digital asset.
A hack is an event in which an attacker captures a large volume of the asset from a DeFi bridge or hot wallet of an exchange or any other crypto platform via exploits, bugs or other methods. The exploiter then transfers these tokens out of the exchange platforms to ultimately sell or swap the assets for other cryptocurrencies or stablecoins. Such events often involve an en masse panic triggering a sell-off in the affected assets.
Macroeconomic events like the US Federal Reserve’s decision on interest rates influence crypto assets mainly through the direct impact they have on the US Dollar. An increase in interest rate typically negatively influences Bitcoin and altcoin prices, and vice versa. If the US Dollar index declines, risk assets and associated leverage for trading gets cheaper, in turn driving crypto prices higher.
Halvings are typically considered bullish events as they slash the block reward in half for miners, constricting the supply of the asset. At consistent demand if the supply reduces, the asset’s price climbs.
Bài viết đề xuất


