
AAVE Price Forecast: AAVE eyes further gains as DeFi TVL hits record high
- AAVE ticks higher while the recovery run in action eyes to surpass the $300 psychological mark.
- The total value locked on Aave reaches a record high of $26.49 billion, indicating a surge in DeFi activity.
- The Open Interest and funding rates indicate mixed sentiment among derivatives traders.
Aave (AAVE) edges higher by nearly 1% at press time on Wednesday, adding to the 3.45% gains from the previous day, while the total value locked hits a record level of $26.49 billion. However, the derivatives traders remain divided as AAVE inches closer to the $300 psychological mark. The technical outlook indicates a bullish tilt as the trend momentum shows gradual growth.
AAVE’s TVL hits a new all-time high
DeFiLlama data shows the Total Value Locked (TVL) on Aave has reached a new record high of $26.49 billion. TVL refers to the value of all coins deposited on a DeFi protocol, and an increase in TVL suggests heightened activity on the protocol.
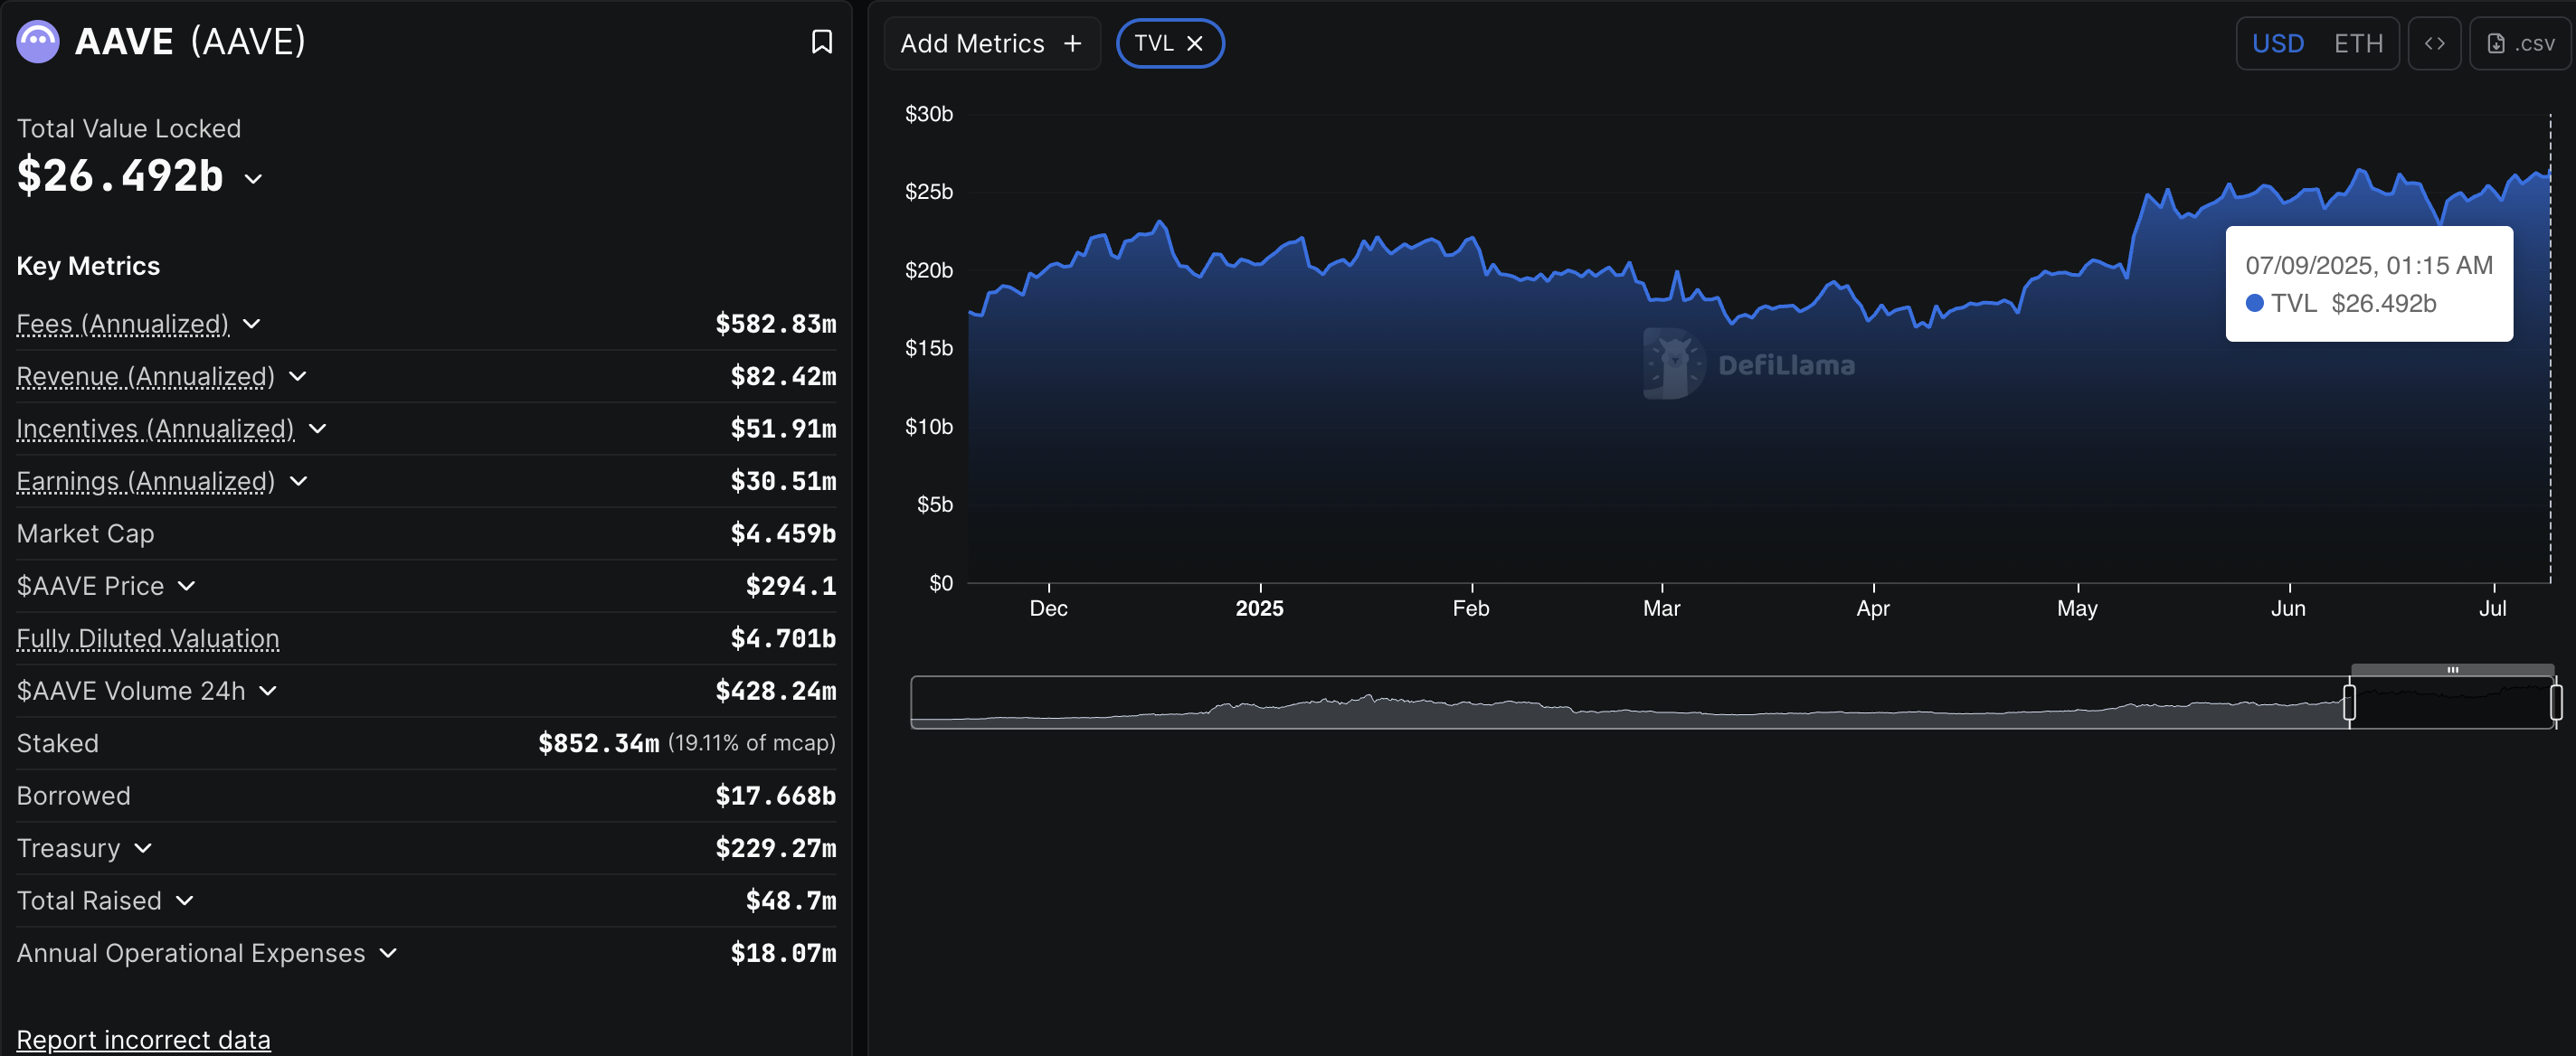
AAVE TVL. Source: DeFiLlama
The TVL surge comes on the back of rising activity in the Decentralized Finance (DeFi) space, reaching a TVL of $116.786 billion.
Mixed sentiments hold in AAVE derivatives
CoinGlass’ data shows a 24-hour growth of 14.28% in AAVE Open Interest (OI), reaching $678.07 million. A boost in OI relates to increased capital inflow in the derivatives market, suggesting heightened optimism.
However, the OI-weighted funding rate reads 0.0013% as it fluctuates near the zero line, indicating mixed sentiments among traders. Typically, bulls pay the funding rates when positive to offset the imbalance in spot and swap prices that arises due to increased buying activity in the derivatives market.
Still, the 24-hour short liquidations worth $625.58K outpace $125.16K of long liquidations, indicating a larger wipeout of bearish positions. Despite this, the long/short ratio at 0.9736 indicates a larger number of active short positions.
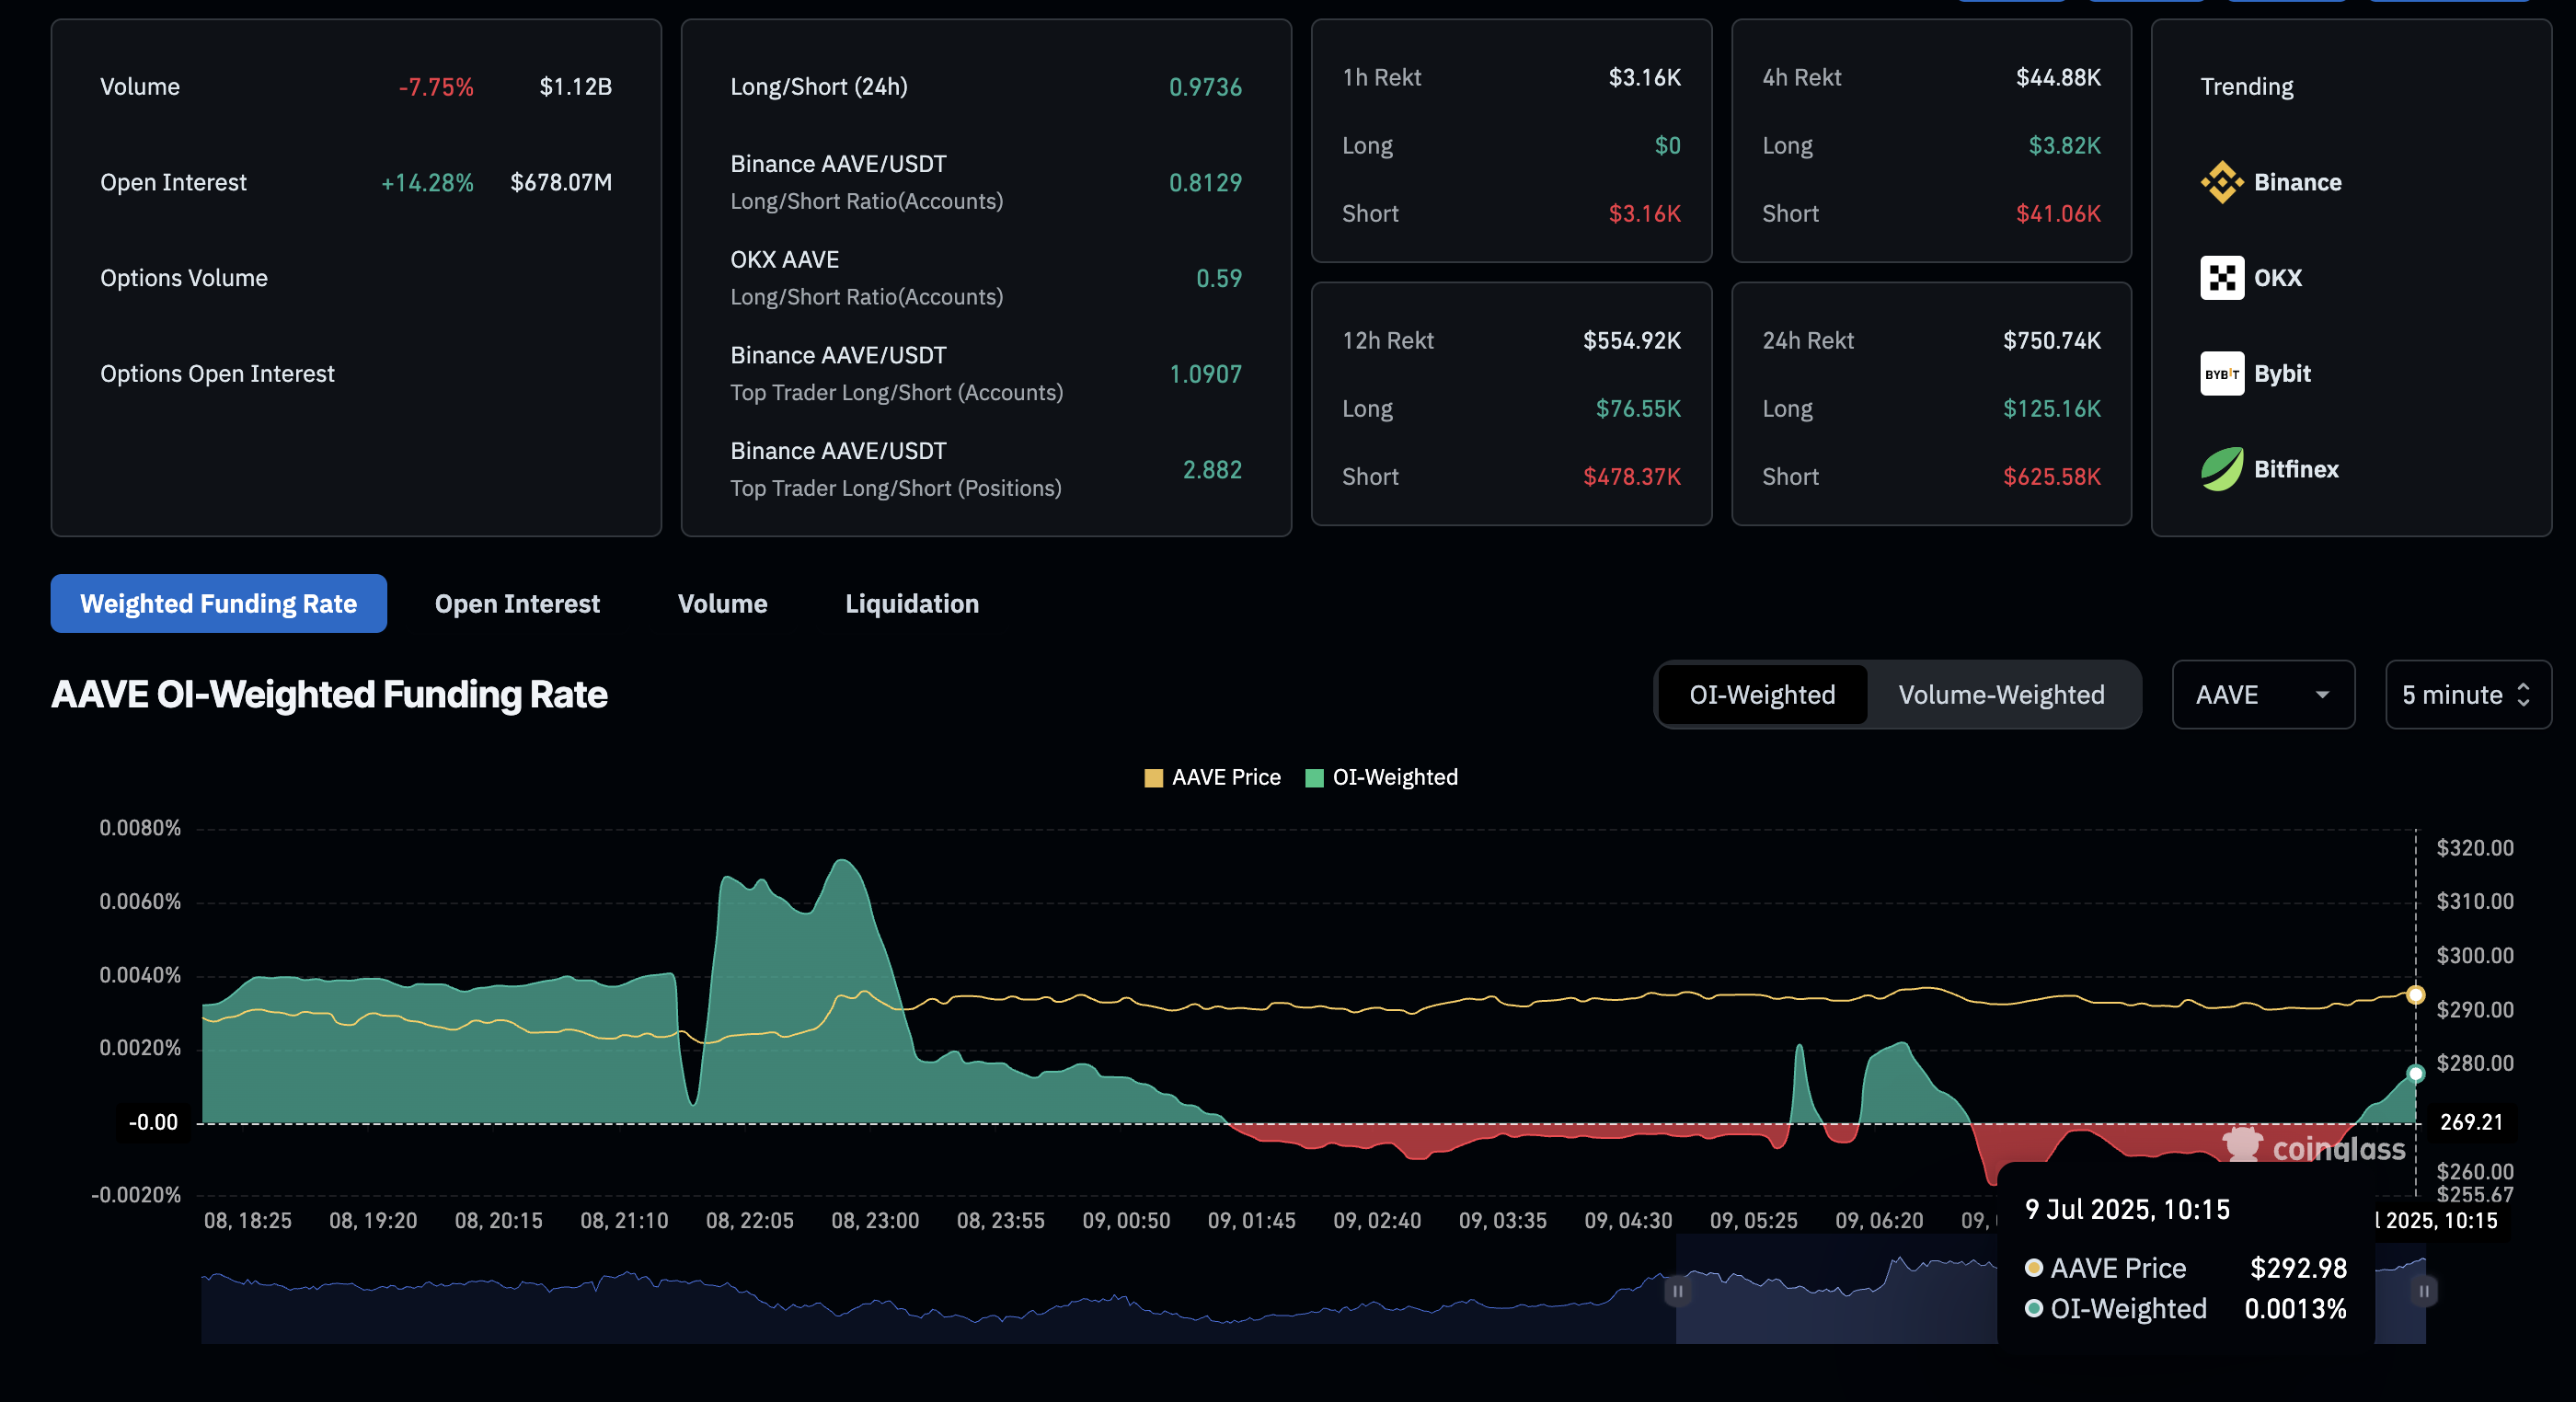
AAVE Derivatives. Source: CoinGlass
AAVE aims to surpass the $300 level
Aave edges higher nearly 1% at press time on Wednesday, extending the 3.45% gains from Tuesday. The DeFi token hits a new monthly high following a V-shaped reversal in late June.
Aave’s ongoing recovery bounced off the 50% Fibonacci retracement at $213.55, drawn from the December 16 high of $399.85 to the April 7 low of $114.05. The uptrend is now inching closer to the 78.6% Fibonacci level at $305.71.
A potential close above $305.71 could extend the recovery towards the 52-week high of $399.85.
The technical indicators suggest a gradual increase in trend momentum, as the Relative Strength Index (RSI) reads 60, rising towards the overbought zone. Further, the Moving Average Convergence/Divergence (MACD) indicator displays a rising trend of green histogram bars above the zero line.
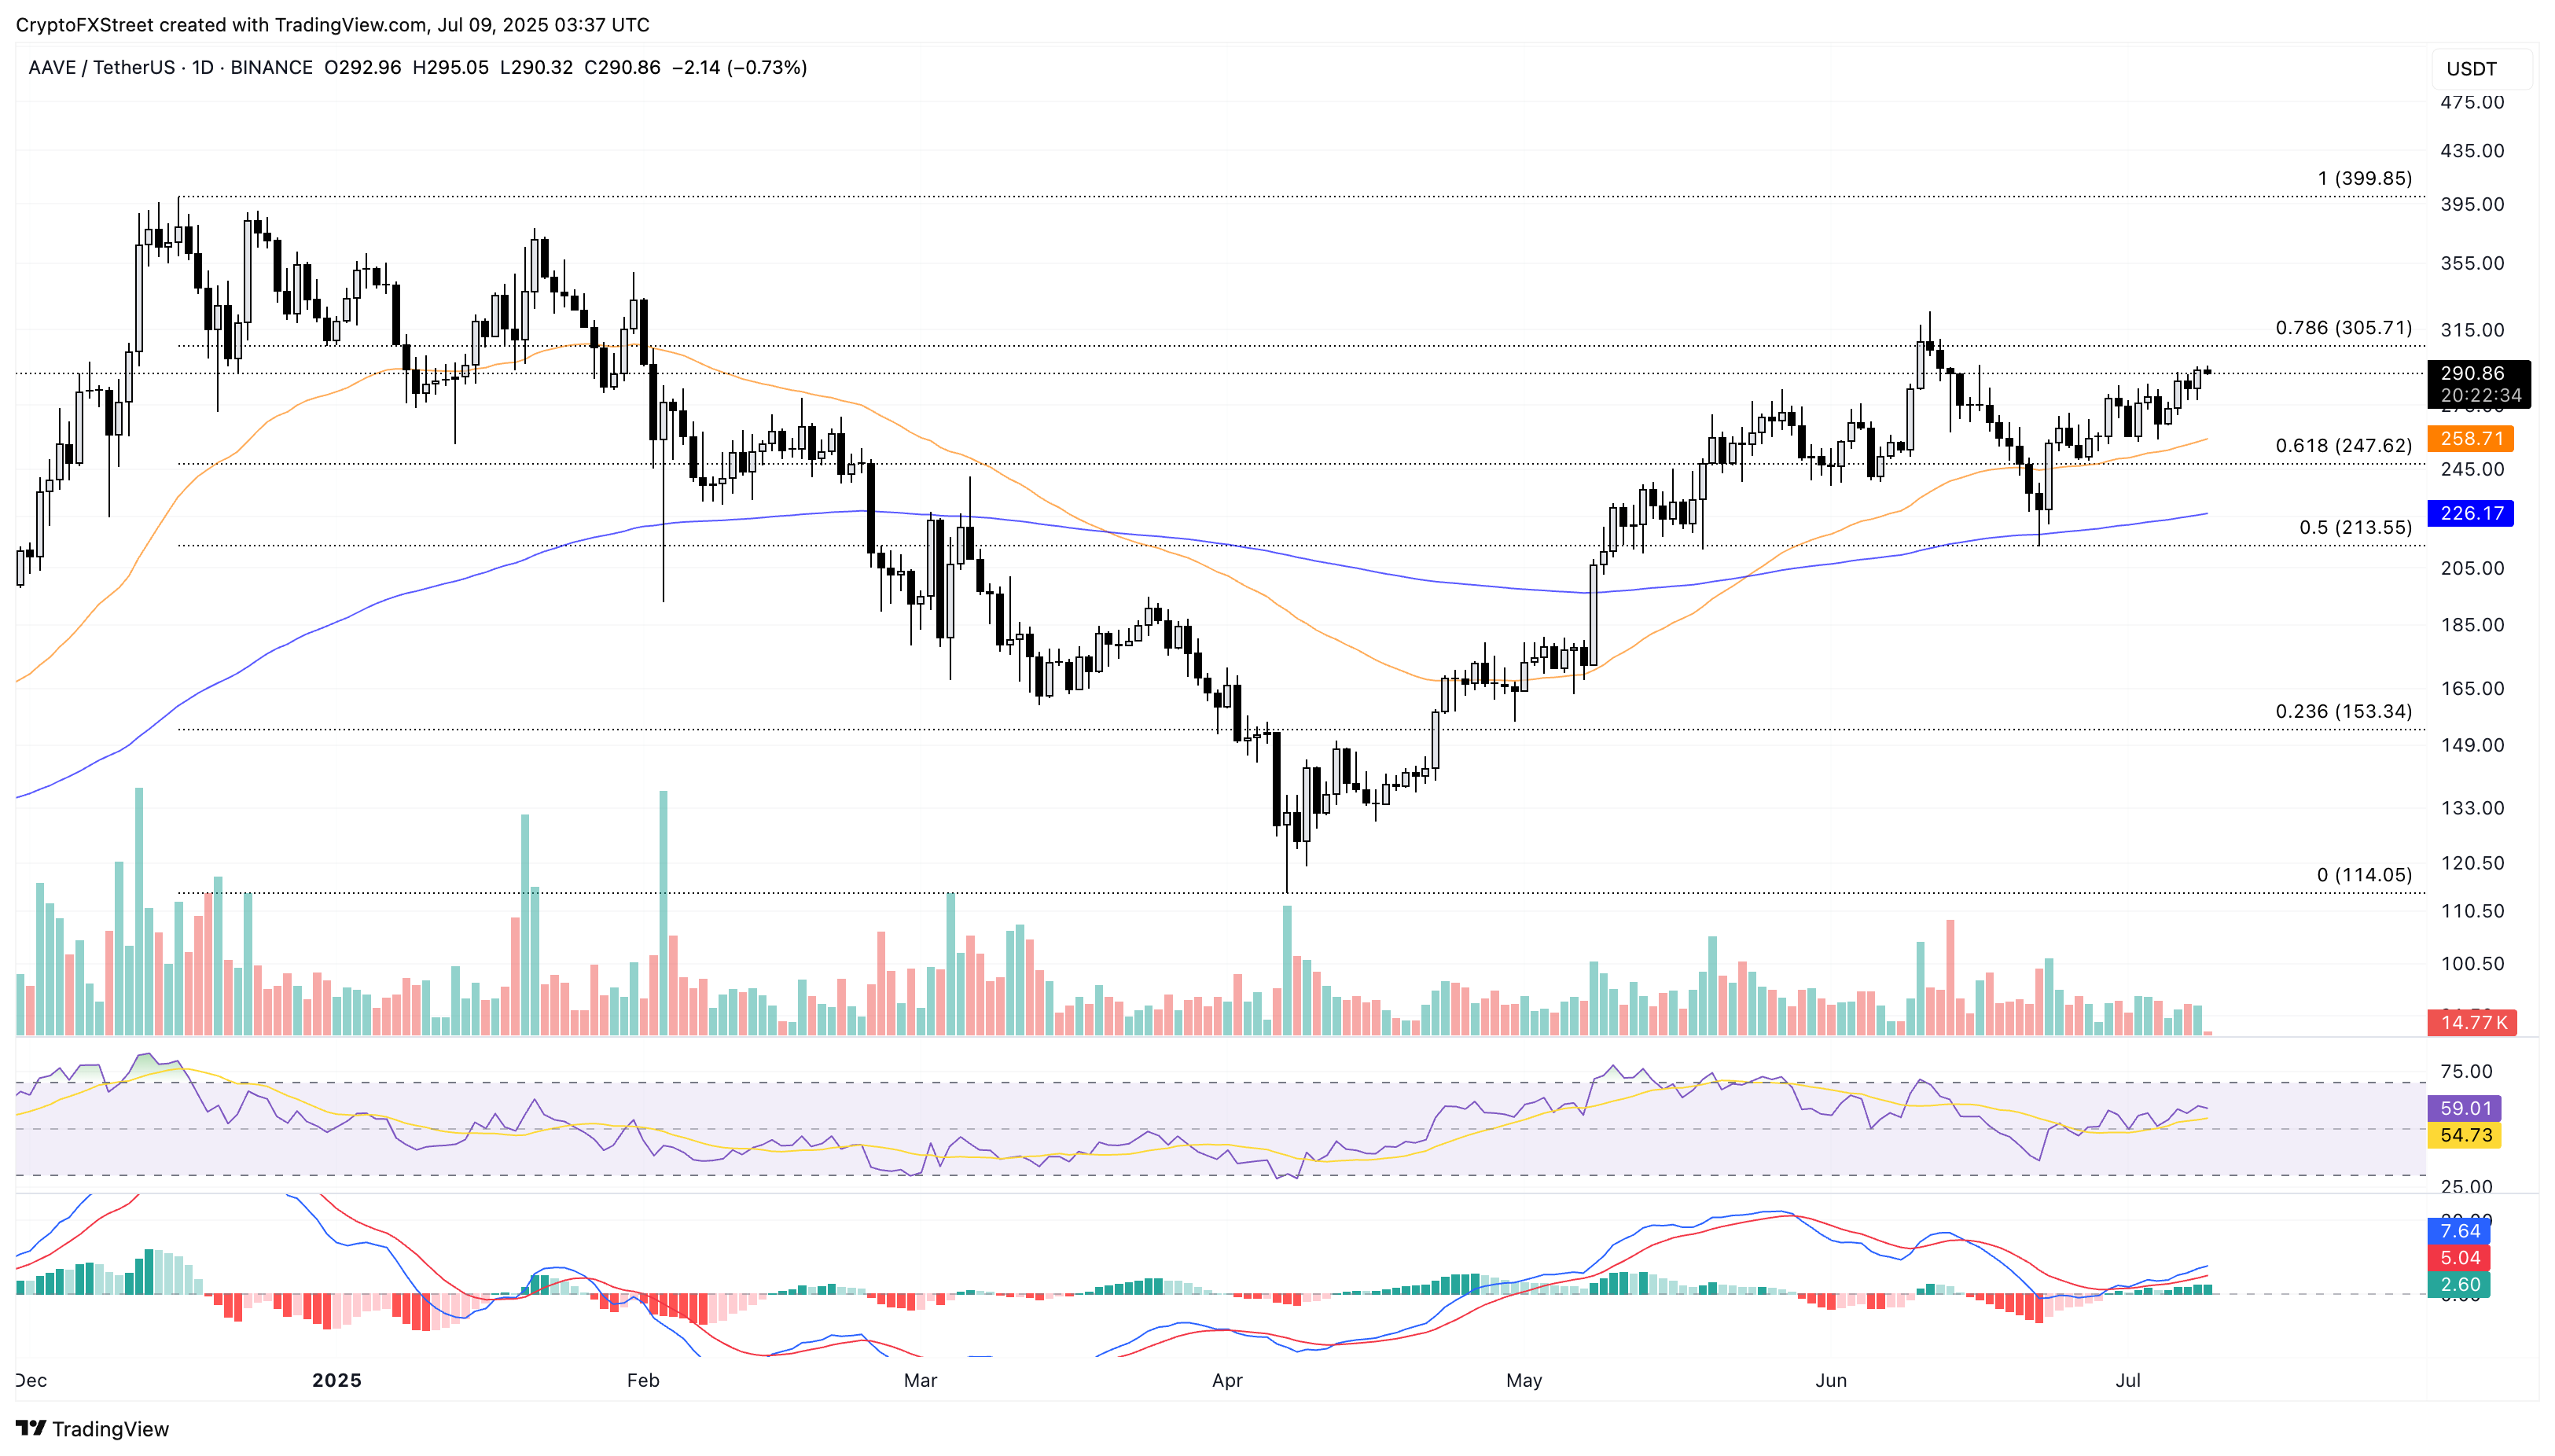
AAVE/USDT daily price chart.
On the downside, a reversal in AAVE could test the 50-day Exponential Moving Average (EMA) at $258.71.
Bài viết đề xuất


