

Bitcoin halving has failed to impact price, on-chain metrics highlight mixed signals
- Bitcoin is facing its longest post-halving delay to a new all-time high.
- Halving cycle thesis may no longer hold due to significant shifts in market dynamics and supply overhang.
- Short-term holders could trigger a sell-off if prices decline further amid mixed signals from on-chain metrics.
Bitcoin (BTC) is facing its longest post-halving delay to a new all-time high as it trades around $58K on Wednesday. Unlike previous times, several supply overhangs in the past months and strong interest rates environment have heavily weighed on Bitcoin's price.
Halving cycle thesis faces questions
The post-halving delay to a new all-time high has caused a significant shift in Bitcoin market dynamics, which heavily relied on halving as a major bullish multiplier. Some of these changes were anticipated due to the introduction of new market players and investor classes following the launch of spot Bitcoin ETFs.
The move also saw Bitcoin making a parabolic run to an all-time high for the first time pre-halving. As a result, investors displayed a somewhat opposite behavior from previous halving seasons.
Historically, halving seasons are usually periods of accumulation where investors prepare for potential upsides. However, Glassnode data shows an increase in realized profits during the halving season from March to April. Following Bitcoin's all-time high of $73K in March, long-term holders (LTHs) booked profits significantly and have now slowed down their efforts.
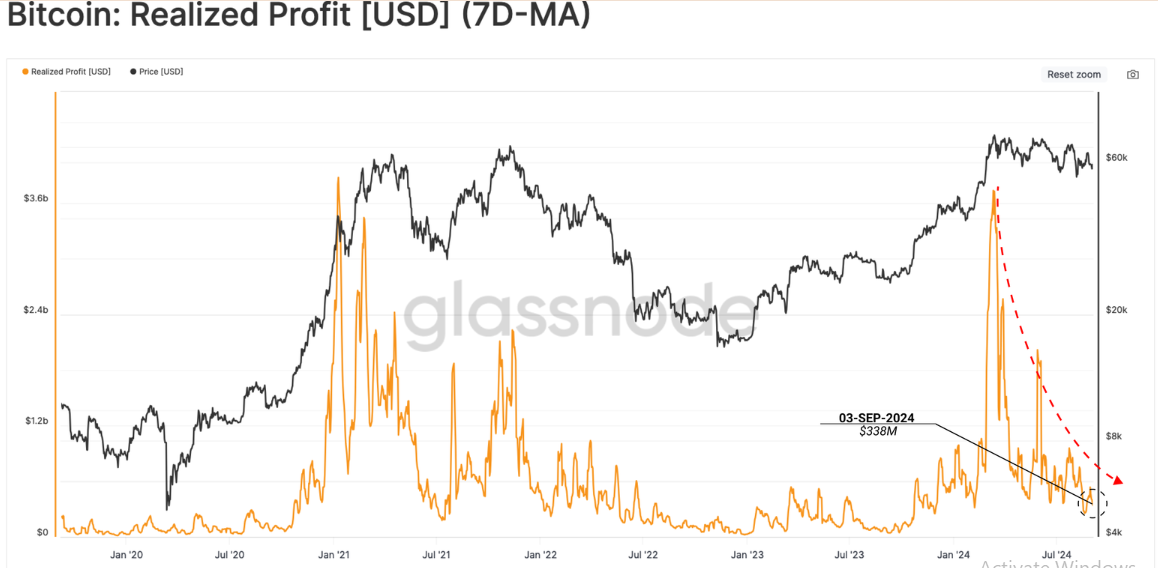
BTC Realized Profits 7D-MA
Furthermore, the current post-halving season witnessed some of the largest supply overhangs, including the repayment of creditors of defunct exchange Mt.Gox and the German government's sale of seized BTC funds.
Bitcoin's on-chain metrics indicate mixed signals
As a result, Bitcoin's price has been facing bearish pressure that has seen its price struggle under the $60K mark. Despite the declining prices, BTC's unrealized losses are still at 2.9% of its market capitalization, per Glassnode data. Furthermore, the combined ratio of Unrealized Profit and Unrealized Loss is at 6.19, indicating that profits are 6x larger than losses for the aggregate investor.
However, zooming in shows that short-term holders (STH), typically investors whose coins are less than 155 days old, carry most of the unrealized losses. "However, even for this cohort, the magnitude of their Unrealized Losses relative to the market cap is not yet in full-scale bear market territory and more closely resembles the choppy 2019 period," noted Glassnode analysts.
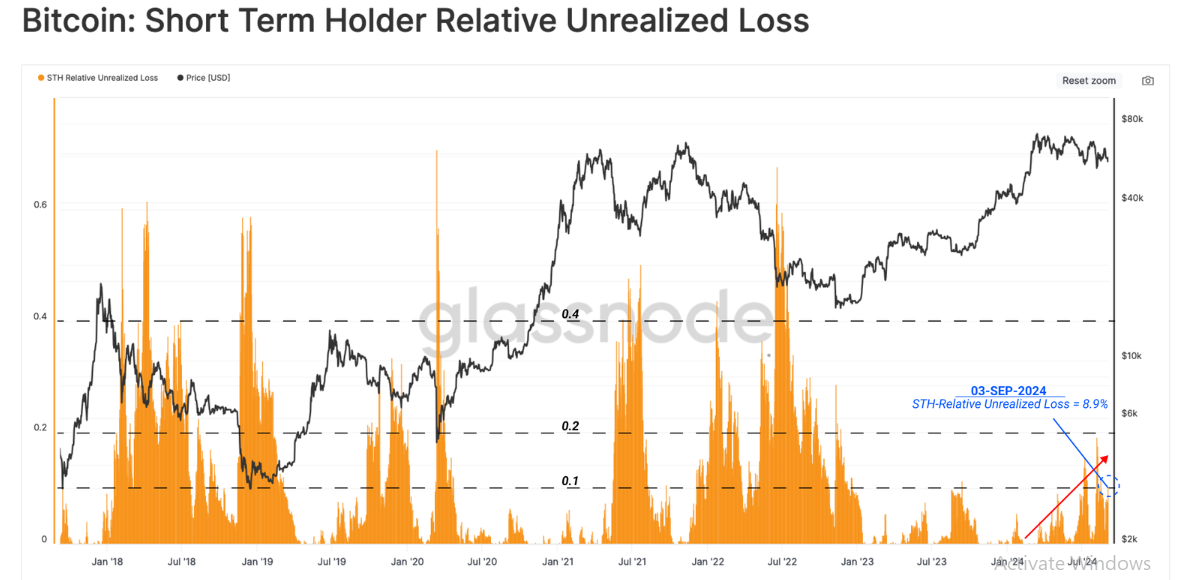
Bitcoin STH Relative Realized Losses
If Bitcoin's price weakens further, it could be at risk of a heavy sell-off from these cohorts, who are historically sensitive to price declines. Glassnode analysts note that Bitcoin needs to rise above the $62.5K price level to shift coins within this cohort to profitability again.
Meanwhile, several Bitcoin tokens purchased during the all-time high in March are maturing into the long-term holders cohort, which is typical during a move toward a bear market. However, Glassnode analysts noted that "the percentage of wealth held by new investors did not reach the elevated limits experienced during previous ATH distribution events."
"This may indicate that the 2024 peak is more aligned with the 2019 mid-cycle high rather than the macro highs seen in 2017 and 2021," they added.
As a result, it's still unclear whether Bitcoin has topped for the cycle or will stage another rally to a new all-time high.
Bài viết đề xuất


