


Bitcoin Weekly Forecast: BTC drops below $68,000 as oversold signal fails to stop sellers
- Bitcoin corrects more than 7% so far this week, hitting an intraday low of $67,568 on Friday.
- Nvidia shares plunge more than 10% this week as CEO Jensen Huang’s resignation fuels broader risk-off sentiment.
- Rising liquidations, continued ETF outflows, and weakening risk appetite are leaving BTC vulnerable to further downside.
Bitcoin (BTC) extends its correction, falling more than 8% and hitting an intraday low of $67,568 on Friday. Despite oversold technical signals, selling pressure continues to intensify, with persistent Exchange Traded Funds (ETFs) outflows, leveraged liquidations and weakening risk appetite weighing on the Crypto King outlook. Adding to this bearish narrative, Nvidia (NVDA) ’s sharp decline and news of CEO Jensen Huang’s resignation this week fuel broader risk-off sentiment.
Nvidia’s sharp decline fuels broader risk-off sentiment
Nvidia shares have plunged more than 13% so far this week, in the wake of controversy over CEO Jensen Huang's personal relationships, which led him to resign on Thursday. The selloff has knocked Nvidia from its position as the world’s most valuable publicly traded company, triggering broader risk-off sentiment and weighing on risky assets such as cryptos. Bitcoin saw a sharp correction of over 8%, reaching a low of $67,568 on Friday, levels not seen since mid-August.
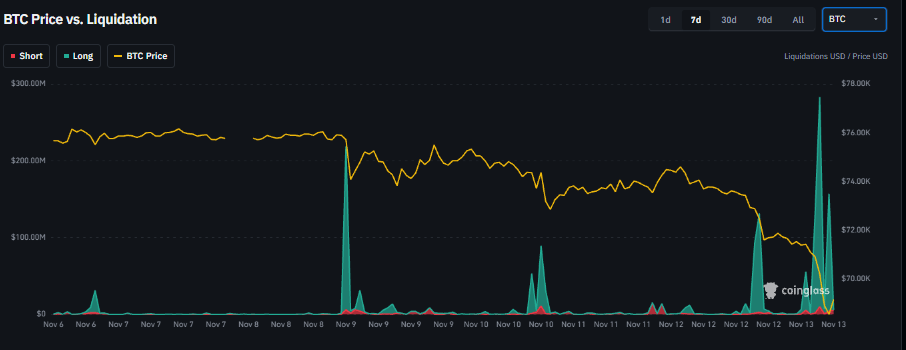
This week’s price action triggered a wave of liquidation in the crypto market. The Coinglass chart below shows that over $1.2 billion in BTC positions were liquidated, mostly longs, highlighting bullish positioning among leveraged Bitcoin traders.
In an exclusive interview, Bitunix Analyst Dean Chen told FXStreet that Nvidia’s recent weakness and the news surrounding CEO Jensen Huang added to Bitcoin’s selling pressure but were not the primary drivers behind the cryptocurrency’s decline. He argued that Bitcoin’s weakness had already emerged before Nvidia’s latest correction, suggesting crypto-specific factors played a bigger role.
“I think blaming Bitcoin’s decline on Nvidia is a little too convenient. The timeline doesn’t really support that explanation,” Chen said, noting that Bitcoin peaked at around $87,300 on September 21, while Nvidia did not reach its high until October 6.
He added that the AI-stock correction and Jensen Huang-related news added another layer of anxiety to an already fragile market, rather than triggering the initial decline.
“I’m not saying Bitcoin can’t bounce from here. It certainly can, especially if forced selling eases and short positions begin to close. But I wouldn’t confuse a relief rally with a real recovery,” Chen concluded.
Institutional selling continues
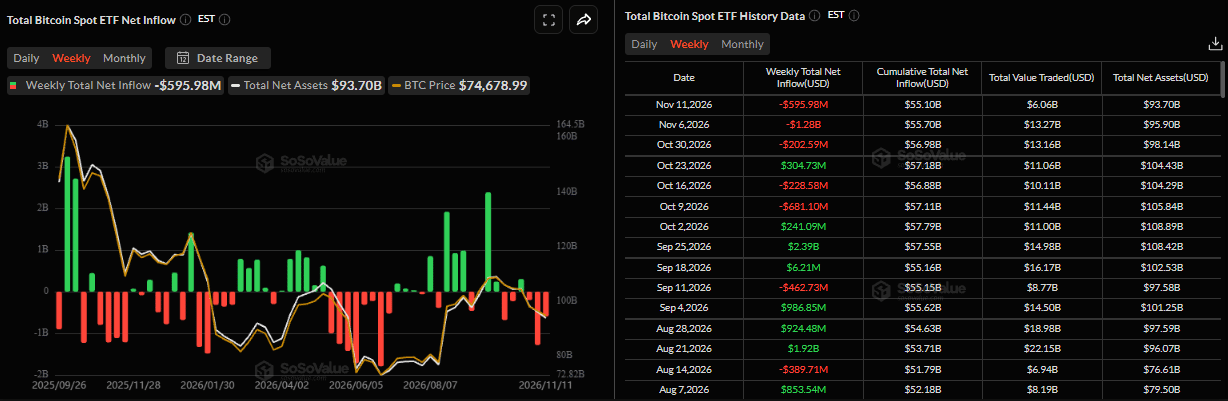
Institutional demand for Bitcoin has weakened so far this week. SoSoValue data show BTC spot ETFs are on track for a third straight weekly outflow, with $595.98 million in net withdrawals through Wednesday, after $1.28 billion in net outflows last week.
If outflows continue through Friday and intensify, they could put additional pressure on BTC, pushing its price into a deeper correction.
On the corporate side, which has historically helped cushion Bitcoin during sharp corrections, it faces another setback this week. On Wednesday, global index provider MSCI confirmed it would remove Strategy from its global indexes, the MSCI USA Index and the MSCI World Index.
In addition, Tokyo-listed Metaplanet, which also accumulates and holds BTC, was included in the exclusion list. The companies will be removed from the MSCI Japan Small Cap Index effective December 1.
The decision means that index funds tracking the affected benchmarks may need to sell their Strategy and Metaplanet shares by November 30 and December 1 to reflect the changes in their portfolios.
Although MSCI’s decision directly affects these two companies’ stock rather than their Bitcoin holdings, the consequences could extend to the cryptocurrency given the firms’ strong position in Bitcoin as treasury, with Strategy, the largest corporate holder of Bitcoin, currently holding 850,364 BTC, and Metaplanet Inc., with 44,000 BTC, as the second-largest.

Macroeconomic conditions weigh on BTC
On the macroeconomic front, US October Consumer Price Index (CPI) data was released on Tuesday. Headline CPI rose 0.4% in October, above market expectations of 0.3%. Moreover, the core gauge, which excludes volatile energy and food prices, was up 0.3%, matching September’s increase and surpassing estimates of 0.2%.
The report didn’t include annual inflation figures in this release because it lacks October 2025 monthly data due to the government shutdown from October 1, 2025, to November 12, 2025.
Hotter-than-expected US CPI figures are weighing on risk appetite, strengthening expectations of tighter monetary conditions. The CPI report specifically raised the odds that the Fed will hike interest rates in December.
In addition, Fed Governor Christopher Waller warned that a stronger-than-expected core CPI reading of 0.3% could prompt him to consider a larger 50-basis-point (bps) rate hike at the December 8–9 policy meeting. He added that limiting the increase to 25 bps could put the Fed’s credibility at risk.
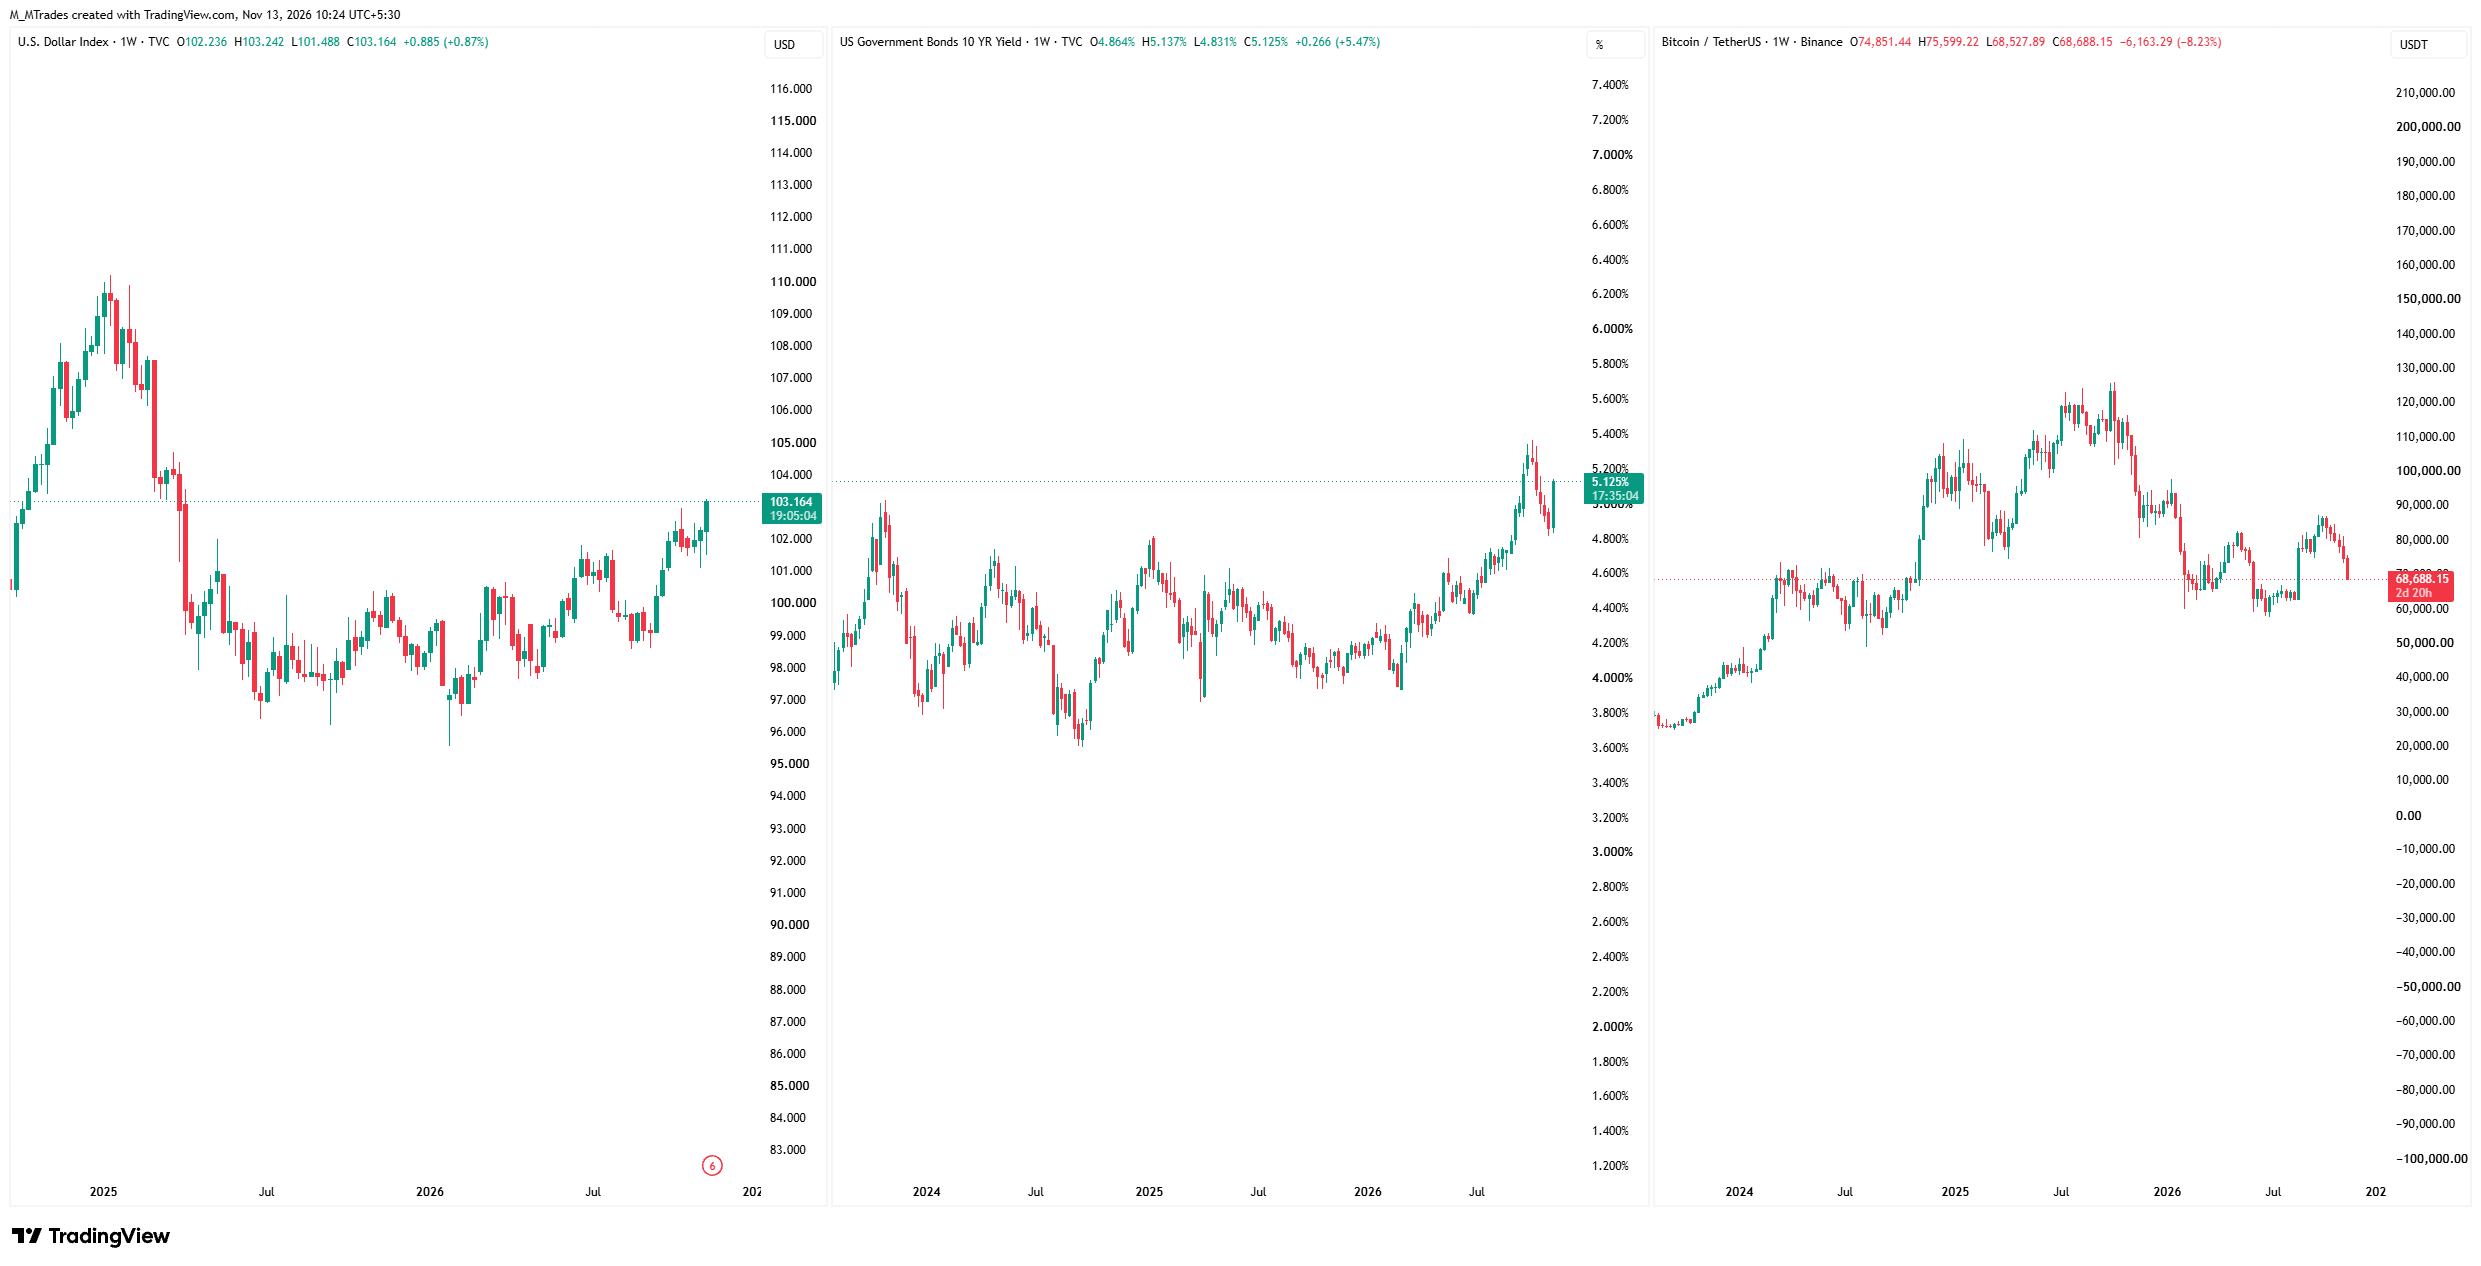
This hawkish stance lifted the US Dollar Index (DXY) and Treasury yields, with the 10-year yield moving above 5%, resulting in downward pressure on BTC, as shown in the chart below.
Moving ahead, the US Producer Price Index (PPI) highlights Friday’s economic docket. Speeches from influential Federal Open Market Committee (FOMC) members will also shape expectations for the Fed’s policy path and Bitcoin’s next move.
Bitcoin technical outlook: Points to sixth weeks of correction
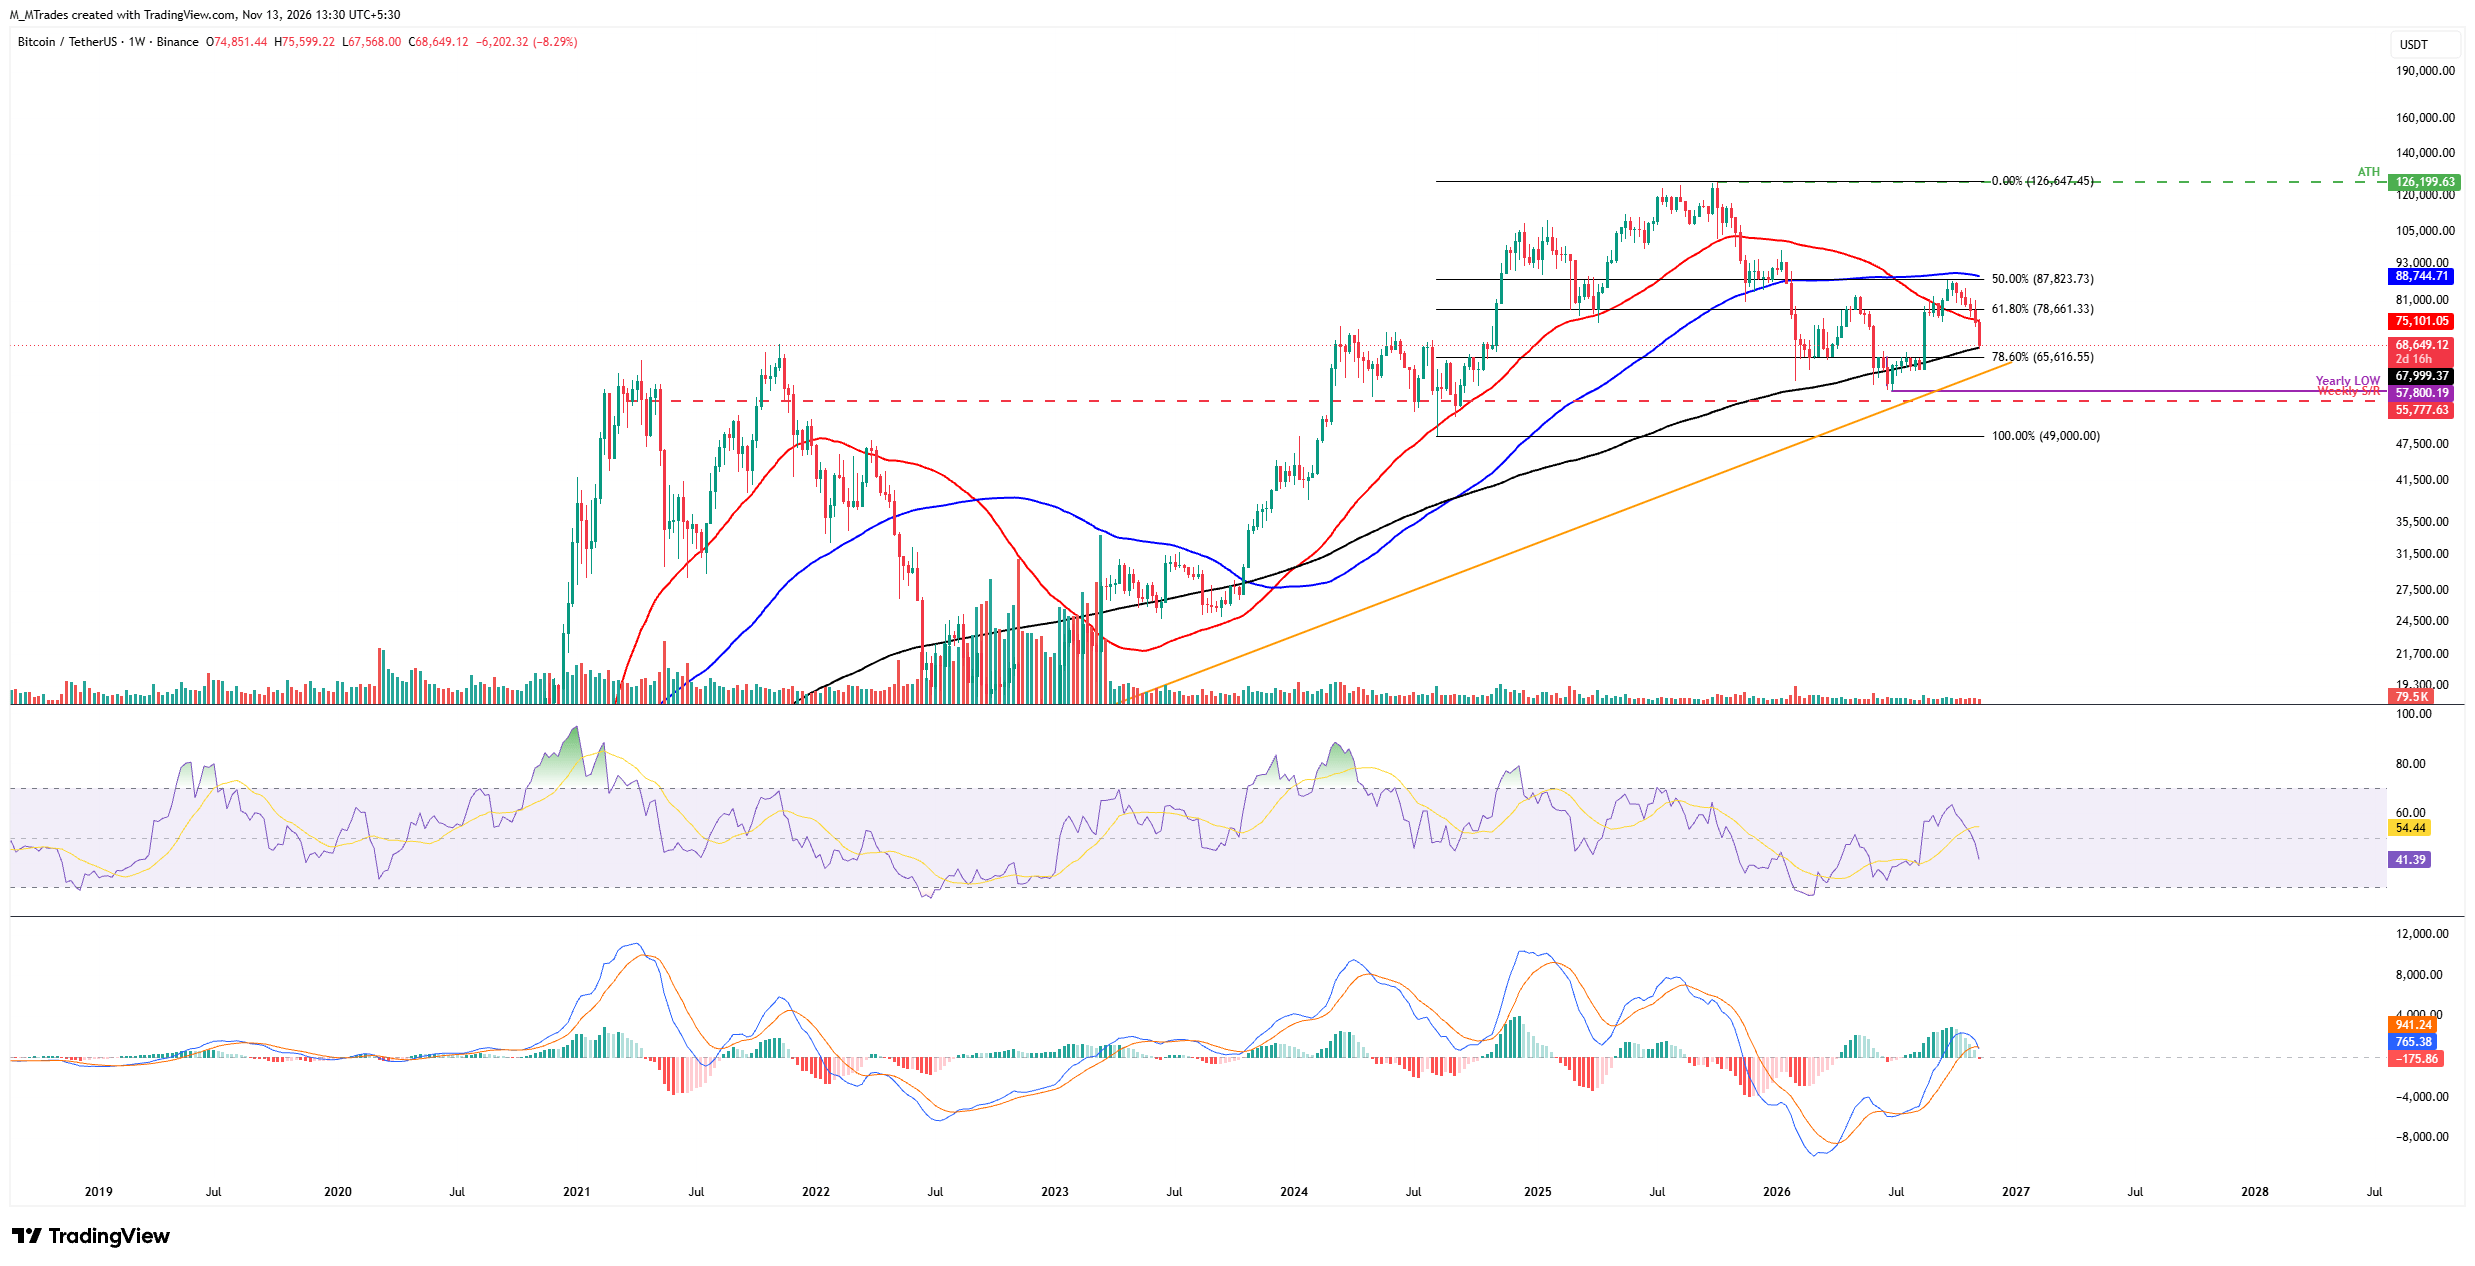
The Crypto King has been correcting since early October, posting five consecutive weeks of losses adding up to a decline of over 13%. It closed below the key 50-week Simple Moving Average (SMA) at $75,101 last week. As of this week, BTC has extended losses by close to 7%, trading near the 200-week SMA at $67,999 on Friday.
If BTC continues its correction, a weekly close below the 200-week SMA at $67,999 could signal a deeper move toward the key psychological level at $60,000.
The Relative Strength Index (RSI) on the weekly chart stands at 41, below the neutral 50 level, suggesting fading bullish momentum. Meanwhile, the Moving Average Convergence Divergence (MACD) histogram showed a red bar this week, further supporting the bearish thesis.
On the other hand, if BTC recovers, it could extend the advance toward the 50-week SMA at $75,101. A successful close and hold of this level could extend the recovery toward the 61.8% Fibonacci retracement level of $78,661 (drawn from the August 2024 low of $49,000 to the October 2025 record high of $126,199).
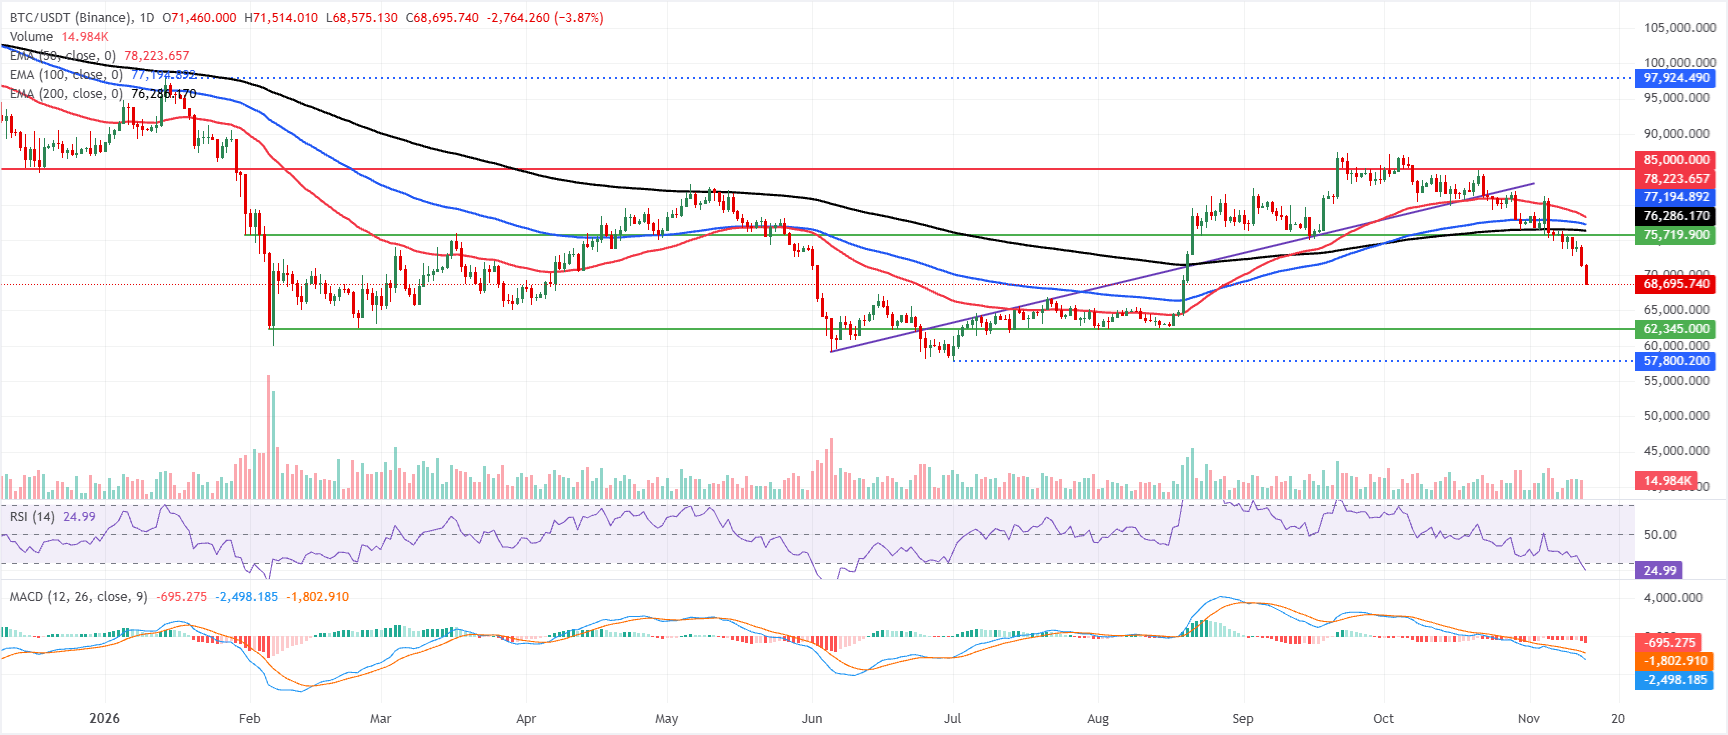
On the daily chart, the Crypto King is extending a bearish phase with price firmly below the 50-day, 100-day and 200-day Exponential Moving Averages (EMAs), which all sit overhead and hint at sustained downside pressure.
The daily RSI has slipped to around 25, entering oversold territory. At the same time, the Moving Average Convergence Divergence (MACD) remains deep in negative territory, with a broadly negative histogram, suggesting bearish momentum remains dominant even as conditions become stretched.
On the topside, initial resistance aligns with the 200-day EMA near $76,286, followed by the 100-day EMA around $77,194 and the 50-day EMA close to $78,223, forming a dense moving-average barrier ahead of a more distant horizontal cap at $85,000.
On the downside, the lack of nearby mapped support suggests that any break below current levels would send BTC toward the psychological support zone around $60,000 before stabilizing.
(The technical analysis of this story was written with the help of an AI tool. Know more.)
Bài viết đề xuất


