


Ripple and Stellar outlook: XRP and XLM extend losses as bears hold strong
- XRP extends losses, trading below $1.093 on Tuesday, with bears aiming for the $1.00 psychological level.
- XLM trades around $0.146 after closing below key support last week, increasing downside risk.
- Weakening on-chain activity, deteriorating derivatives metrics and bearish momentum indicators suggest further losses for XRP and XLM.
Ripple (XRP) and Stellar (XLM) remain under pressure, trading below $1.093 and around $0.146 respectively on Tuesday as bears maintain control of momentum. In addition, weakening on-chain and derivatives metrics suggest that both XRP and XLM are at risk of a deeper correction in the coming days.
Weakening on-chain metrics
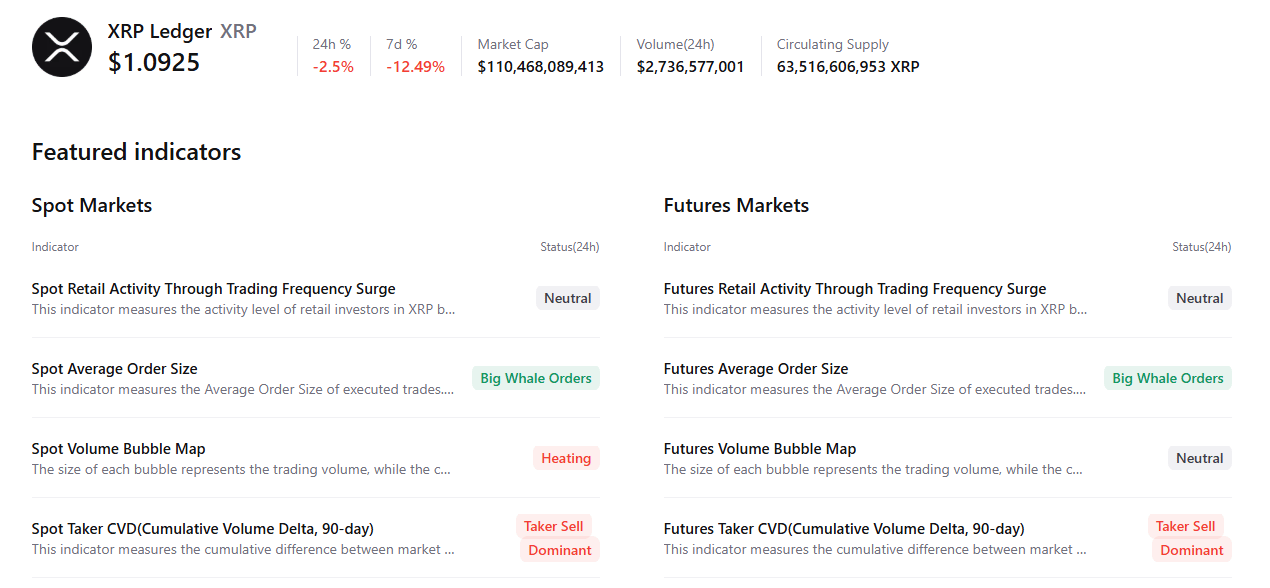
CryptoQuant’s summary data shows a bearish outlook for both altcoins. XRP’s spot and futures markets show large whale orders and sell-side dominance. In addition, the spot market shows heating conditions, highlighting a bearish, cautious sentiment bias among Ripple traders.
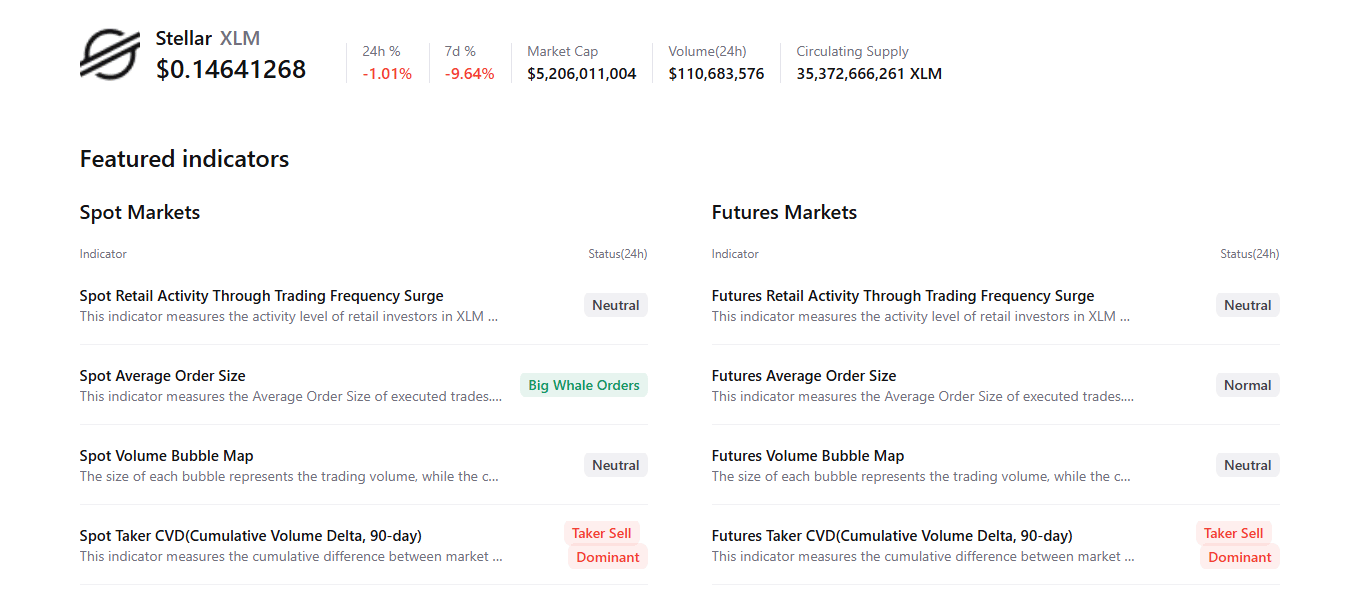
For XLM, spot and futures markets show sell-side dominance, indicating a negative outlook among Stellar traders.
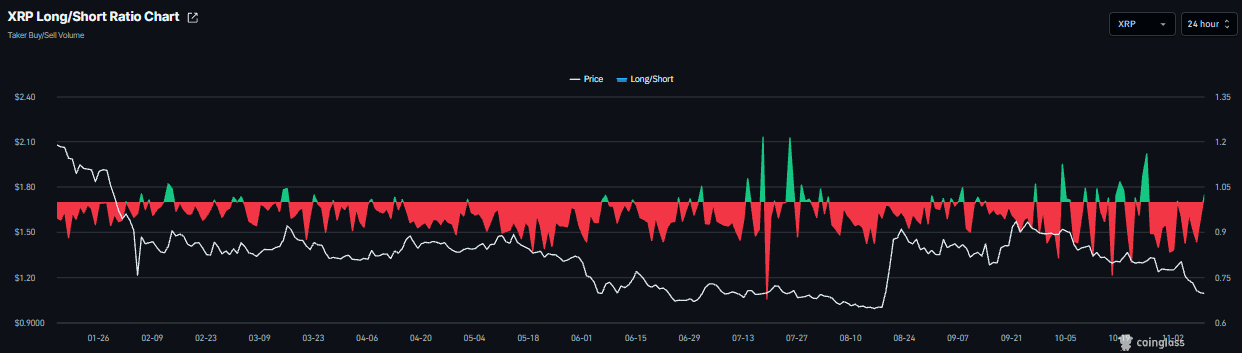
Derivatives metrics also show a mixed outlook. CoinGlass’ long-to-short ratio for XRP flipped into positive territory, reading 1.02 on Tuesday, indicating a modest bullish outlook.
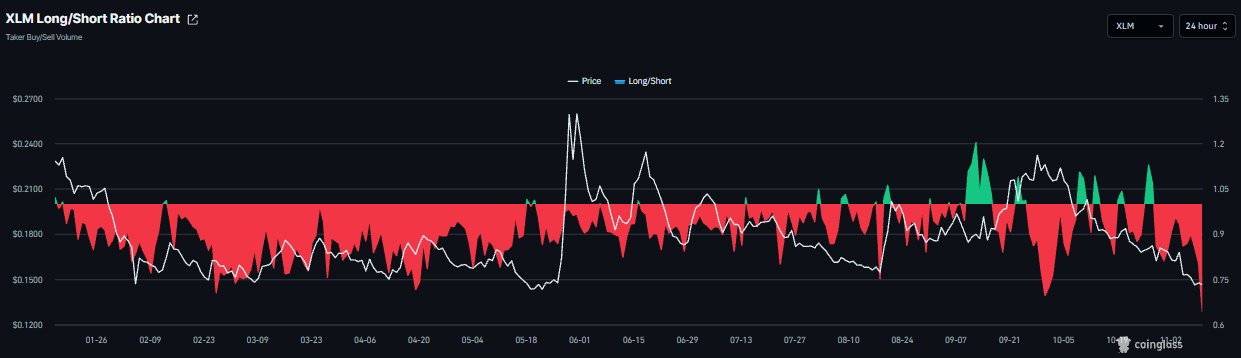
Meanwhile, XLM’s long-to-short ratio remained in negative territory, reading 0.64 on Tuesday, the lowest level over a month. A ratio below one indicates bearish sentiment, as traders bet that asset prices will fall.
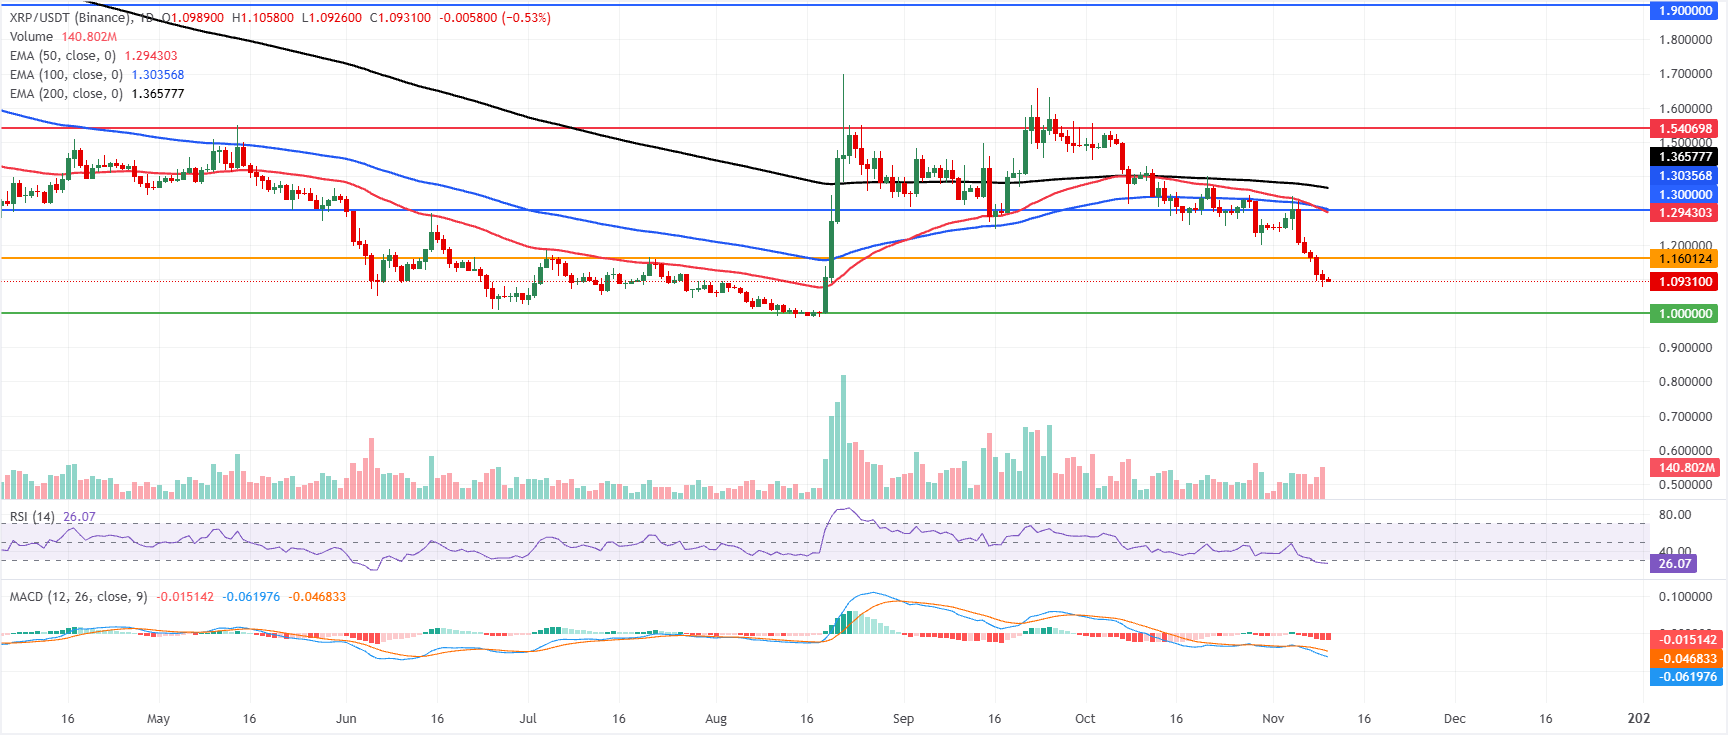
XRP technical outlook: XRP risks further losses as bears eye $1
XRP price trades at $1.093 on Tuesday, extending a bearish phase as it holds well below the 50-day, 100-day, and 200-day Exponential Moving Averages (EMAs) clustered between roughly $1.290 and $1.370.
The Relative Strength Index (RSI) sits deep in oversold territory near 26. At the same time, the Moving Average Convergence Divergence (MACD) remains negative, suggesting selling pressure dominates, even if short-term bounces cannot be ruled out from stretched conditions.
On the topside, initial resistance emerges at $1.160, ahead of a dense cap where the 50-day EMA at $1.294 converges with the horizontal barrier at $1.300 and the 100-day EMA at $1.303. At the same time, the longer-term 200-day EMA at $1.365 reinforces the broader bearish structure, with further hurdles at $1.540 and $1.900.
On the downside, the next notable support sits at the psychological $1.000 area, where buyers may attempt to slow the decline if the current downtrend extends.
XLM technical outlook: Bears in control
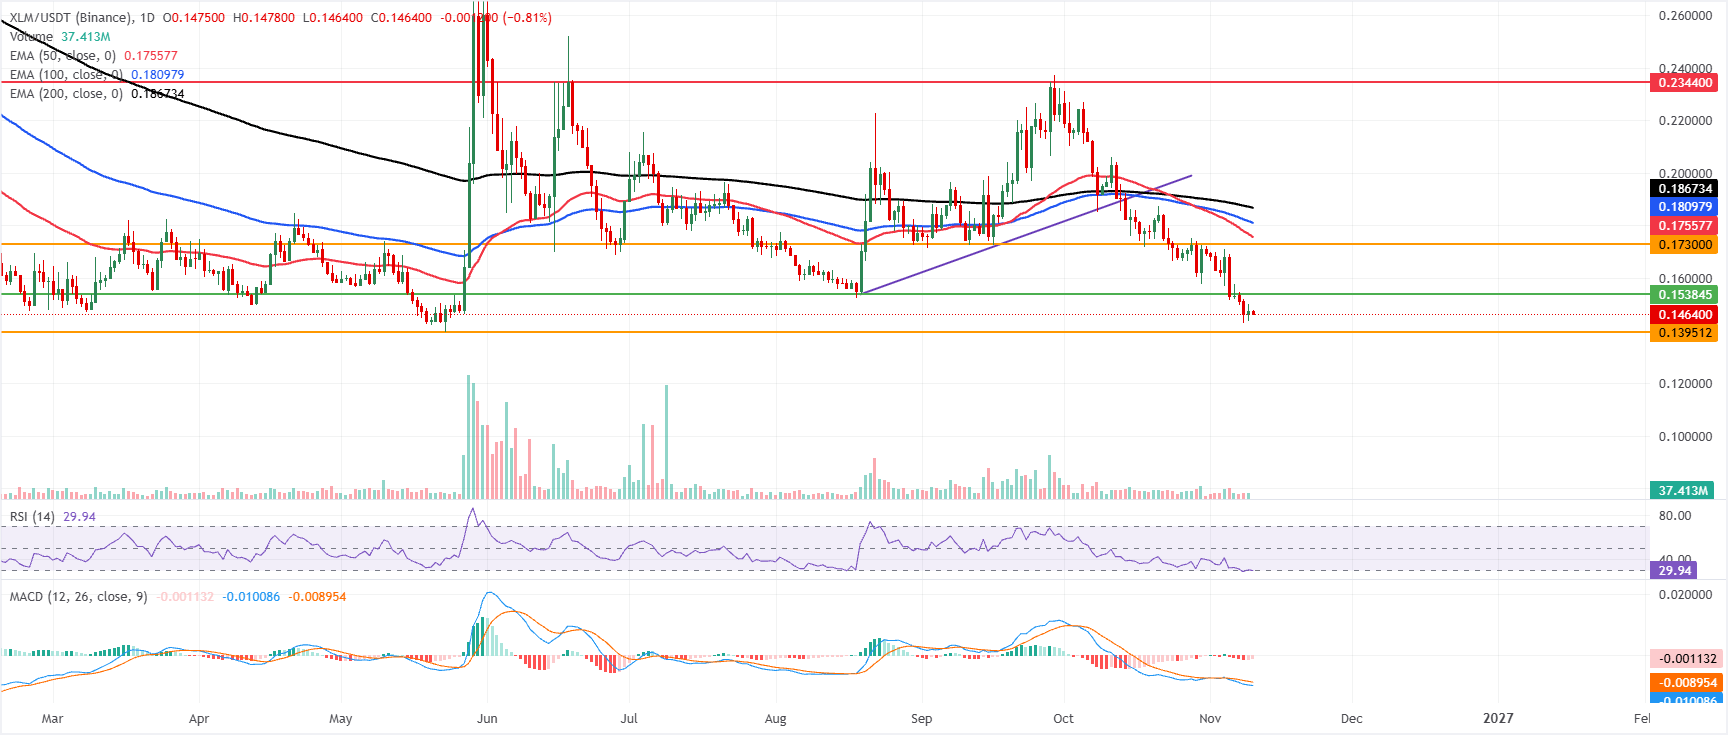
XLM price trades at $0.146 on Tuesday, holding a bearish near-term bias, with price lodged beneath the 50-day, 100-day, and 200-day EMAs clustered between roughly $0.175 and $0.186, reinforcing a capped structure after a sustained slide from the $0.190 area.
The RSI near 30 hints at oversold conditions, while the MACD remains negative, suggesting downside momentum persists even as selling pressure may start to fatigue.
On the topside, initial resistance is at the prior horizontal barrier around $0.153, ahead of $0.173, where the 50-day EMA at $0.175 forms a nearby technical cap. Above that, the 100-day EMA at $0.180 and the 200-day EMA near $0.186 form a denser supply zone, with the next notable resistance only emerging at the higher horizontal level around $0.234.
On the downside, immediate support is located at the horizontal floor near $0.139, and a daily close below this level would expose the pair to a deeper retracement despite the already stretched momentum backdrop.
(The technical analysis of this story was written with the help of an AI tool. Know more.)
Bài viết đề xuất


