


Ethereum Price Forecast: ETH sees profit-taking near $2,700 ahead of key US economic data
Ethereum price today: $2,680
- Ethereum exchange reserves have increased by 125K ETH over the past four days, signaling rising profit-taking.
- ETH ETF inflows have declined in the past few days ahead of US inflation and labor market data releases.
- ETH continues consolidation near $2,700 and above all key EMAs.
Ethereum (ETH) has shown signs of profit-taking near $2,700 over the past few days, with rising exchange deposits and a slowdown in exchange-traded fund (ETF) inflows ahead of US inflation and labor market data releases.
Geopolitical and macro pressures weigh on ETH
The top altcoin's Exchange Reserves, which track the total amount of a crypto asset held across exchange wallets, have increased by roughly 125K ETH since Friday. The increase, amid geopolitical pressures, suggests more coins are flowing into exchanges for potential profit-taking.
-1790719849895.png)
The move is reflected in over $222 million in realized profits on Friday, before easing over the past few days, according to Santiment data.
The Coinbase Premium Index, a measure of US sentiment, has also been trending down after a modest recovery last week, reaching -0.0483, its lowest level in nearly two weeks.
Similarly, inflows into US spot ETH exchange-traded funds (ETFs) have been contracting, falling from $269.9 million a week ago to $17.1 million on Monday, according to SoSoValue data.
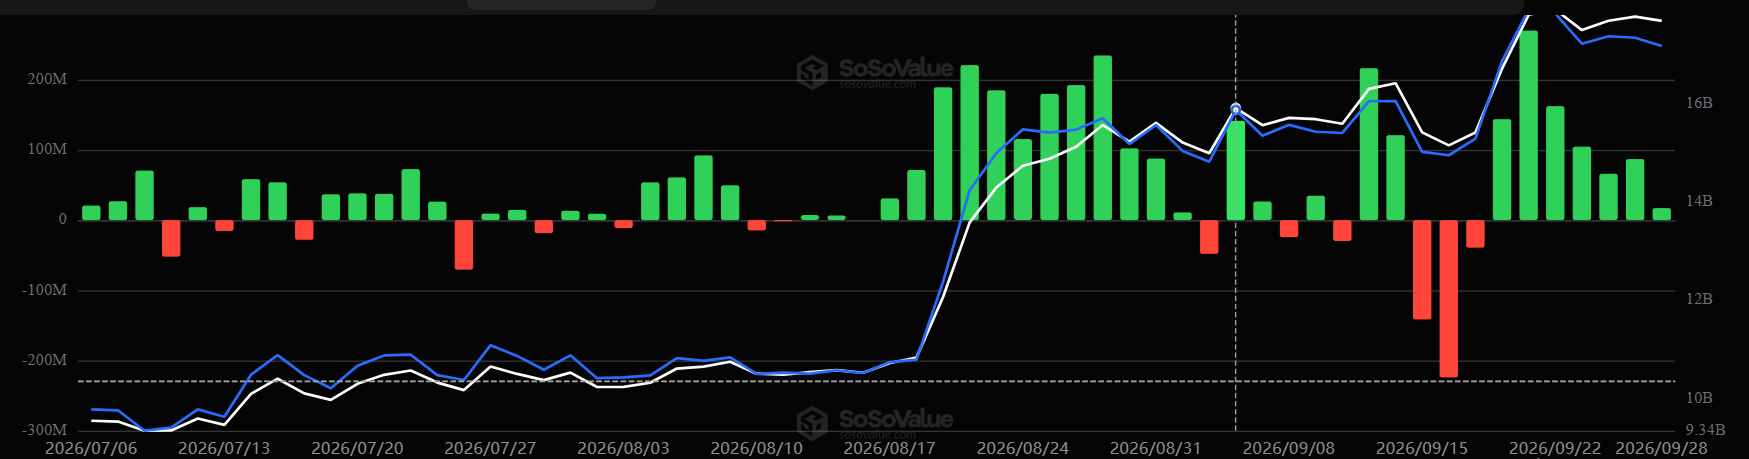
With the market slowdown, investors are likely de-risking ahead of US inflation and labor market data coming up Wednesday and Friday.
Lingering geopolitical pressure is also weighing on the market. Peace talks between the US and Iran are yet to progress after President Trump rejected the latter's ceasefire proposal.
The move has caused the US 10Y Note Yield to continue soaring, up by roughly 70 basis points on the monthly timeframe. The bond market is now pricing in four more 25-basis-point rate increases by June 2027, according to The Kobeissi Letter in an X post on Tuesday.
Ethereum technical outlook: Consolidation continues near $2,700 as market awaits catalyst
Ethereum has recorded $61.6 million in liquidations over the past 24 hours, led by $33.7 million in short liquidations.
On the daily chart, ETH is sustaining a bullish near-term bias as it consolidates above all key Exponential Moving Averages (EMAs), while the 14-day Relative Strength Index (RSI) at 62 and Stochastic at 71 lean constructive.
On the downside, initial support is seen in the 2,612–2,626 area, where the 20-day EMA at $2,612 aligns with the horizontal level at $2,626, followed by $2,544 and a deeper cushion at $2,431 near the prior consolidation floor. Further below, the $2,275 region marked by the 100-day EMA, ahead of $2,172 and $1,961, should limit a more pronounced pullback.
On the topside, immediate resistance emerges at $2,786, with subsequent barriers at $2,894 and $3,177. A daily close above $2,786 would open the way for a retest of the higher resistance band and extend the current bullish phase.
(The technical analysis of this story was written with the help of an AI tool. Know more.)
Bài viết đề xuất


