


Crypto Today: Bitcoin, Ethereum, XRP bulls regain strength amid steady capital inflows
- Bitcoin rises, targeting a $80,000 breakout as market sentiment supports ETF inflows.
- Ethereum recovery gains momentum for the second consecutive day, trading above $2,500 on Thursday.
- XRP holds support at $1.40, building on strong momentum indicators and bullish moving averages.
Cryptocurrency prices are broadly edging higher on Thursday, led by Bitcoin’s (BTC) uptick near $80,000. Altcoins mirror Bitcoin’s short-term bullish outlook, with Ethereum (ETH) trading above $2,500 and Ripple (XRP) hovering above its key $1.40 support.
Crypto market sentiment improves as capital inflows extend
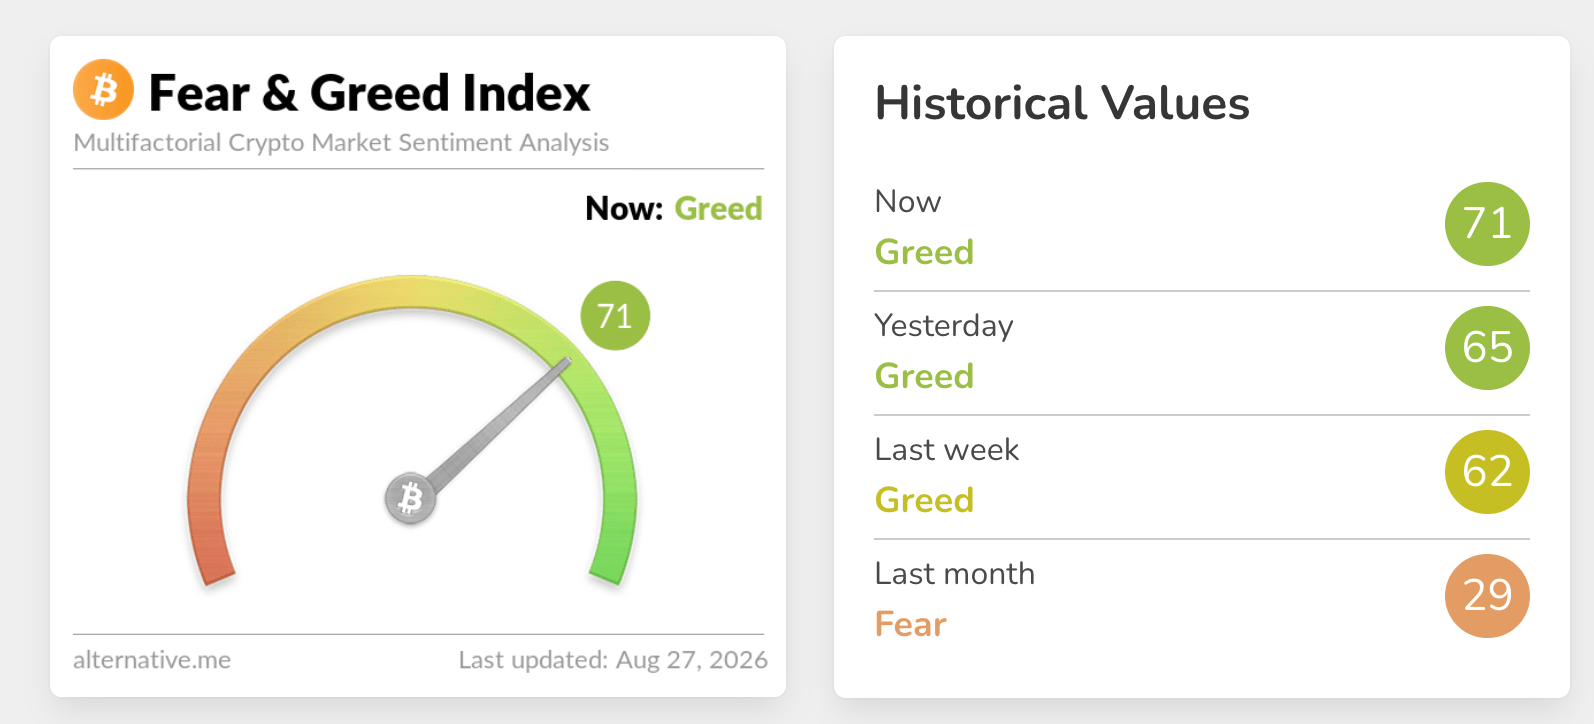
Appetite for digital asset investment products has continued to grow since early last week, aligning with improving market sentiment. According to the Fear & Greed Index, market sentiment holds in the Greed territory at 71 on Thursday, up from 65 the day before. This affirms the broader bullish outlook, as evidenced by steady capital inflows into spot Exchange-Traded Funds (ETFs).
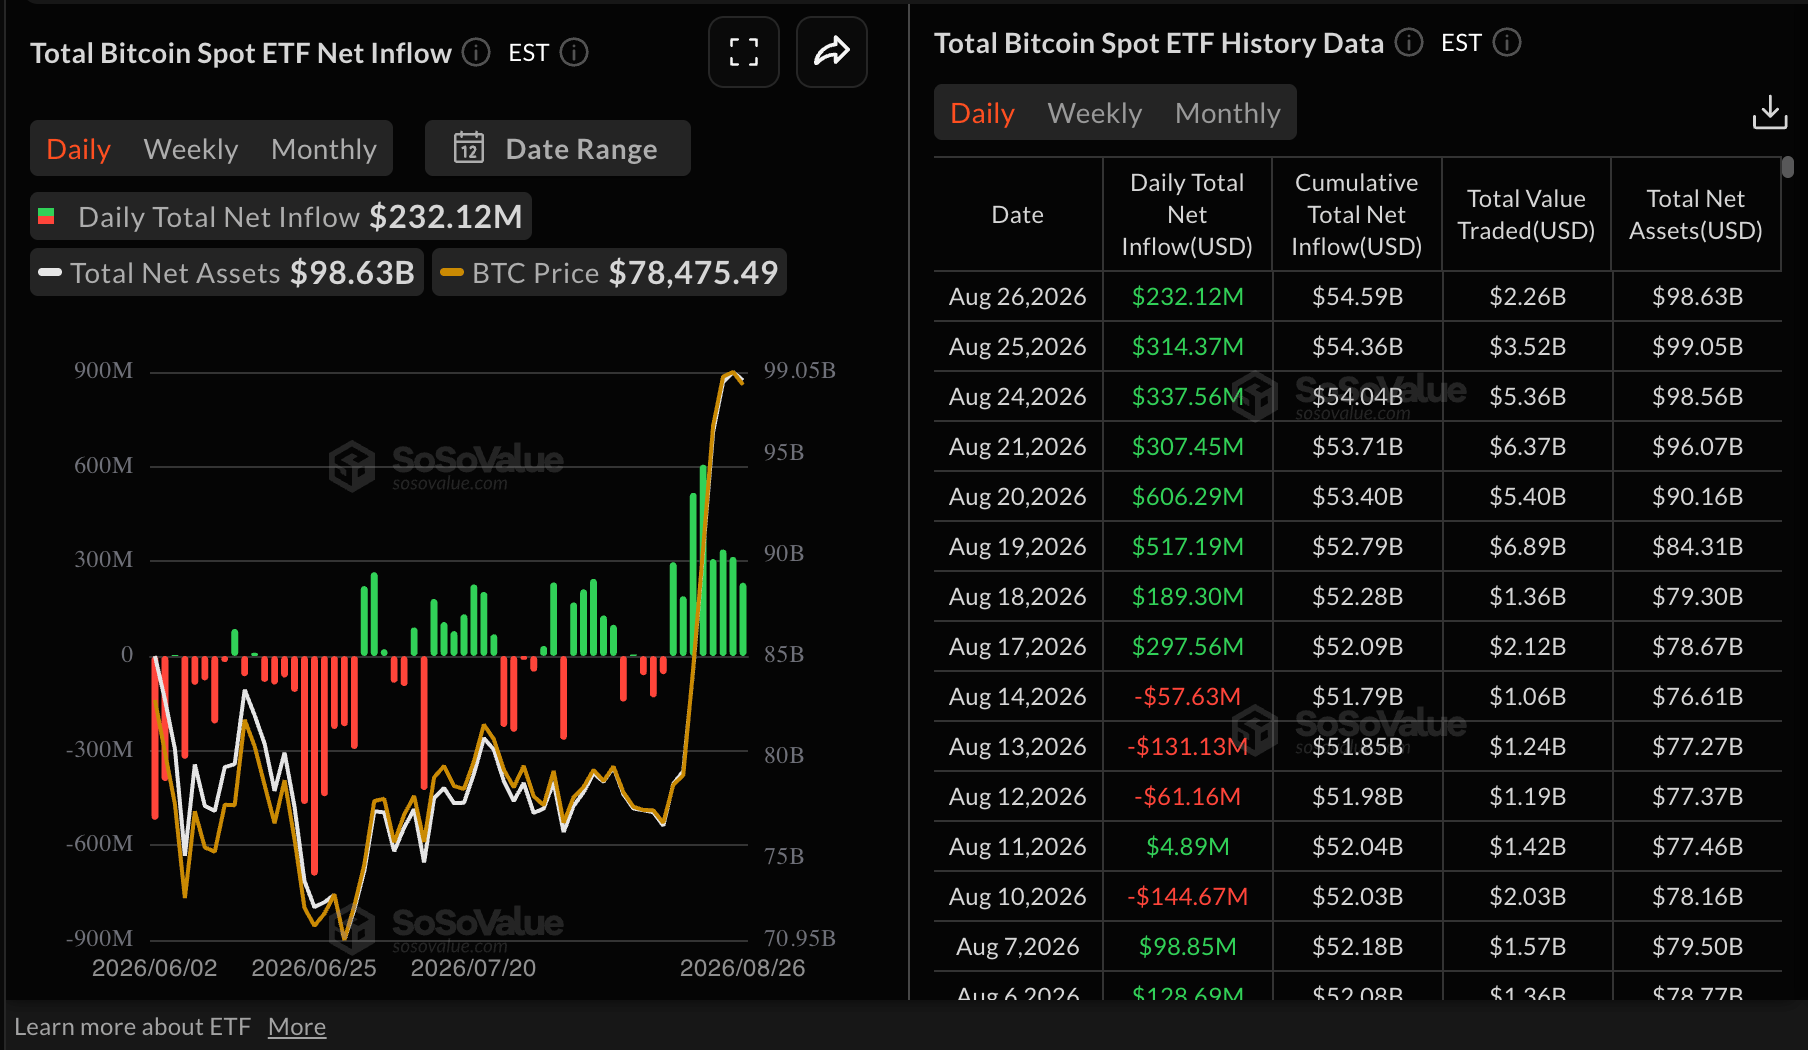
Bitcoin spot ETFs are extending a notable bullish streak, with inflows averaging $232 million on Wednesday. Last week’s inflows surged to $1.92 billion, the strongest since October, underscoring an institutional investor comeback following months of uncertainty and price doldrums. This week’s cumulative inflows stand at $884 million through Wednesday, reinforcing growing risk appetite.
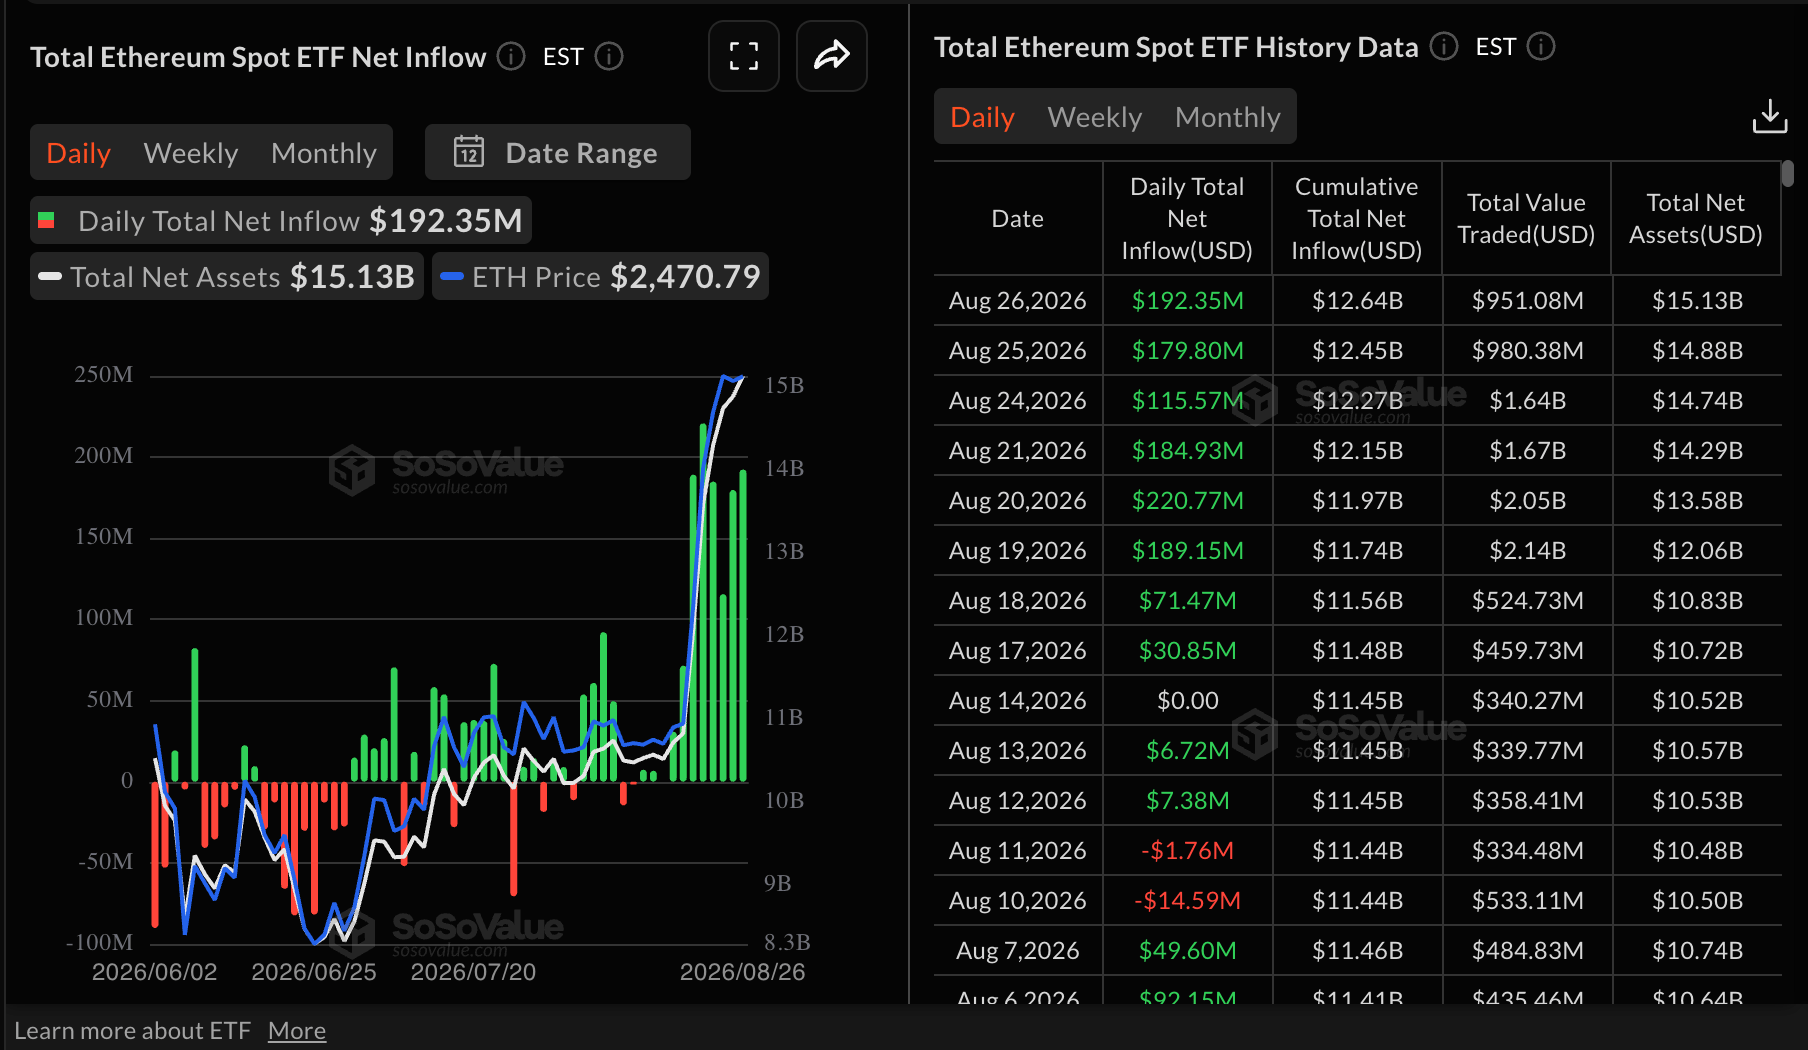
Ethereum continues to attract bullish interest, underpinned by consistent spot ETF inflows. Data from SoSoValue shows that US-listed ETFs drew $192 million in inflows on Wednesday, up from $180 million the previous day. Sustained risk-on appetite could offset profit-taking pressure and significantly increase the odds of a breakout above $2,600.
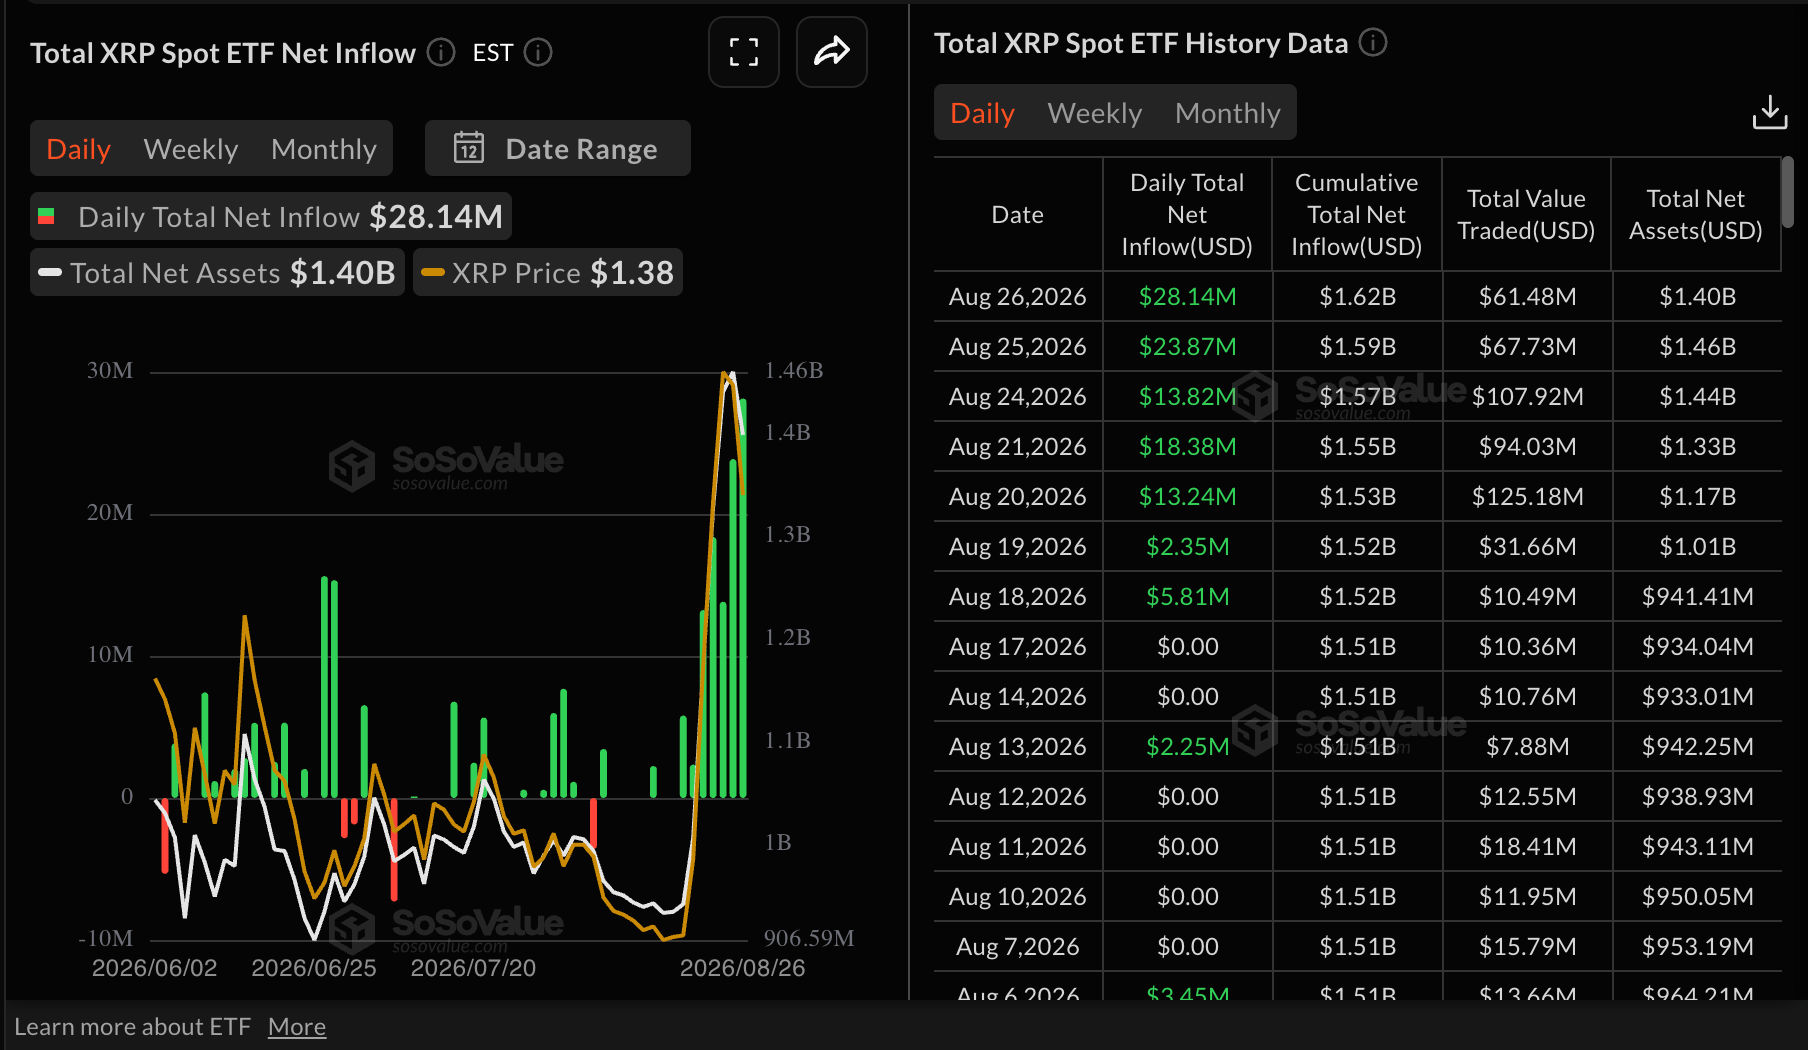
XRP spot ETFs continue to gain momentum, with inflows surging to $28 million on Wednesday, up from $24 million the previous day. This pushed cumulative inflows to $1.62 billion. Meanwhile, total assets under management average $1.40 billion.
CryptoQuant analysts highlighted in the weekly report, published on Wednesday, that the platform’s Bull Score metric “has surged into bull-market territory, the strongest reign in nearly a year.”
The Bull Score blends 10 key on-chain, market, and valuation metrics into a 0–100 gauge. Historically, readings above 60 have aligned with extended rallies, and the score has surged from 30 to 80 in just one week.
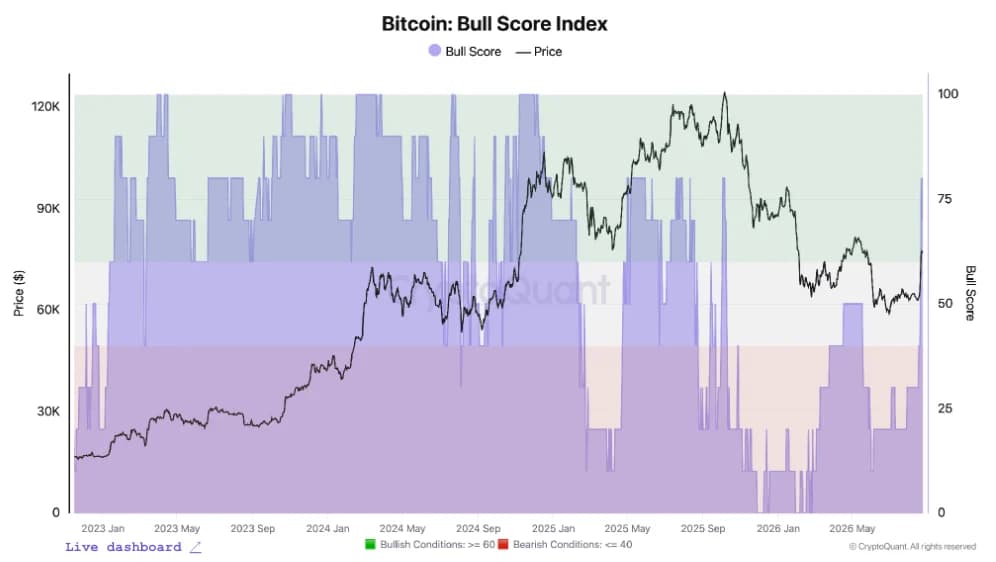
Despite the apparent regime shift from a bearish to a bullish market, CryptoQuant cautions that the near-term market appears short-term overheated.
“Trader profit margins are stretched at 20.5%, whales have booked record profits, and exchange inflows are rising across BTC, ETH and XRP,” CryptoQuant highlighted in the weekly report. The report added that “an early-cycle pullback, or resistance at the $83,000 moving average, would be unsurprising — and healthy — before the new trend resumes.”
Technical analysis: Bitcoin eyes short-term breakout
Bitcoin trades above $79,500, extending its advance well above the key Exponential Moving Averages (EMAs), which keeps the near-term bias firmly bullish. This reinforces a well-defined structural floor after the breakout through the downward resistance trendline around $68,020.
However, the Relative Strength Index (RSI) at 81 points to overstretched conditions, while the Moving Average Convergence Divergence (MACD) indicator retreats from recent highs, hinting that upside momentum is strong but starting to cool.
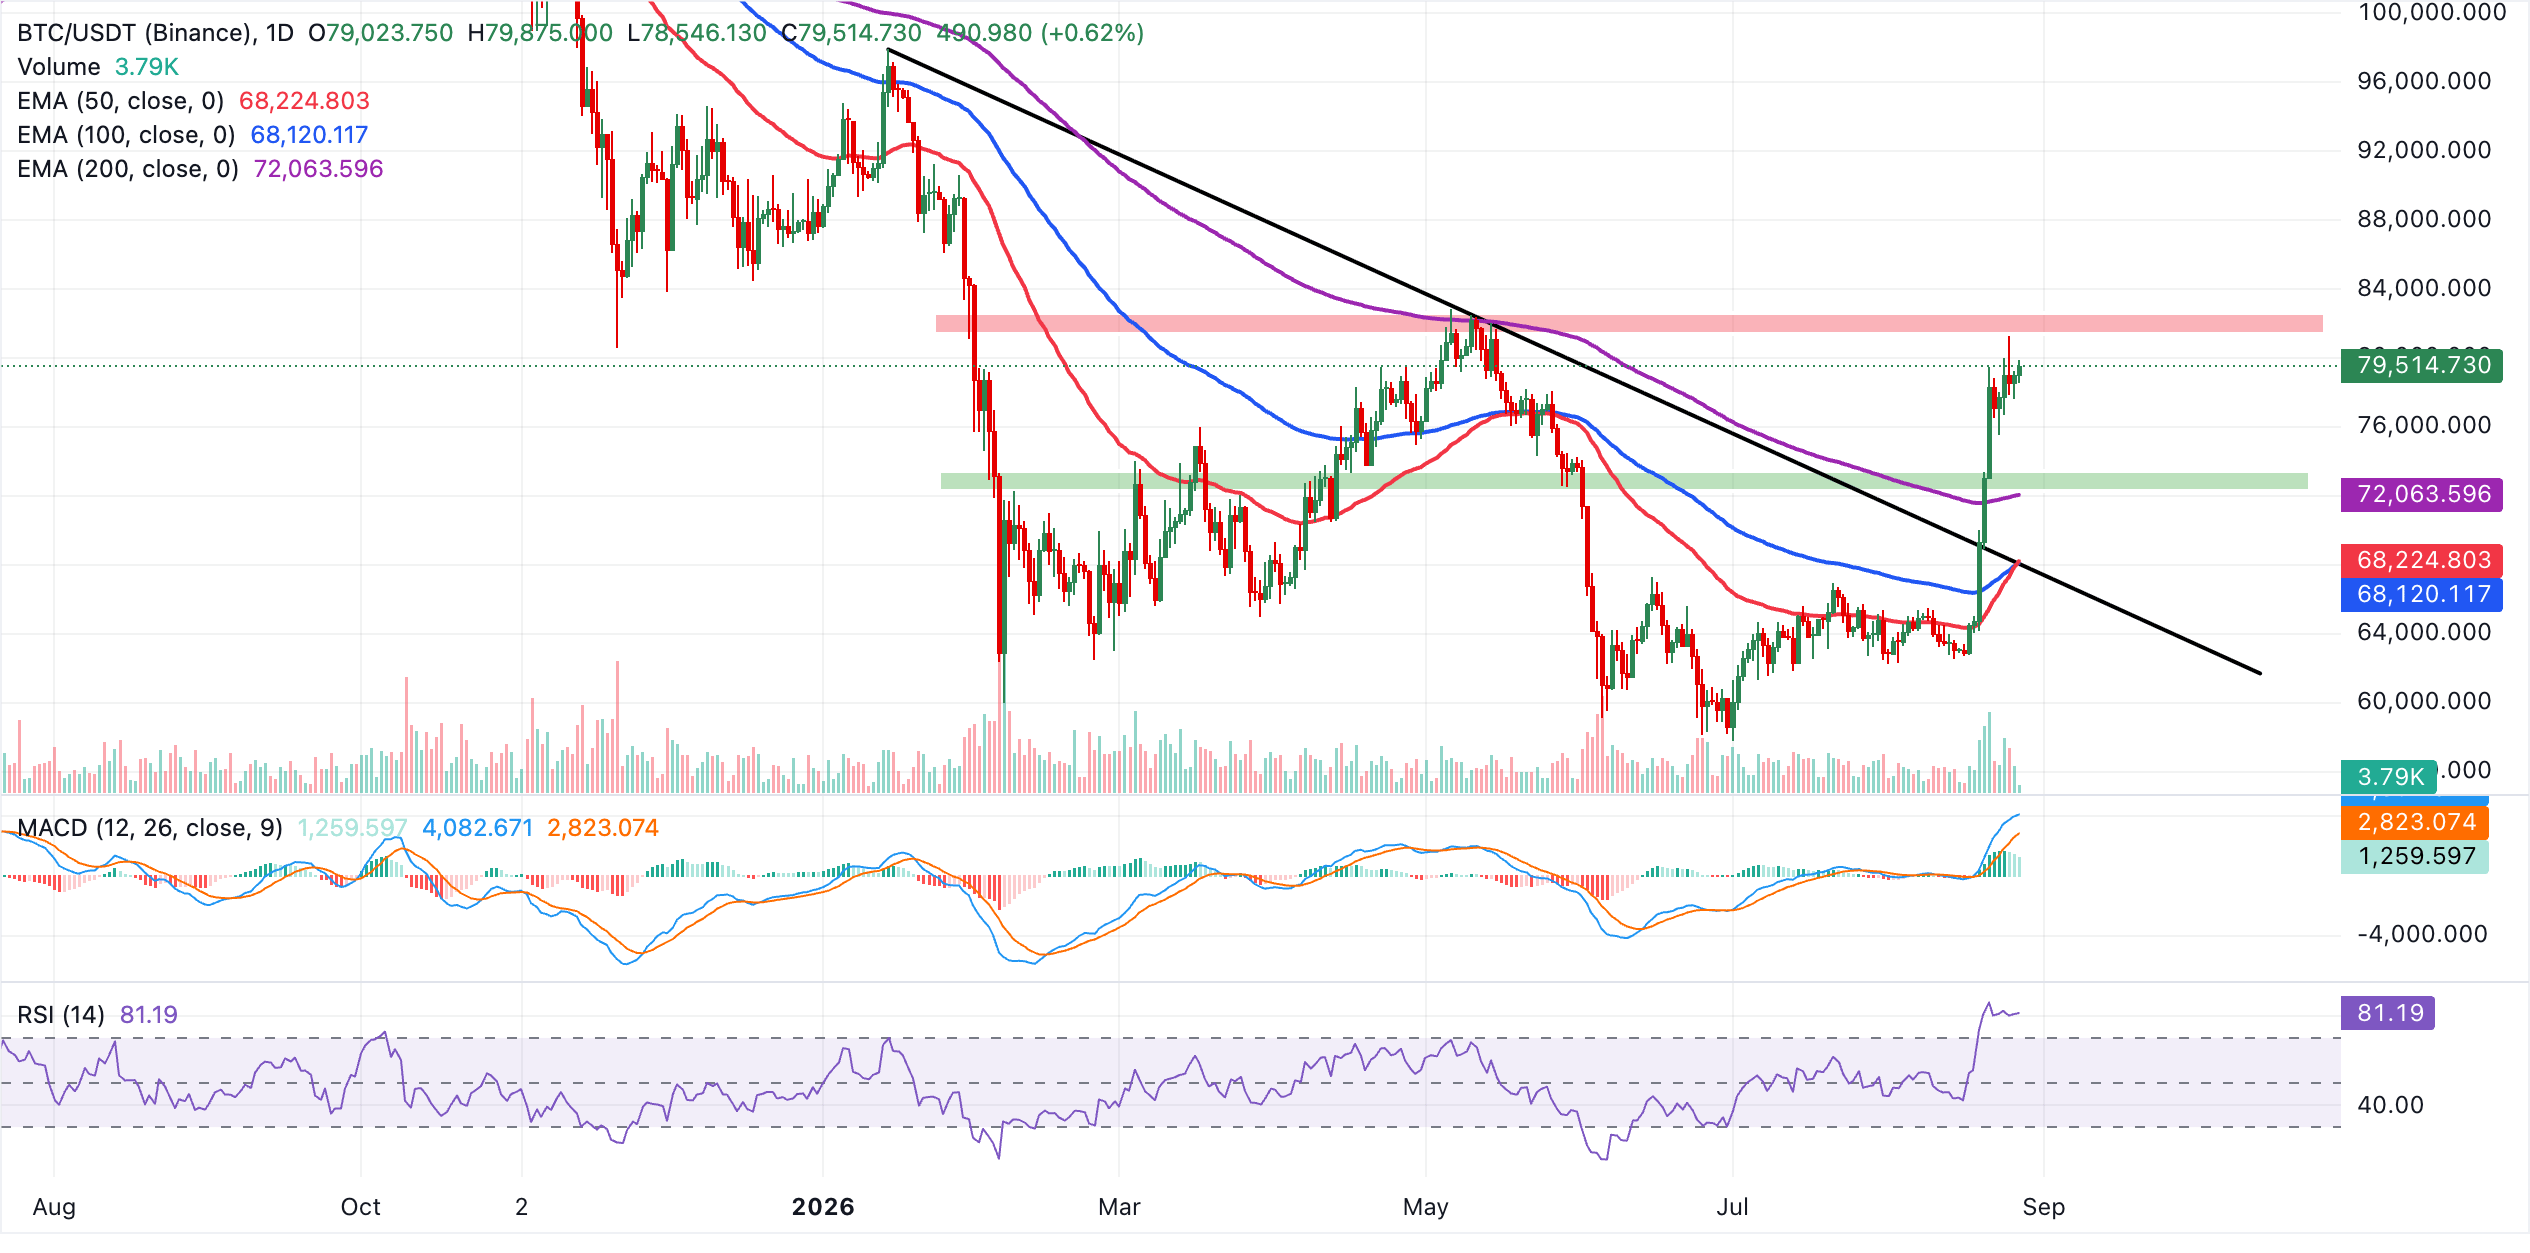
Immediate support sits at $79,500, followed by the 200-day EMA at $72,064. Below that, a broader demand zone emerges from the EMA cluster, with the 50-day EMA around $68,225, the 100-day EMA near $68,120 and the descending trendline break level at $68,020 likely to attract dip-buying on deeper pullbacks. On the upside, the token needs a daily close above $80,000 to validate the anticipated move toward the next key levels at $83,000 and $88,000, respectively.
Altcoins technical outlook: Ethereum and XRP bulls retain control
Ethereum trades at $2,530, extending a bullish near-term bias as price holds well above the key EMAs, hinting at a solidly supported uptrend structure. Momentum remains strong, with the MACD in positive territory and its latest reading elevated, while the RSI near 78 keeps the pair overbought, suggesting the rally could face consolidation or corrective pullbacks.
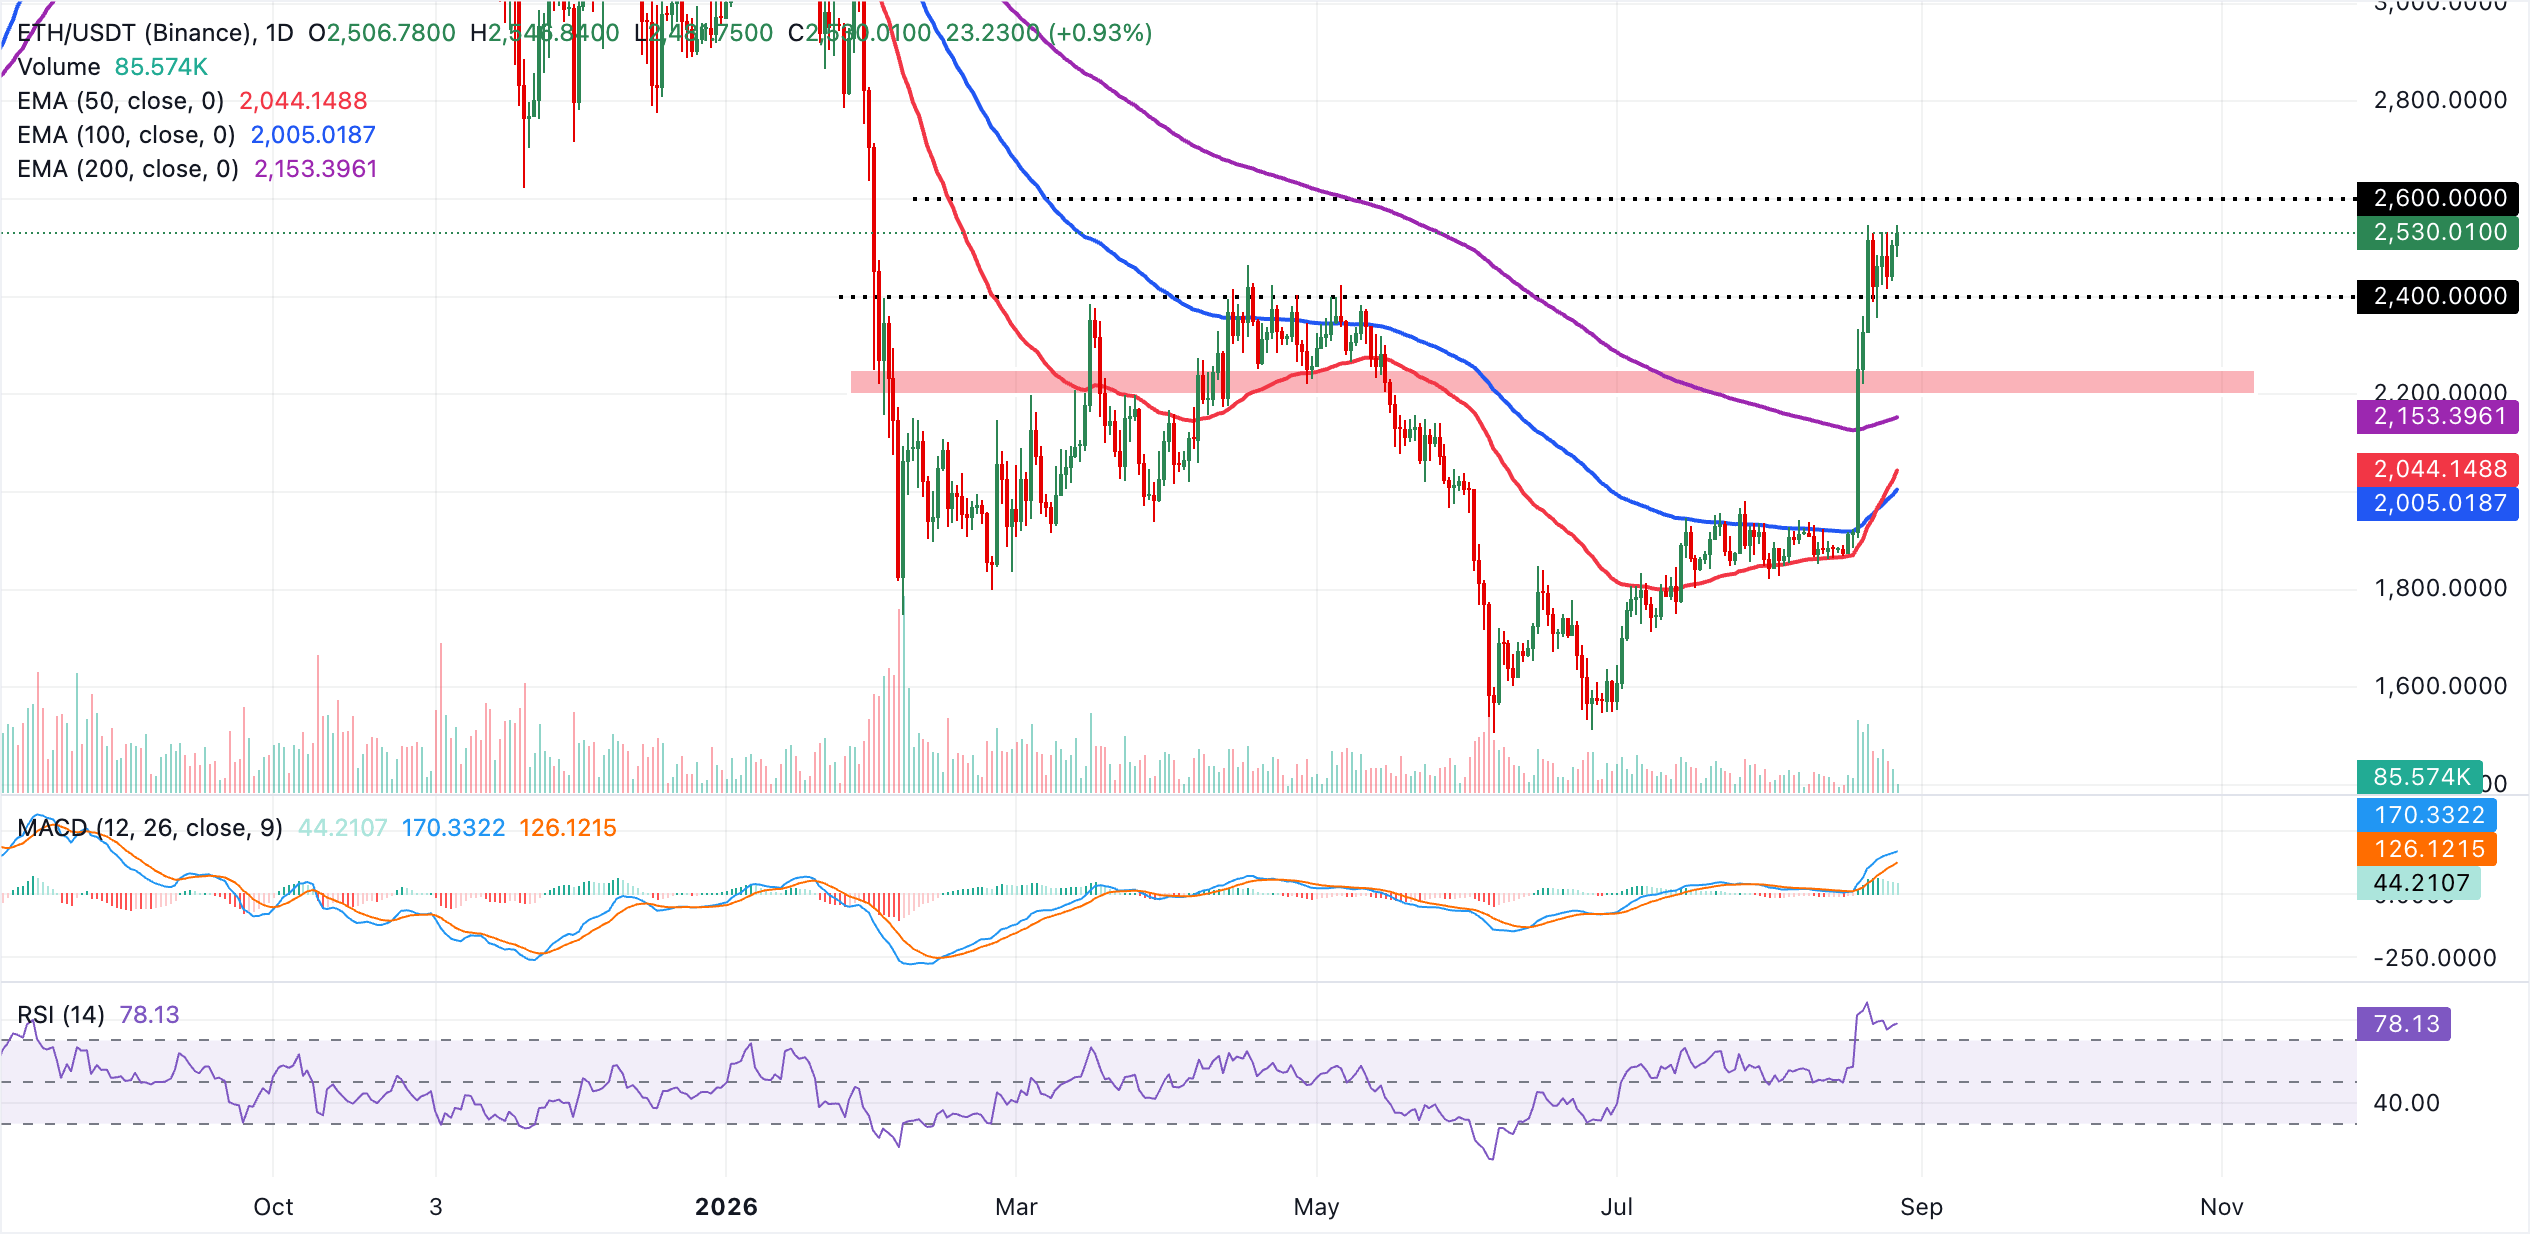
Initial demand appears at the 200-day EMA around $2,153, the first major support if price retreats from current highs. Below that, the 50-day EMA clustered near $2,044 and the 100-day EMA at roughly $2,005 form a broader support zone that should attract dip-buying on deeper corrections. As long as ETH holds above these EMA layers, the broader technical picture would continue to favor buyers, even if overbought readings trigger short-term pauses in the advance.
XRP, on the other hand, trades at $1.44, extending its bullish breakout above the main moving averages. The spot price now holds above the 50-day, 100-day, and 200-day EMAs, suggesting a firmly supported near-term structure after reclaiming the falling trendline break area around $1.00.
The RSI at about 72 is pushing into overbought territory, while the MACD remains positive and above zero, hinting that upside momentum is strong but increasingly stretched.
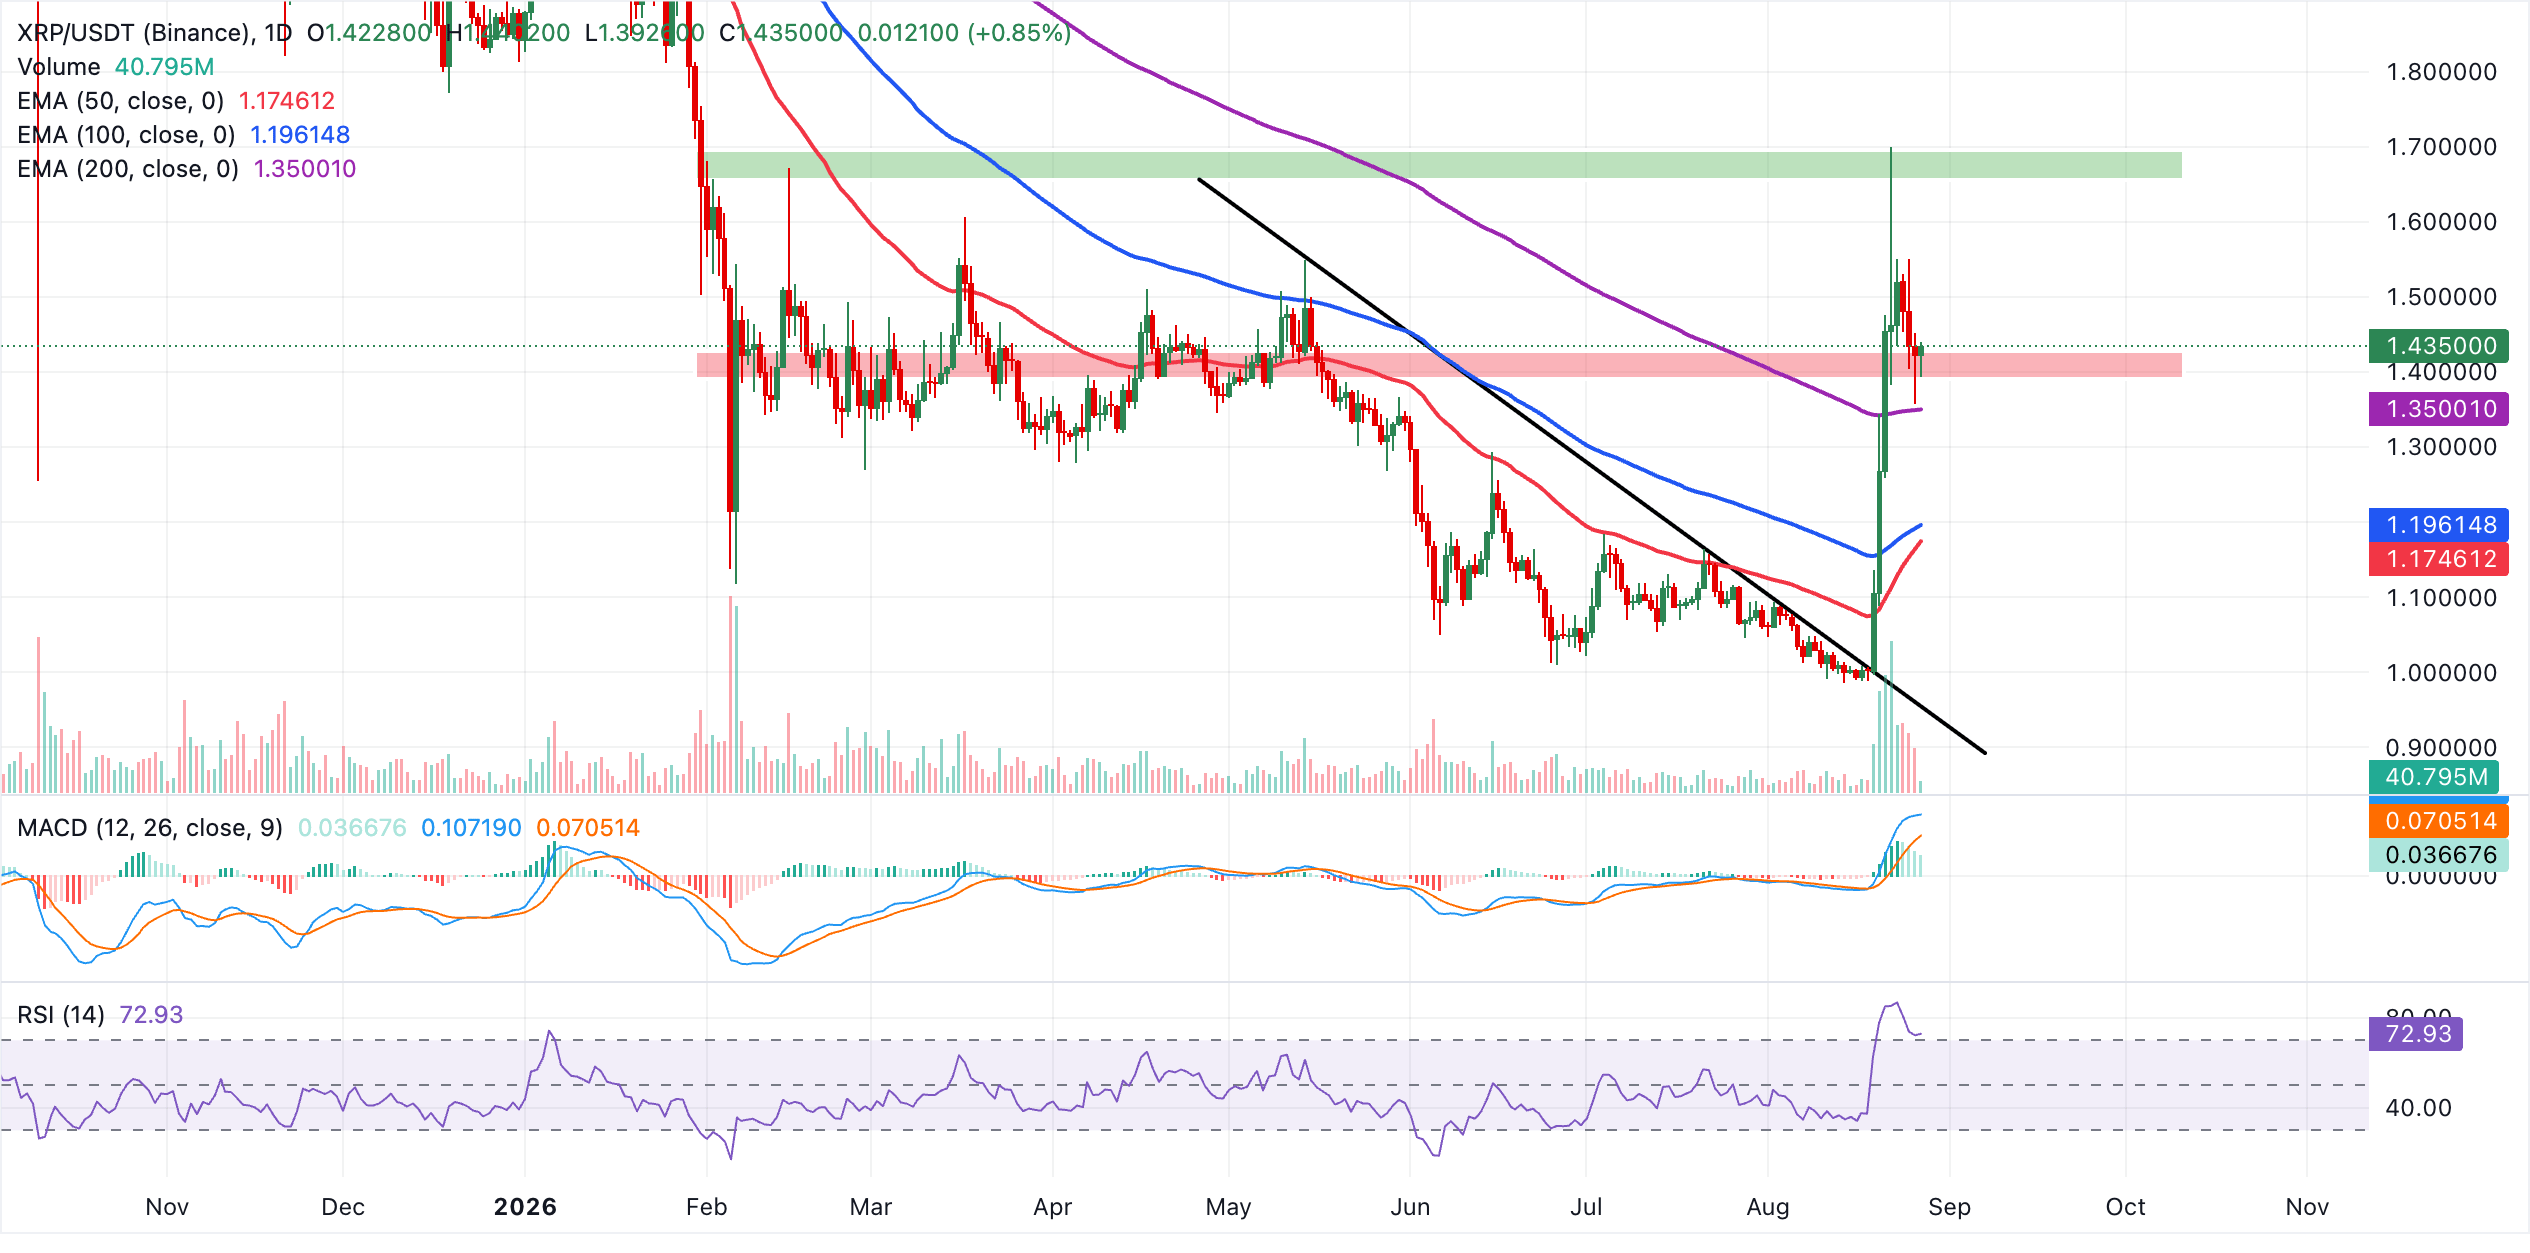
Initial support lies at the $1.44 day open pivot, with the 200-day EMA near $1.35 reinforcing a deeper floor, backed by the 100-day and 50-day EMAs at $1.20 and $1.17 and the reclaimed trendline break region around $1.00. On the topside, the next notable resistance is projected at the downward-sloping trendline start point near $1.66, where buyers could face profit-taking if the overbought signals begin to unwind.
(The technical analysis of this story was written with the help of an AI tool. Know more.)
Crypto ETF FAQs
An Exchange-Traded Fund (ETF) is an investment vehicle or an index that tracks the price of an underlying asset. ETFs can not only track a single asset, but a group of assets and sectors. For example, a Bitcoin ETF tracks Bitcoin’s price. ETF is a tool used by investors to gain exposure to a certain asset.
Yes. The first Bitcoin futures ETF in the US was approved by the US Securities & Exchange Commission in October 2021. A total of seven Bitcoin futures ETFs have been approved, with more than 20 still waiting for the regulator’s permission. The SEC says that the cryptocurrency industry is new and subject to manipulation, which is why it has been delaying crypto-related futures ETFs for the last few years.
Yes. The SEC approved in January 2024 the listing and trading of several Bitcoin spot Exchange-Traded Funds, opening the door to institutional capital and mainstream investors to trade the main crypto currency. The decision was hailed by the industry as a game changer.
The main advantage of crypto ETFs is the possibility of gaining exposure to a cryptocurrency without ownership, reducing the risk and cost of holding the asset. Other pros are a lower learning curve and higher security for investors since ETFs take charge of securing the underlying asset holdings. As for the main drawbacks, the main one is that as an investor you can’t have direct ownership of the asset, or, as they say in crypto, “not your keys, not your coins.” Other disadvantages are higher costs associated with holding crypto since ETFs charge fees for active management. Finally, even though investing in ETFs reduces the risk of holding an asset, price swings in the underlying cryptocurrency are likely to be reflected in the investment vehicle too.
Bài viết đề xuất


