


Top Altcoins Price Forecast: Ripple, Cardano, and Solana vulnerable to deeper losses
- Ripple extends losses on Thursday for the fourth consecutive day, risking a drop below $1.00.
- Cardano edges lower, risking a drop to the 50-day EMA at $0.1766 as bullish momentum eases.
- Solana remains capped below the 50-day EMA and the declining resistance trendline near $75.49.
Ripple (XRP), Cardano (ADA), and Solana (SOL) are trading in the red on Thursday, facing downside pressure. The technical outlook for altcoins is bearish, as XRP risks falling below $1.00, ADA is eyeing the 50-day Exponential Moving Average (EMA) at $0.1766, and SOL remains capped below a cluster of resistance levels.
Technical outlook: Could XRP, ADA, and SOL extend their losses?
Ripple edges lower on Thursday, testing the bearish breakout of a rising support trendline near $1.0500. XRP extends a bearish near-term bias as price holds beneath the 50-day EMA at $1.1143 and the longer-term 200-day EMA at $1.3938, suggesting the broader trend remains under pressure.
Momentum is weak, with the Relative Strength Index (RSI) hovering near 38, approaching the oversold zone, while the Moving Average Convergence Divergence (MACD) descends below the signal line, hinting at lingering selling pressure.
A decisive close below $1.0500 could confirm the downside release, risking a drop below the $1.0000 psychological threshold. The S1 and S2 pivot levels at $0.9945 and $0.9271, respectively, serve as downside support levels.
On the topside, initial resistance appears at the descending trendline around $1.1050, where a daily close above this level would open the way toward the 50-day EMA at $1.1143 and the R1 pivot level at $1.1568.
Cardano extends losses below $0.1900 at press time on Thursday, after the $0.2000 psychological barrier capped its recent recovery. Still, ADA holds a mild bullish bias in the near term, as price remains above the 50-day EMA at $0.1766 but well below the 200-day EMA at $0.2627, indicating that the broader trend remains challenged.
Momentum backs this upside tilt, with the RSI holding around 62 as it reverses from the overbought boundary, while the MACD, in positive territory, remains above the signal line, suggesting buyers retain control.
On the downside, initial support is seen at the 50-day EMA at $0.1766, with a deeper structural floor near the horizontal level at $0.1382, marked by the June 25 low.
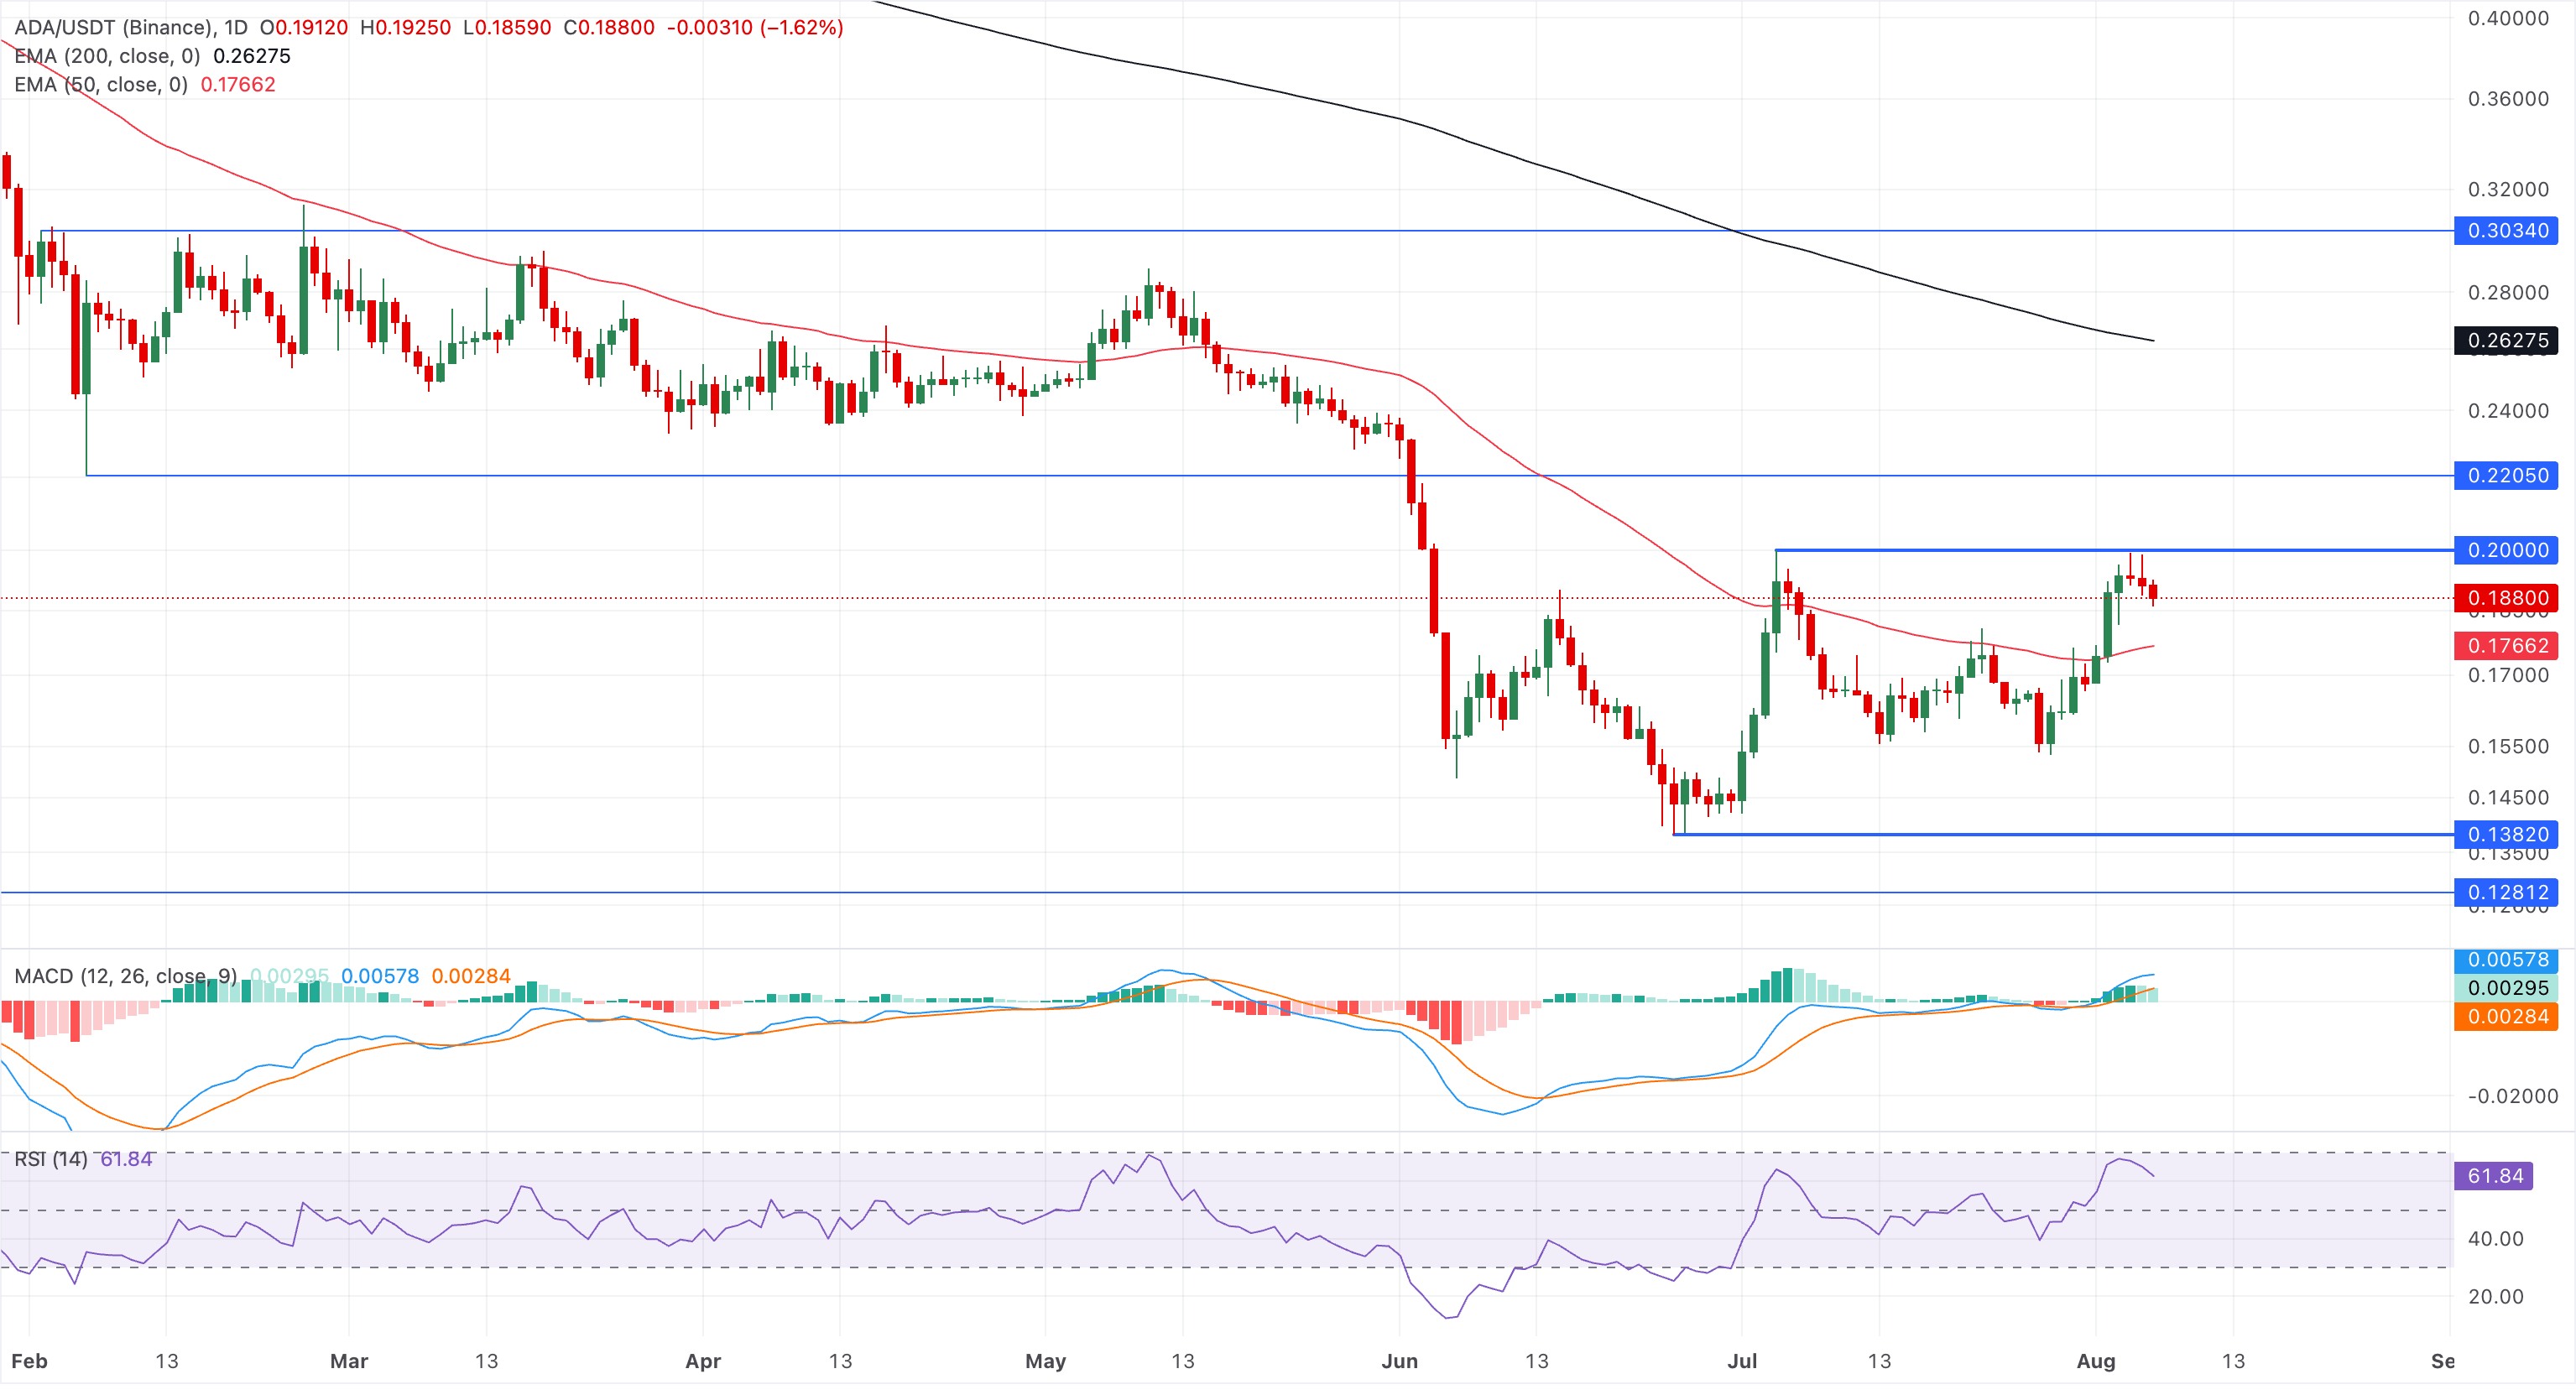
To reinstate an upward trend, ADA must clear above the $0.2000 mark, which could open the path toward the 200-day EMA at $0.2627.
Solana trades below $75 on Thursday, keeping a bearish near-term bias below the 50-day EMA at $75.50 and the 200-day EMA at $92.60. SOL also remains below the downward resistance trendline near $75.25, which acts as an immediate cap.
Solana must sustain a decisive close above this zone to reinstate a recovery toward the 200-day EMA at $92.60. The RSI around 46 and a slightly negative MACD reinforce waning upside momentum.
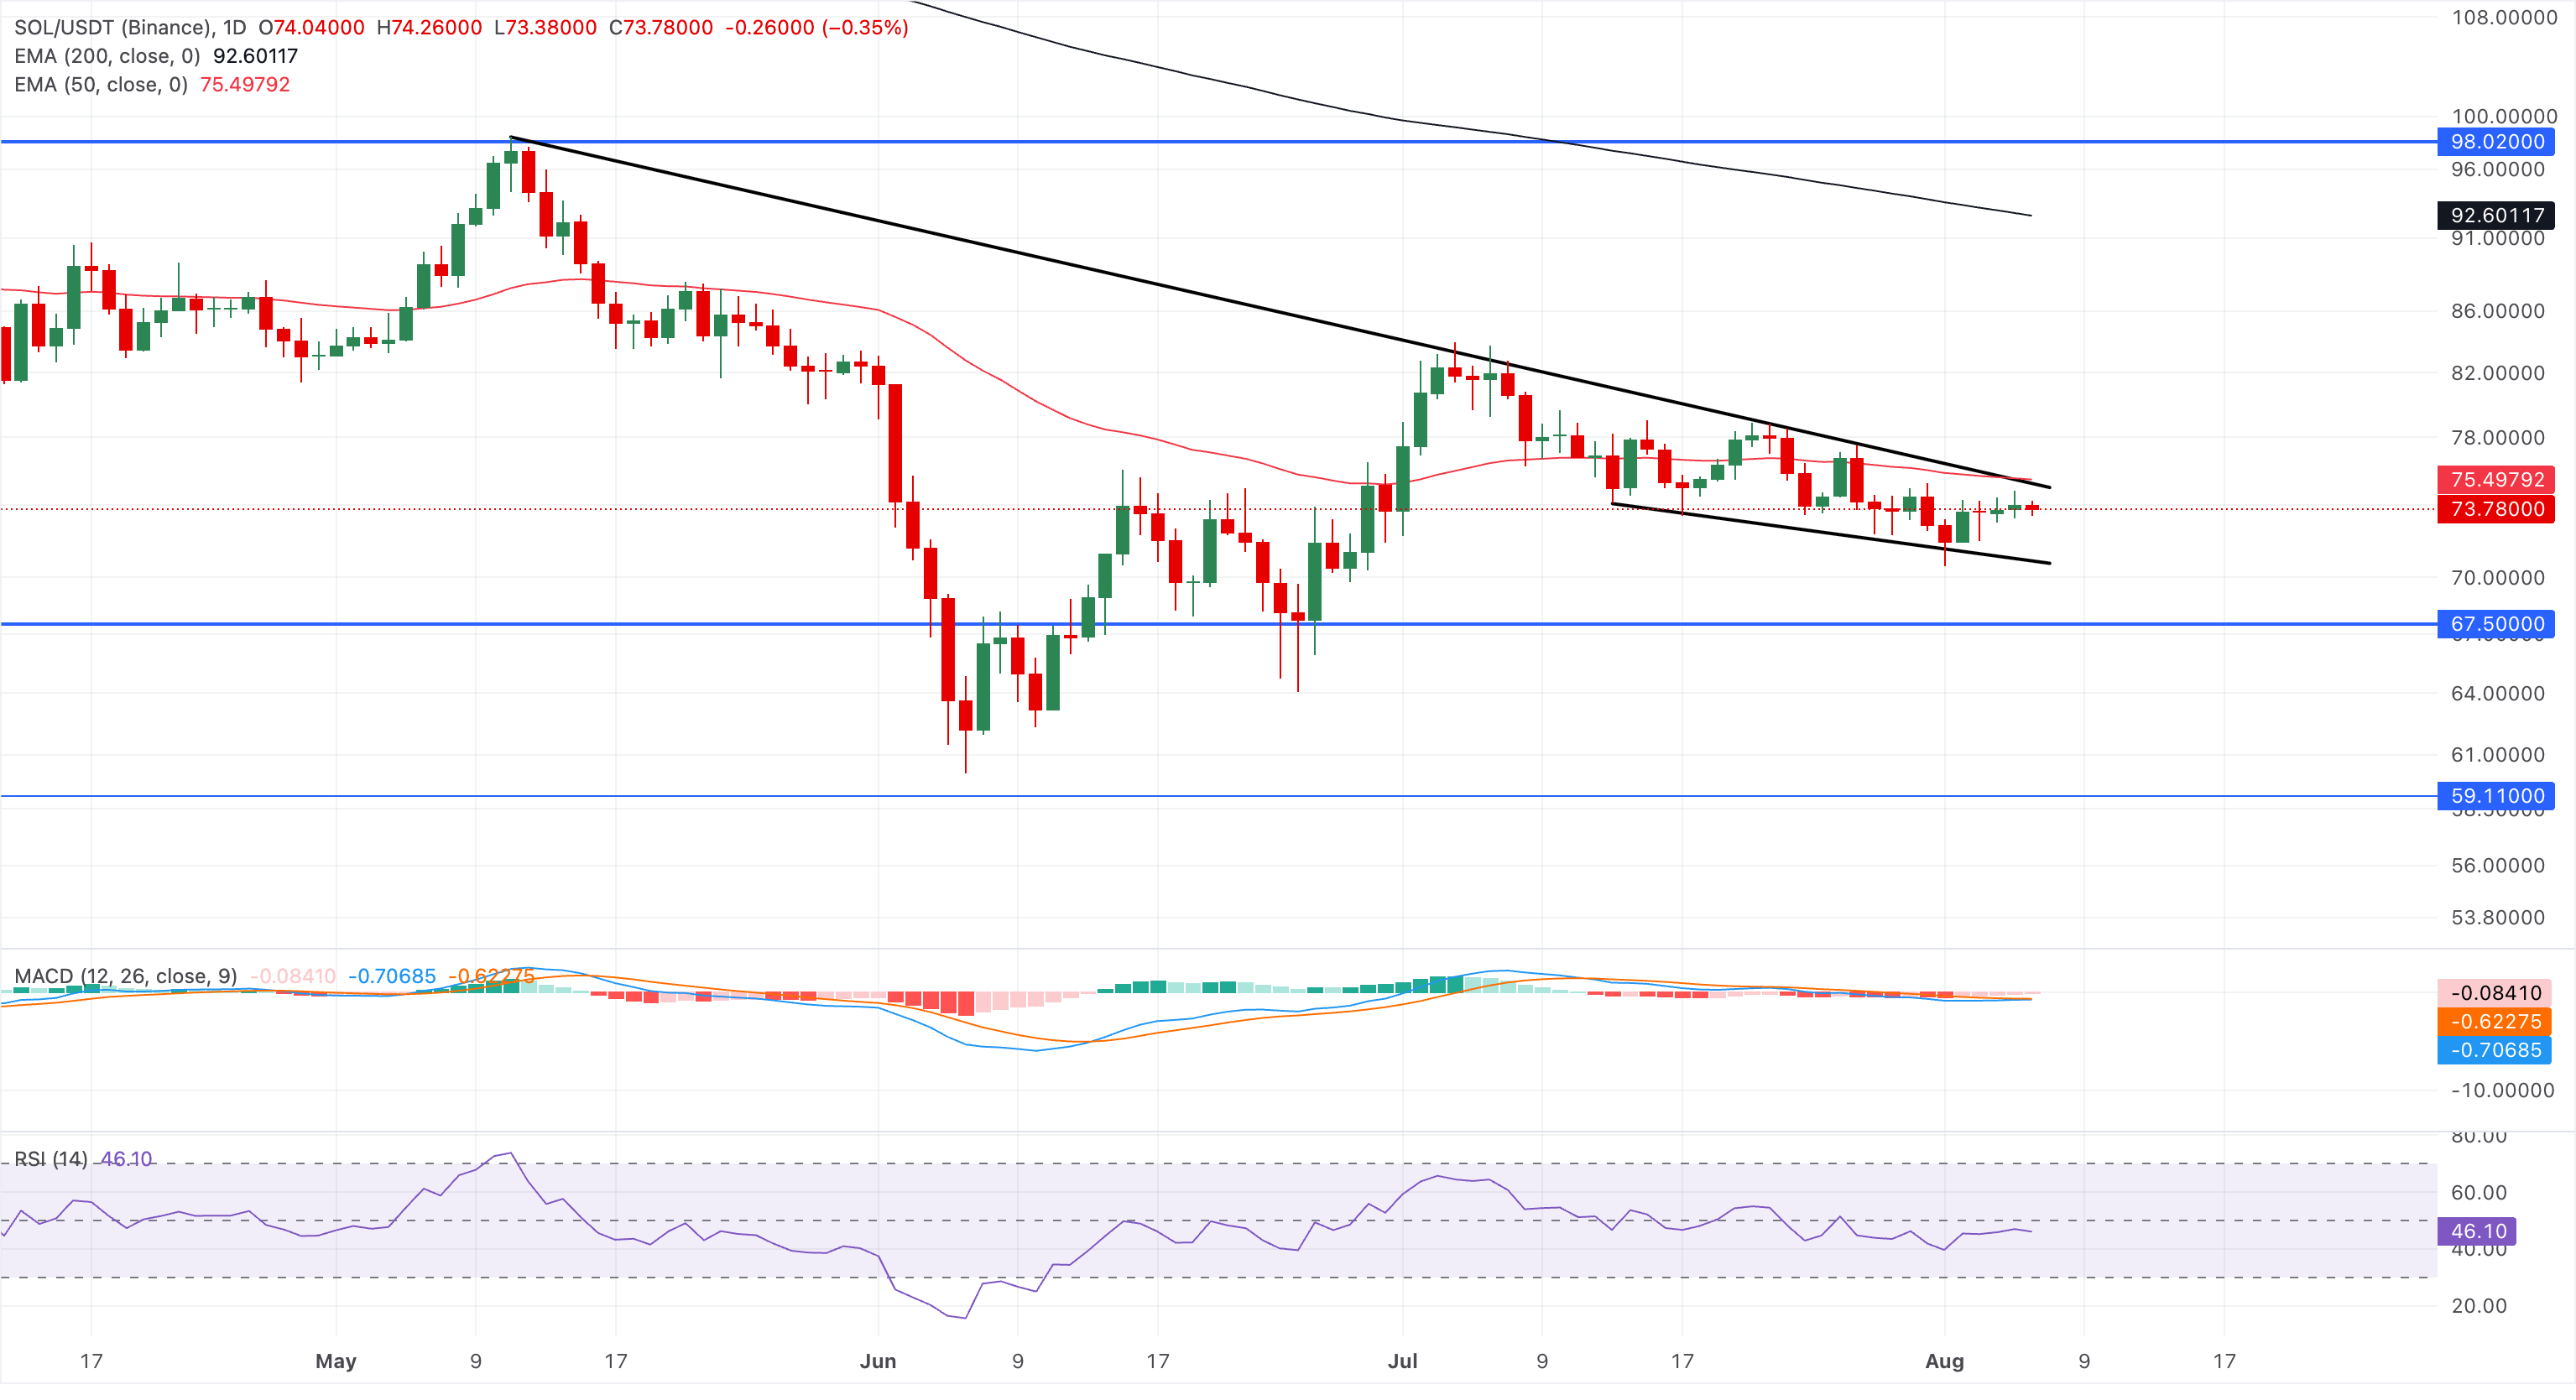
Looking down, the key support for SOL aligns with the descending support trendline near $70.75, guarding the downside to the February 6 low of $67.50.
(The technical analysis of this story was written with the help of an AI tool. Know more.)
Bài viết đề xuất


